www.ambi-agua.net E-mail: [email protected]
Rev. Ambient. Água vol. 12 n. 6 Taubaté – Nov. / Dec. 2017
Best management practices to reduce nitrate pollution in a rural
watershed in Germany
doi:10.4136/ambi-agua.2099
Received: 21 Feb. 2017; Accepted: 01 Sep. 2017
Cristiano Andre Pott1*; Nicola Fohrer2
1Universidade Estadual do Centro-Oeste (UNICENTRO), Guarapuava, PR, Brasil
Departamento de Agronomia. E-mail: [email protected]
2Christian-Albrechts-Universität zu Kiel (CAU), Kiel, Schleswig-Holstein, Germany
Department of Hydrology. E-mail: [email protected]
*Corresponding author
ABSTRACT
Water pollution by nitrogen originates at diffuse and point sources. In surface aquatic systems, nitrate is one of the most problematic forms of nitrogen, causing phytoplankton and macrophyte growth and consequently water eutrophication. This study evaluated whether the Soil and Water Assessment Tool (SWAT) model can simulate nitrate load in a rural watershed in daily and monthly time increments. The study investigated 462 km² of the upper part of the Stör catchment, a typical rural lowland catchment located in Northern Germany. The results showed that simulations of nitrate load at monthly increments are better predictors of observed data than daily simulations. The most effective practices to minimize the NO3-N load were the
reduction of nitrogen fertilizer application and the increasing of conservation areas, such as field filter strips.
Keywords: land use,nitrogen pollution, non-point pollution, SWAT model.
Melhores práticas de manejo para reduzir a poluição por nitrato em
uma bacia hidrográfica rural na Alemanha
RESUMO
A poluição da água causada por nitrogênio é originada por fontes difusas e pontuais. Em sistemas aquáticos superficiais, o nitrato é uma das formas mais problemáticas de nitrogênio, causando crescimento de fitoplâncton e de macrófitas e consequentemente a eutrofização da água. Este estudo teve o objetivo de avaliar se o modelo Soil and Water Assessment Tool (SWAT) pode simular a carga de nitrato em uma bacia hidrográfica rural em séries diárias e mensais. Foram investigados 462 km² da parte superior da bacia hidrográfica do rio Stör, uma bacia de planície tipicamente rural localizada no norte da Alemanha. Os resultados mostraram que as simulações de carga de nitratos em incrementos mensais são melhores preditores de dados observados do que simulações diárias. As práticas mais efetivas para minimizar as cargas de NO3-N foram a redução da aplicação de fertilizante nitrogenado e o incremento de áreas de
conservação, tal como as faixas filtro.
Rev. Ambient. Água vol. 12 n. 6 Taubaté – Nov. / Dec. 2017
1. INTRODUCTION
Water pollution problems have been encountered all over the world in the last decades. Many substances are potential pollutants: nutrients used in agricultural systems (Lam et al., 2012; Pieterse et al., 2003), heavy metals (Chon et al., 2012) and pesticides (Fohrer et al., 2014). In surface water bodies, the nitrogen input plays an important role in water quality because this nutrient is essential for phytoplankton (Wu et al., 2011) and macrophyte growth (Jarvie et al., 1998) and for water eutrophication (Cao et al., 2011). According to Grabowska (2012), favorable conditions for phytoplankton growth consists if total N > 1.5 mg L-1.
Nutrients enter surface waters through point or diffuse sources (Jamshidi et al., 2010; Lam et al., 2010; Merseburger et al., 2011). Point sources can enter at fixed locations, e.g. wastewater treatment plant outlets, industries, pig farms or aquaculture (Merseburger et al., 2011). While point sources cause abrupt hydrological and chemical discontinuities along the stream, diffuse sources are not as spatially discrete and cause more gradual changes (Lam et al., 2010; Merseburger et al., 2011).
Diffuse sources contribute through many different pathways and are highly dependent on land use and management (Kronvang et al., 2008; Pieterse et al., 2003). The application of N fertilizer in agriculture and pasture areas is the major source of diffuse pollution (Jarvie et al., 2010; Lam et al., 2010). Fertilizer management is one way to reduce nutrient loads in surface water bodies (Pieterse et al., 2003). According to Kronvang et al. (2008), the measures applied in the agricultural production system need to focus on improved utilization of animal manure, fertilizer and crop rotation plans, maximized utilization of feed-stuffs and limitations on total N application.
Diffuse pollution is one of the most challenging issues in catchment management (Chon et al., 2012). To reduce water pollution, public policies aim to change agricultural practices by supporting land use and management practices that limit the risks of N transfers to streams. These practices are called environment-friendly or best management practices (BMPs), and consist of catch crops, reduced fertilization, conversion of arable land to pasture, grass filter strips, no tillage and conservation tillage systems (Laurent and Ruelland, 2011).
The effectiveness of BMPs for the reduction of agricultural non-point sources of pollution is difficult to evaluate and the monitoring of such changes would be costly and time consuming (Liu et al., 2013). After adequate calibration and validation of a ecohydrological model, such as the Soil and Water Assessment Tool (SWAT) model (Arnold et al., 1998), new simulation with an alternative BMP (Lam et al., 2011; Laurent and Ruelland, 2011; Liu et al., 2013) can be modeled.
This study therefore sought to calibrate and validate nitrate load using the SWAT model to verify which environmental measures can reduce N loads in a rural lowland catchment.
2. MATERIAL AND METHODS
2.1. Characterization of the study area
Rev. Ambient. Água vol. 12 n. 6 Taubaté – Nov. / Dec. 2017
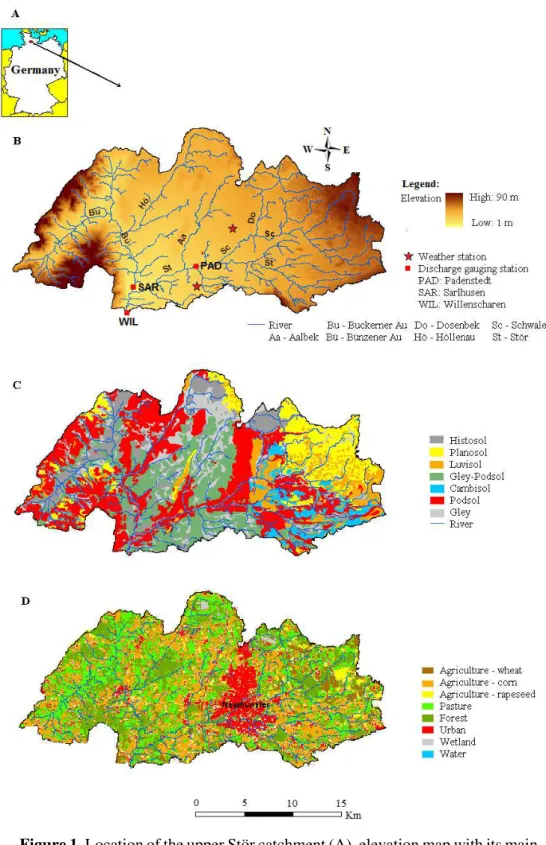
Land use is dominated by arable land and pasture (Figure 1D). According to Oppelt et al. (2011), in 2010 the pasture area was 33.1% of the total area. The major crops are winter wheat (13.7%), rapeseed (1.8%) and corn for silage (26.6%). The urban area is about 10% of the total area. The most important city is Neumünster, with nearly 88,000 citizens.
Rev. Ambient. Água vol. 12 n. 6 Taubaté – Nov. / Dec. 2017
2.2. Calculation of nitrate loads
Monthly NO3-N loads were calculated using the data of a monthly water quality
monitoring campaign from August 2009 until July 2011, which was multiplied by the mean monthly discharge data obtained by the gauging stations of LKN (2012) that have daily monitoring. Daily NO3-N load was calculated with the daily water quality data collected with
the automatic water sampler installed at Willenscharen and the respective daily discharge of this gauge station.
2.3. SWAT model description
In this study, the software ArcSWAT2009 (Version 2009.93.7b Revision Nr. 488) was
used to simulate water discharge nitrate load. It is a SWAT interface for ESRI ArcGIS 9.3.1 SP2 (http://swat.tamu.edu). The SWAT model is a continuous model for long-term
observations, which run on daily, monthly or annual increments (Neitsch et al., 2011). NO3-N
load were simulated in daily and monthly increments. The model represents the large-scale spatial heterogeneity of the study area by dividing the watershed into sub-basins. The sub-basins are then further subdivided into hydrologic response units (HRUs) based on homogeneous soils, land use and slopes (Neitsch et al., 2011). The details of all components can be found in Arnold et al. (1998) and Neitsch et al. (2011). The different N processes modeled by SWAT in N pools of the soil are described by Neitsch et al. (2011).
2.4. Model calibration and validation
The reliability of results from a model is based on performance of the calibration and validation. Calibration is the process of estimating model parameters by comparing model predictions (output) for a given set of assumed conditions with observed data for the same conditions. Validation involves running a model in a study period different than the calibration period and using input parameters measured or determined during the calibration process (Moriasi et al., 2007).
The standard procedure for the simulation is to use a period of time for the calibration and a subsequent period of time for validation. For this study, the validation in an antecedent time was used (August 8th 2009 to August 7th 2010), while de calibration period was run between
August 8th 2010 and August 7th 2011. This division was carried out so that the calibration period
would conform to the actual land use map dated from July 2010. For all simulations, a five-year warm up period was used for the model in order to stabilize the main water and nutrient processes that occur in the SWAT model. For the NO3-N calibration, SWAT-CUP method
SUFI-2 associated to manual calibration was carried out using daily and monthly increments. The main parameters which were sensitive for NO3-N simulation with SWAT are represented
in Table 1.
2.5. Performance of the model
To evaluate the performance of a model, measured and simulated values must be compared (Moriasi et al., 2007). Two methods were applied in parallel to calibrate the SWAT model. The measured and simulated values were first subjected to a graphical comparison, then the adjustment by statistical analyses was assessed.
The most important statistical index parameters used in this study to evaluate the performance of the SWAT model were the Coefficient of determination (R²), the Nash-Sutcliffe efficiency (NSE) and the Percent bias (PBIAS). R² describes the degree of collinearity between simulated and measured data. R² ranges from 0 to 1, with higher values indicating less error variance. NSE is a normalized statistic that determines the relative magnitude of the residual variance compared to the measured data variance (Nash and Sutcliffe, 1970). Moriasi et al. (2007) classified the efficiency of nutrients’ simulation at monthly increments as “very good”
Rev. Ambient. Água vol. 12 n. 6 Taubaté – Nov. / Dec. 2017
and “unsatisfactory”with NSE ≤ 0.50. PBIAS measures the average tendency of the simulated data to be larger or smaller than their observed counterparts. The optimal value for PBIAS is zero. Positive values indicate model underestimation bias, and negative values indicate model overestimation bias. According to Moriasi et al. (2007), PBIAS < ±25 is “very good”, ±25 ≤ PBIAS < ±40 is “good”, ±40 ≤PBIAS < ±70 is “satisfactory”, and PBIAS ≥ ±70 is “unsatisfactory” for monthly nutrient simulation increments.
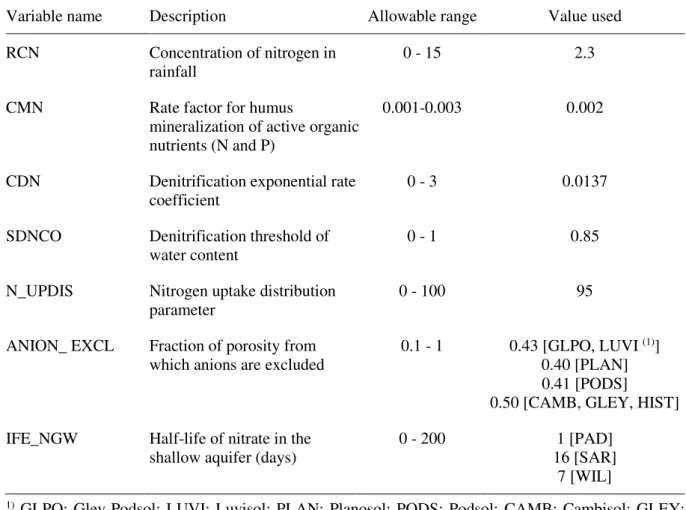
Table 1. Main variables used for NO3-N load calibration with the SWAT model.
Variable name Description Allowable range Value used
RCN Concentration of nitrogen in
rainfall 0 - 15 2.3
CMN Rate factor for humus
mineralization of active organic nutrients (N and P)
0.001-0.003 0.002
CDN Denitrification exponential rate
coefficient 0 - 3 0.0137
SDNCO Denitrification threshold of
water content 0 - 1 0.85
N_UPDIS Nitrogen uptake distribution
parameter 0 - 100 95
ANION_ EXCL Fraction of porosity from
which anions are excluded 0.1 - 1 0.43 [GLPO, LUVI
(1)] 0.40 [PLAN] 0.41 [PODS]
0.50 [CAMB, GLEY, HIST]
IFE_NGW Half-life of nitrate in the
shallow aquifer (days) 0 - 200 16 [SAR] 1 [PAD] 7 [WIL]
1) GLPO: Gley-Podsol; LUVI: Luvisol; PLAN: Planosol; PODS: Podsol; CAMB: Cambisol; GLEY: Gley soil, HIST: Histosol.
2.6. Input data
The basic data sets required to set-up the model inputs are: topography, soil, land use and climatic data set (Arnold et al., 1998; Neitsch et al., 2011). In this study, the SWAT model was subdivided into 21 sub-basins and 1402 HRUs. The soil map from Finnern (1997) and the land use map from Oppelt et al. (2011) was used in this study. Daily climate data sets were obtained by DWD (2012). The classification of the hydrologic soil group (HYDGRP) was ranked as suggested by Neitsch et al. (2011). For the simulation of nutrient balance, the information on management options and fertilizer applications are essential. The management schedules for crop rotation and fertilizer application for the calibration and validation period were created with information from LWK (2011).
2.7. Simulation of Best Management Practices scenarios
After calibration and validation of the NO3-N load, alternative scenarios were simulated
Rev. Ambient. Água vol. 12 n. 6 Taubaté – Nov. / Dec. 2017
measures which reduce the negative impact of agriculture on the water quality of a river network (Lam et al., 2011). Changes in nutrient load among the scenarios compared to the baseline scenario (current calibrated and validated) provided the percentage of reduction in N and P pollution in the upper Stör catchment. The simulated BMP scenarios were implemented for the period of January 1st 2009 to December 31st 2011 using the same climatic conditions of the
calibration and validation periods. The main BMP scenarios tested in this study are described in Table 2.
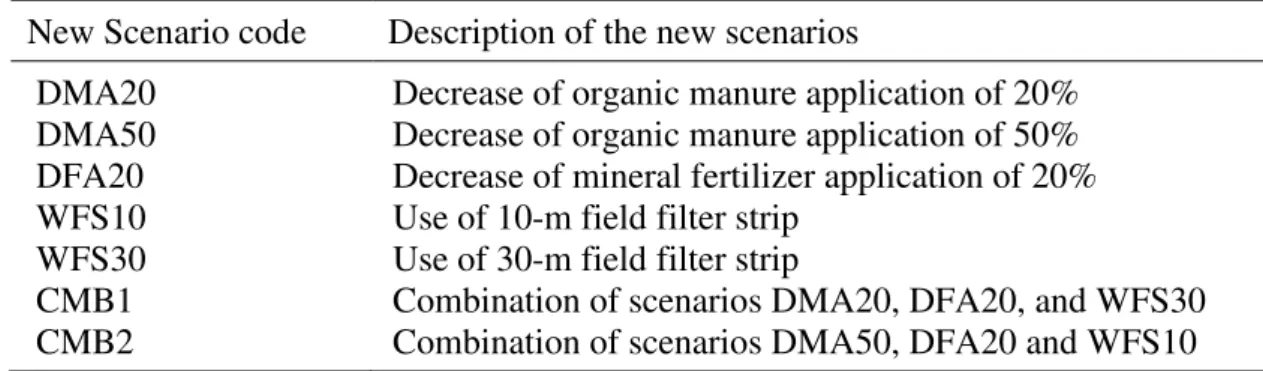
Table 2. Scenarios simulation based on BMPs to reduce N and P pollution at the upper Stör catchment.
New Scenario code Description of the new scenarios
DMA20 Decrease of organic manure application of 20% DMA50 Decrease of organic manure application of 50% DFA20 Decrease of mineral fertilizer application of 20% WFS10 Use of 10-m field filter strip
WFS30 Use of 30-m field filter strip
CMB1 Combination of scenarios DMA20, DFA20, and WFS30 CMB2 Combination of scenarios DMA50, DFA20 and WFS10
3. RESULTS AND DISCUSSION
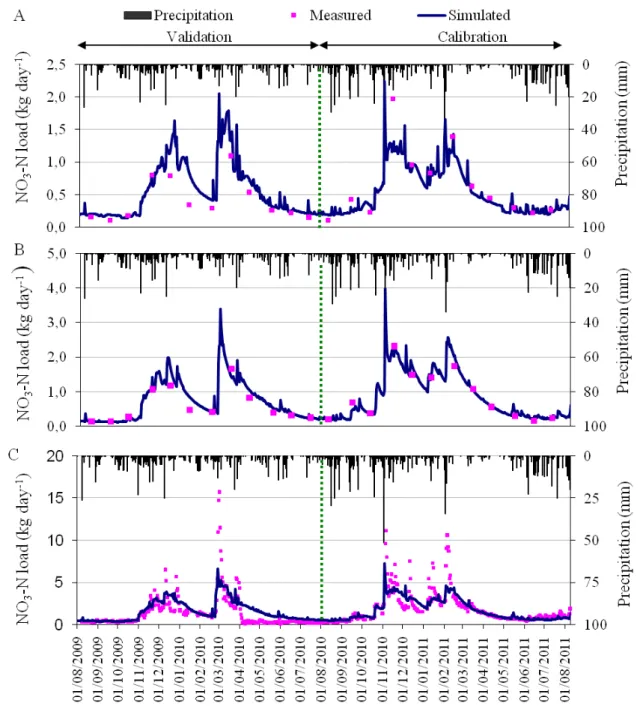
Figure 2 shows the daily calibration (August 8th 2010 - August 10th 2011) and validation
period (August 8th 2009 - August 7th 2010) of NO
3-N load from the Padenstedt, Sarlhusen and
Willenscharen gauge stations. The results of daily NO3-N load simulation showed R² between
0.63 - 0.95 for the calibration and 0.60 - 0.87 for the validation, NSE between 0.62 - 0.94 in the calibration period and 0.50 - 0.78 in the validation period (Table 3). Figure 3 shows the monthly calibration (August 2010 - July 2011) and validation period (August 2009 - July 2010) of NO3-N
load from the Padenstedt, Sarlhusen and Willenscharen gauge stations.
Jamshidi et al. (2010), simulating daily NO3-N load in a mountainous catchment in Iran,
achieved a NSE of 0.55 and 0.36 for the calibration and validation periods, respectively. For monthly simulation, these authors found better NSE, 0.82 and 0.57 for the calibration and validation periods, respectively. Lam et al. (2009) studying daily NO3-N load at the lowland
Kielstau, found a NSE of 0.64 and 0.50 for the calibration and validation periods, respectively. Pisinaras et al. (2010) simulating daily NO3-N load with SWAT using monthly measured data
obtained very good calibration, with a NSE varying between 0.86 to 0.90 for four gauging stations in a mountainous catchment in Greece. The results of performance of daily NO3-N
simulation of the Padenstedt and Sarlhusen gauge stations (Figure 2A, Figure 2B, Table 3), where monthly measurement data for the calibration and validation of the model was used, showed very good performance, according to the ranking of Moriasi et al. (2007). However, for the daily calibration with daily measured data, the SWAT modeling does not perform well, as seen in the results of daily NO3-N simulation of the Willenscharen gauge (Figure 2C, Table 3).
The daily NO3-N load simulation of the Willenscharen gauge station (Figure 2C) showed
underestimation of various peaks in the calibration and validation periods; however, at the calibration period, PBIAS = 0.2, indicates a slight overestimation of NO3-N load in the
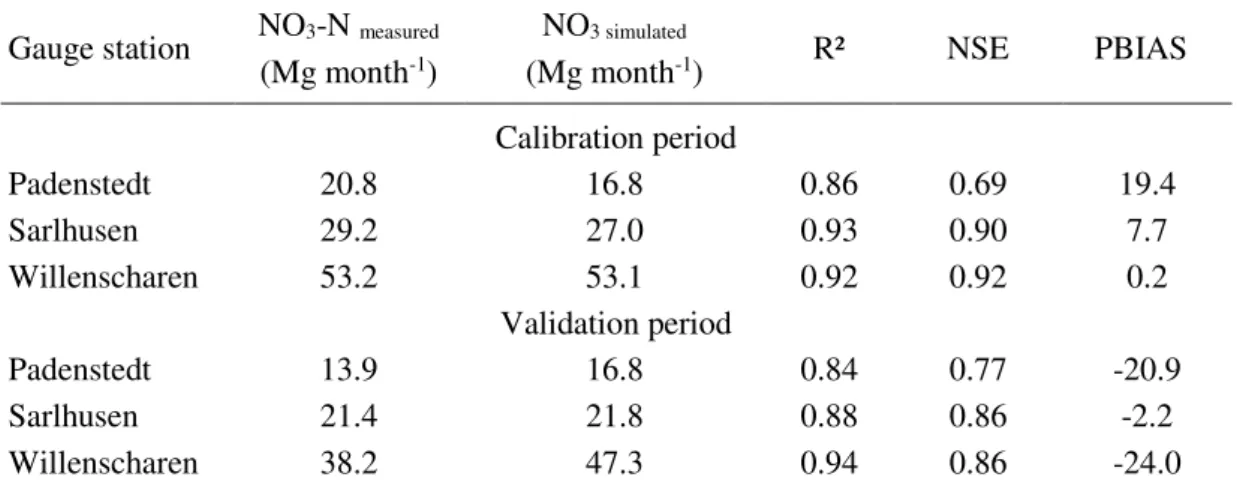
simulated data. The monthly NO3-N load modeling showed underestimation in winter months
in the calibration, represented by PBIAS values 19.4, 7.7 and 0.2, respectively for the Padenstedt, Sarlhusen and Willenscharen gauges (Table 4). The validation of NO3-N load
Rev. Ambient. Água vol. 12 n. 6 Taubaté – Nov. / Dec. 2017
the validation; NSE was between 0.69 - 0.92 in calibration and 0.77 - 0.86 in the validation period (Table 4). According to Moriasi et al. (2007), these results indicated a performance ranging from good to very good for NO3-N modeling with the SWAT model.
Figure 2. Measured and simulated daily NO3-N loads at the gauges Padenstedt (A), Sarlhusen (B) and Willenscharen (C) in the calibration and validation periods.
One reason for the success of the NO3-N load simulation in this lowland catchment may
be attributed to the strong influence of hydrologic components linked to groundwater, as described by Pott et al. (2014). Table 1 describes the main parameters that were sensitive to NO3-N load calibration, which can influence the subsurface movement of NO3-N, such as the
Rev. Ambient. Água vol. 12 n. 6 Taubaté – Nov. / Dec. 2017
Figure 3. Measured and simulated monthly NO3-N load at the Padenstedt (A), Sarlhusen (B) and Willenscharen (C) gauges in the calibration and validation periods.
Daily monitoring is important to verify the real dynamics of water quality, such as peaks of nutrient concentration at specific times and could assist in understanding the dynamics of N by modeling, while monthly modeling quantifies the overall load occurring during a period of time.
With the SWAT model calibrated and validated, it was possible to conduct other studies in order to create alternative scenarios to reduce NO3-N pollution. Hydrological processes that
Rev. Ambient. Água vol. 12 n. 6 Taubaté – Nov. / Dec. 2017
Table 3. Performance rating parameters of the daily NO3-N load at the Padenstedt, Sarlhusen and Willenscharen gauges during the calibration and validation periods.
Gauge station NO3-N measured (Mg day-1)
NO3-N simulated
(Mg day-1) R² NSE PBIAS
Calibration period
Padenstedt 0.64 0.57 0.86 0.79 11.8
Sarlhusen 0.88 0.91 0.95 0.94 -3.3
Willenscharen 1.82 1.73 0.63 0.62 5.0
Validation period
Padenstedt 0.41 0.55 0.86 0.50 -36.1
Sarlhusen 0.59 0.69 0.87 0.78 -17.4
Willenscharen 1.23 1.53 0.60 0.56 -24.3
Table 4. Performance rating parameters of the monthly NO3-N load at the Padenstedt, Sarlhusen and Willenscharen gauges during the calibration and validation periods.
Gauge station NO3-N measured (Mg month-1)
NO3 simulated
(Mg month-1) R² NSE PBIAS
Calibration period
Padenstedt 20.8 16.8 0.86 0.69 19.4
Sarlhusen 29.2 27.0 0.93 0.90 7.7
Willenscharen 53.2 53.1 0.92 0.92 0.2
Validation period
Padenstedt 13.9 16.8 0.84 0.77 -20.9
Sarlhusen 21.4 21.8 0.88 0.86 -2.2
Willenscharen 38.2 47.3 0.94 0.86 -24.0
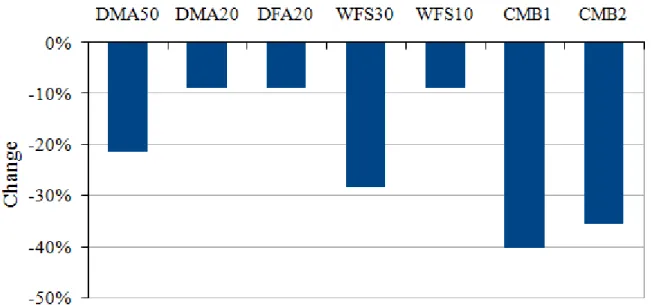
The results of the reduction of the NO3-N load by implementing new BMPs scenarios with
the SWAT model are shown in Figure 4. The BMPs linked with the reduction of fertilizer application (DMA50, DMA20, DFA20) were efficient to minimize the NO3-N load. BMPs
related to the implementation of field filter strips were also effective in reducing the NO3-N
load. WFS30 reduced NO3-N better than WFS10. Finally, the combination of various BMPs
showed a greater reduction of N pollution. Two combinations were tested in this study, CMB1 and CMB2. CMB1 is a combination of the DMA20, DFA20 and WFS30 scenarios. CMB2 is a combination of the DMA50, DFA20 and WFS10 scenarios. CMB1 reduces 20% the mineral fertilizer and organic manure and introduces the 30 m-width of field filter strip. CMB2 works with a smaller filter strip (10m), but reduces the application of organic manure to 50%. It is clear that intensive BMPs are necessary to minimize N and P pollution in rivers coming from diffuse sources. In this case, a reduction of fertilizer application (organic or mineral) and/or an increase in protection areas (areas without use of fertilizer) are important to reduce the NO3-N
and TP load into the rivers.
Laurent and Ruelland (2011), testing several alternative scenarios in a French catchment, verified that fertilizer reduction was the most effective practice to reduce NO3-N pollution.
Other studies about SWAT modeling in lowland catchments aiming to determine new scenarios also verified efficient reduction of NO3-N pollution when the reduction of N fertilizer was
Rev. Ambient. Água vol. 12 n. 6 Taubaté – Nov. / Dec. 2017
agriculture areas, obtained a decrease of 13% of total nitrogen load. At the lowland Kielstau catchment, Lam et al. (2011) achieved reduction of 10% of NO3-N load with an alternative
scenario called Nutrient Management Plan, which consisted of a reduction of 20% of N fertilizer.
Figure 4. Average annual reduction in NO3-N load at the Willenscharen gauge station by implementing new BMPs scenarios.
The success of NO3-N load reduction by use of decreasing of N fertilizer can be attributed
to the strong influence of hydrologic components linked to drainage and groundwater in this typist lowland catchment. Kennedy et al. (2012) also established the influence of tile drainage on NO3-N load in different tile drainage densities. In this sense, there are important parameters
that can influence the subsurface movement of NO3-N, such as the denitrification threshold of
water content (SDNCO), the NO3 percolation coefficient (NPERCO), the fraction of porosity
from which anions are excluded (ANION_EXCL) and the half-life of NO3 in the shallow
aquifer (HLIFE_NGW).
Ferrant et al. (2013) tested long-term simulation of NO3-N mitigation using the TNT2
model in a pilot study catchment in France. They stated that a global reduction of fertilization by 10% would decrease NO3-N fluxes in streams by 13.8%.
Although N input to water bodies from agricultural non-point sources of pollutants are difficult to control, it is of prime importance to continually search for ways to reduce inputs of contaminants into surface waters (Larose et al., 2011). The reduction of fertilizer application is one of the most effective BMPs to minimize the nitrate pollution in agriculture areas (Lam et al., 2011; Schilling and Wolter, 2009; Yevenes and Mannaerts, 2011). Schilling and Wolter (2009), employing the SWAT model, showed that the reduction of fertilizer applications from 170 to 50 kg ha-1 achieved a 34.4% reduction in NO
3-N load in the Des Moines River watershed
in USA. Yevenes and Mannaerts (2011), simulating land-use alternatives on NO3-N load with
the SWAT model in Portugal, stated that a fertilizer reduction scenario was effectively implemented to evaluate remedial NO3-N control policies.
Rev. Ambient. Água vol. 12 n. 6 Taubaté – Nov. / Dec. 2017
an increased fraction of grassland and abandoned land at the expense of cultivated and ploughed areas; and iii) better farm-management practices. Nie et al. (2009) recommend the following effective methods for reducing N loss from farmlands: 1) use of best management practices, such as reduced irrigation and split application of N fertilizer; 2) use of controlled-release fertilizers instead of conventional fertilizers; 3) the adoption of high-N use efficiency crop genotypes; 4) the application of new tools, such as modeling, as well as N indexing; and 5) the use of deep-rooted crops in crop rotations systems.
4. CONCLUSIONS
In general, monthly time increments of NO3-N load better predict observed performance
than daily simulations.
A consistent data set of monitoring is essential to achieve good calibration and validation using an ecohydrological model, such as the SWAT model.
Most effective BMPs obtained to minimize N pollution were linked to the reduction of N fertilizer application and the increasing of conservation areas without the use of any fertilizer, such as field filter strips.
5. ACKNOWLEDGEMENTS
We would like to thank the Coordenação de Aperfeiçoamento de Pessoal de Nível Superior (CAPES) for the doctorate scholarship of the first author.
6. REFERENCES
ARNOLD, J. G.; SRINIVASAN, R.; MUTTIAH, R. S.; WILLIAMS, J. R. Large area hydrologic modelling and assessment. Part I. Model development. Journal of the American Water Resources Association, v. 113, n. 2, p. 243-256, 1998. http://dx.doi.org/10.1111/j.1752-1688.1998.tb05961.x
CAO, Z.; ZHANG, X.; AI, N. Effect of sediment on concentration of dissolved phosphorus in the Three Gorges Reservoir. International Journal of Sediment Research, v. 26, n. 1, p. 87-95, 2011. http://dx.doi.org/10.1016/s1001-6279(11)60078-4
CHON, H. S.; OHANDJA, D. G.; VOULVOULIS, N. A risk-based approach to prioritise catchments for diffuse metal pollution management. Science of the total environment, v. 437, n. p. 42-52, 2012. http://dx.doi.org/10.1016/j.scitotenv.2012.07.045
DEUTSCHER WETTERDIENST – DWD. Precipitation data 1975-2012, Climate station
Padenstedt and Neumünster. 2012. Available in:
http://werdis.dwd.de/werdis/start_js_JSP.do Access in: 2012.
FERRANT, S.; DURAND, P.; JUSTES, E.; PROBST, J.-L.; SANCHEZ-PEREZ, J.-M. Simulating the long-term impact of nitrate mitigation scenarios in a pilot study basin.
Agricultural Water Management, v. 124, n. p. 85-96, 2013.
http://dx.doi.org/10.1016/j.agwat.2013.03.023
Rev. Ambient. Água vol. 12 n. 6 Taubaté – Nov. / Dec. 2017
FOHRER, N.; DIETRICH, A.; KOLYCHALOW, O.; ULRICH, U. Assessment of the environmental fate of the herbicides Flufenacet and Metazachlor with the SWAT Model.
Journal of environmental quality, v. 43, n. 1, p. 75-85, 2014.
http://dx.doi.org/10.2134/jeq2011.0382
GRABOWSKA, M. The role of a eutrophic lowland reservoir in shaping the composition of river phytoplankton. Ecohydrology & Hydrobiology, v. 12, n. 3, p. 231-242, 2012. http://dx.doi.org/10.1016/s1642-3593(12)70206-9
HESSE, C.; KRYSANOVA, V.; PÄZOLT, J.; HATTERMANN, F. F. Eco-hydrological modelling in a highly regulated lowland catchment to find measures for improving water quality. Ecological Modelling, v. 218, n. 1-2, p. 135-148, 2008. http://dx.doi.org/10.1016/j.ecolmodel.2008.06.035
IITAL, A.; STÅLNACKE, P.; DEELSTRA, J.; LOIGU, E.; PIHLAK, M. Effects of large-scale changes in emissions on nutrient concentrations in Estonian rivers in the Lake Peipsi drainage basin. Journal of Hydrology, v. 304, n. 1-4, p. 261-273, 2005. http://dx.doi.org/10.1016/j.jhydrol.2004.07.034
JAMSHIDI, M.; TAJRISHY, M.; MAGHREBI, M. Modeling of point and non-point source pollution of nitrate with SWAT in the Jajrood river watershed, Iran. International
Agricultural Engineering Journal, v. 19, n. 2, p. 23-31, 2010.
http://114.255.9.31/iaej/EN/Y2010/V19/I02/23
JARVIE, H. P.; WHITTON, B. A.; NEAL, C. Nitrogen and phosphorus in east coast British rivers: Speciation, sources and biological significance. Science of The Total
Environment, v. 210-211, n. p. 79-109, 1998.
http://dx.doi.org/10.1016/s0048-9697(98)00109-0
JARVIE, H. P.; WITHERS, P. J. A.; BOWES, M. J.; PALMER-FELGATE, E. J.; HARPER, D. M.; WASIAK, K. et al. Streamwater phosphorus and nitrogen across a gradient in rural–agricultural land use intensity. Agriculture, Ecosystems & Environment, v. 135, n. 4, p. 238-252, 2010. http://dx.doi.org/10.1016/j.agee.2009.10.002
KENNEDY, C. D.; BATAILLE, C.; LIU, Z.; ALE, S.; VANDEVELDE, J.; ROSWELL, C. R. et al. Dynamics of nitrate and chloride during storm events in agricultural catchments with different subsurface drainage intensity (Indiana, USA). Journal of Hydrology, v. 466-467, n. p. 1-10, 2012. http://dx.doi.org/10.1016/j.jhydrol.2012.05.002
KRONVANG, B.; ANDERSEN, H. E.; BØRGESEN, C.; DALGAARD, T.; LARSEN, S. E.; BØGESTRAND, J. et al. Effects of policy measures implemented in Denmark on nitrogen pollution of the aquatic environment. Environmental Science & Policy, v. 11, n. 2, p. 144-152, 2008. http://dx.doi.org/10.1016/j.envsci.2007.10.007
LAM, Q. D.; SCHMALZ, B.; FOHRER, N. Ecohydrological modelling of water discharge and nitrate loads in a mesoscale lowland catchment, Germany. Advances in Geosciences, v. 21, n. p. 49-55, 2009. http://dx.doi.org/10.5194/adgeo-21-49-2009
LAM, Q. D.; SCHMALZ, B.; FOHRER, N. Modelling point and diffuse source pollution of nitrate in a rural lowland catchment using the SWAT model. Agricultural Water
Management, v. 97, n. 2, p. 317-325, 2010.
Rev. Ambient. Água vol. 12 n. 6 Taubaté – Nov. / Dec. 2017
LAM, Q. D.; SCHMALZ, B.; FOHRER, N. The impact of agricultural Best Management Practices on water quality in a North German lowland catchment. Environmental monitoring and assessment, v. 183, n. 1-4, p. 351-379, 2011.
LAM, Q. D.; SCHMALZ, B.; FOHRER, N. Assessing the spatial and temporal variations of water quality in lowland areas, Northern Germany. Journal of Hydrology, v. 438-439, n. p. 137-147, 2012. http://dx.doi.org/10.1016/j.jhydrol.2012.03.011
LAROSE, M.; HEATHMANN, G. C.; NORTON, D.; SMITH, D. Impacts of conservation buffers and grasslands on total phosphorus loads using hydrological modeling and remote
techniques. Catena, v. 2, n. p. 121-129, 2011.
https://doi.org/10.1016/j.catena.2011.03.005
LAURENT, F.; RUELLAND, D. Assessing impacts of alternative land use and agricultural practices on nitrate pollution at the catchment scale. Journal of Hydrology, v. 409, n. 1-2, p. 440-450, 2011. http://dx.doi.org/10.1016/j.jhydrol.2011.08.041
LIU, R.; ZHANG, P.; WANG, X.; CHEN, Y.; SHEN, Z. Assessment of effects of best management practices on agricultural non-point source pollution in Xiangxi River watershed. Agricultural Water Management, v. 117, n. p. 9-18, 2013. http://dx.doi.org/10.1016/j.agwat.2012.10.018
LANDESBETRIEB FÜR KÜSTENSCHUTZ, NATIONALPARK UND MEERESSCHUTZ SCHLESWIG-HOLSTEIN - LKN. Discharge data from gauges Padenstedt, Sarlhusen and Willenscharen. LKN: Schleswig-Holstein, 2012. 100p.
LANDWIRTSCHAFTSKAMMER SCHLESWIG-HOLSTEIN - LWK. Richtwerte für die Düngung 2011. 21. ed. Rendsburg: LWK, 2011. 280p.
MERSEBURGER, G.; MARTI, E.; SABATER, F.; ORTIZ, J. D. Point-source effects on N and P uptake in a forested and an agricultural Mediterranean streams. Science of the Total
Environment, v. 409, n. 5, p. 957-67, 2011.
http://dx.doi.org/10.1016/j.scitotenv.2010.11.014
MORIASI, D. N.; ARNOLD, J. G.; LIEW, M. W. V.; BINGNER, R. L.; HARMEL, R. D.; VEITH, T. L. Model evaluation guidelines for systematic quantification of accuracy in watershed simulations. Transactions of the ASABE, v. 50, n. 3, p. 885-900, 2007. http://dx.doi.org/10.13031/2013.23153
NASH, J. E.; SUTCLIFFE, J. V. River flow forecasting through conceptual models part I — A discussion of principles. Journal of Hydrology, v. 10, n. 3, p. 282-290, 1970. https://doi.org/10.1016/0022-1694(70)90255-6
NEITSCH, S. L.; ARNOLD, J. G.; KINIRTY, J. R.; WILLIANS, J. R. Soil and water assessment tool: Theoretical documentation Version 2009. Grassland: Blackland Research Center; Texas Agricultural Experimental StationSoil; Water Research Laboratory; Agricultural Research Service, 2011. 618p.
Rev. Ambient. Água vol. 12 n. 6 Taubaté – Nov. / Dec. 2017
OPPELT, N.; RATHJENS, H.; BAASE, T. Landnutzungsklassifikation des Einzugsgebietes der oberen Stör auf Basis von Landsat TM Daten aus dem Jahr 2010. Kiel: Christian-Albrechts-Univertity, 2011. 50p.
PIETERSE, N. M.; BLEUTEN, W.; JØRGENSEN, S. E. Contribution of point sources and diffuse sources to nitrogen and phosphorus loads in lowland river tributaries. Journal of
Hydrology, v. 271, n. 1-4, p. 213-225, 2003.
http://dx.doi.org/10.1016/s0022-1694(02)00350-5
PISINARAS, V.; PETALAS, C.; GIKAS, G. D.; GEMITZI, A.; TSIHRINTZIS, V. A. Hydrological and water quality modeling in a medium-sized basin using the Soil and Water Assessment Tool (SWAT). Desalination, v. 250, n. 1, p. 274-286, 2010. http://dx.doi.org/10.1016/j.desal.2009.09.044
POTT, C. A.; JADOSKI, S. O.; SCHMALZ, B.; HÖRMANN, G.; FOHRER, N. Temporal variability of nitrogen and phosphorus concentrations in a German catchment: Water sampling implication. Revista Brasileira de Engenharia Agrícola e Ambiental, v. 18, n. 8, p. 811-818, 2014. http://dx.doi.org/10.1590/1807-1929/agriambi.v18n08p811818 SCHILLING, K. E.; WOLTER, C. F. Modeling nitrate-nitrogen load reduction strategies for
the Des Moines River, Iowa using SWAT. Environmental management, v. 44, n. 4, p. 671-82, 2009. http://dx.doi.org/10.1007/s00267-009-9364-y
WU, N.; SCHMALZ, B.; FOHRER, N. Distribution of phytoplankton in a German lowland river in relation to environmental factors. Journal of Plankton Research, v. 33, n. 5, p. 807-820, 2011. http://dx.doi.org/10.1093/plankt/fbq139