2017
UNIVERSIDADE DE LISBOA
FACULDADE DE CIÊNCIAS
DEPARTAMENTO DE BIOLOGIA ANIMAL
Characterization of the molecular pathogenesis of a
malformation syndrome associated with a complex double
chromosome translocation
Mariana Sofia Carvalho Marques
Mestrado em Biologia Humana e Ambiente
Dissertação orientada por:
Doutor Dezső David
Professora Doutora Deodália Dias
I
A
CKNOWLEDGEMENTS
Antes de mais quero agradecer ao Instituto Nacional de Saúde Doutor Ricardo Jorge e, em especial, ao Departamento de Genética Humana por me terem acolhido durante o período de desenvolvimento desta Dissertação.
Agradeço ao Doutor Dezső David pela orientação e acompanhamento dados ao longo deste percurso, pela disponibilidade e pela oportunidade de aprendizagem e integração no Grupo de Investigação em Doenças Genómicas.
Agradeço igualmente à Professora Deodália Dias pelo apoio que me deu em todas as alturas, por estar sempre disponível e por me ter tirado as dúvidas mais importantes nas alturas mais inusitadas.
Gostaria também de agradecer a todos os parceiros da Harvard Medical School pela assistência prestada, especialmente à Doutora Cynthia Morton e ao Doutor Michael Talkowski.
Agradeço também ao Dr. João Freixo do serviço de Genética Médica do Hospital Dona Estefânia, sem quem não teria sido possível a revisão fenotípica do caso apresentado nesta dissertação, bem como ao Dr. Rui Gonçalves por ter indicado pela primeira vez este caso para estudo em projeto de investigação.
Um grande obrigado ao Doutor José Manuel Furtado por me ter ensinado técnica asséptica e mostrado a beleza da cultura de células.
Quero agradecer também aos meus (passados e presentes) colegas e amigos de trabalho. À Raquel pela passagem do conhecimento e pela amizade com que me acolheu, à Carina pela ajuda a perceber os meandros da secretaria e pelo constante carinho, à Patrícia que sempre foi uma querida, ao José Ferrão por se ter tornado o meu apoio nas alturas em que já não sabia para que lado me virar, à Mariana que torna os momentos mais tristes em sorrisos, à Joana pela ajuda com a minha falta de paciência para tecnologia e pela alegria e diversão que trouxe ao trabalho, à Inês que mesmo triste nunca dispensa um sorriso e à Neuza que se tornou uma grande amiga.
Mais, quero agradecer à Manuela por me ter acompanhado em todos os passos do caminho, nos piores e nos melhores dias.
Aos meus amigos, à Natacha por nunca ter desistido de me chatear mesmo quando eu passo dias sem dizer nada e ao meu grupo de licenciatura, a Raquel e o Renato, por fazerem questão de manter uma amizade à distância que é tão importante para mim.
Ao Zé que nunca me deixou durante o caminho, que me deu a mão mesmo quando eu queria fugir e que fez questão de me manter à tona dos nossos sonhos.
Agradeço muito à minha família, aos meus pais que nunca deixaram de me apoiar mesmo nos piores momentos e por me abanarem até eu voltar a mim. Obrigada Pai e Mãe por TUDO! À Susana que com a sua música conseguiu simultaneamente chatear-me e fazer-me rir que nem uma perdida. Aos meus Avós que nunca pararam de me dar carinho. Avó, eu sei que sabes e que quando tenho dúvidas só tenho de perguntar que tu explicas!
Um grande obrigado a todos os que passaram este tempo comigo!
II
A
BSTRACT
Congenital anomalies are devastating conditions responsible for high neonatal mortality, as well as high morbidity of the surviving individuals. Chromosomal rearrangements are a leading cause of severe congenital malformations and are associated with about 25% of perinatal deaths due to congenital anomalies.
The aim of this study is the identification of candidate genes responsible for the phenotype characterized by intrauterine growth retardation, severe developmental delay, brain malformations and refractory epilepsy identified in an individual with an apparently balanced de novo double chromosomal translocation t(2;7)(q23;q32),t(5;6)(q23;q26)dn.
Identification and mapping of the structural chromosomal aberrations were performed by whole-genome array analysis, array painting with genomic amplicons of the derivative chromosomes and by whole genome sequencing of large-insert jumping libraries (liWGS). Subsequently all junction fragments were amplified and the breakpoints were identified at nucleotide resolution by Sanger sequencing.
Genome array analysis identified a 651.76 kb deletion at 14q24.3 (g.76,673,181-77,324,937 [GRCh37/hg19]). Transforming growth factor beta 3 (TGFB3), a gene associated with autosomal dominant arrythmogenic right ventricular dysplasia and Loeys-Dietz syndrome (OMIM #107970 and #615582), is situated 224 kb upstream from the proximal deletion breakpoint..
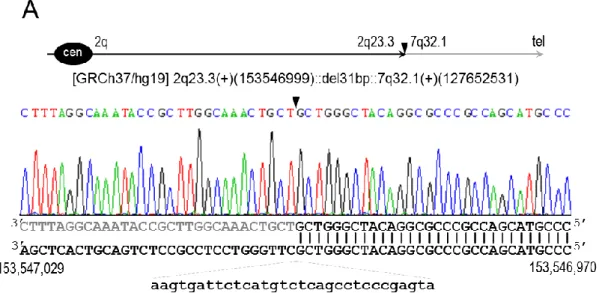
Translocation breakpoints were identified both by array painting and liWGS. The 2q23.3 breakpoint of the t(2;7)(q23.3;q32.1), disrupts IVS5 of pre-mRNA processing factor 40 homolog A (PRPF40A), a protein coding gene related to Huntington’s disease (OMIM#143100). The calcium channel, voltage-dependent, beta-4 subunit (CACNB4) gene, localized 600 kb upstream of this breakpoint, is associated with three epilepsy related autosomal dominant disorders (OMIM #613855, 607682 and 607682). The Staphylococcal nuclease and tudor domain containing 1 (SND1) gene disrupted by the 7q32.1 breakpoint, is not presently associated with any known phenotype. However, the RNA binding motif protein 28 coding gene (RBM28), situated 300 kb downstream of the 7q32.1 breakpoint, has been associated with progressive neurological defects (OMIM #612079).
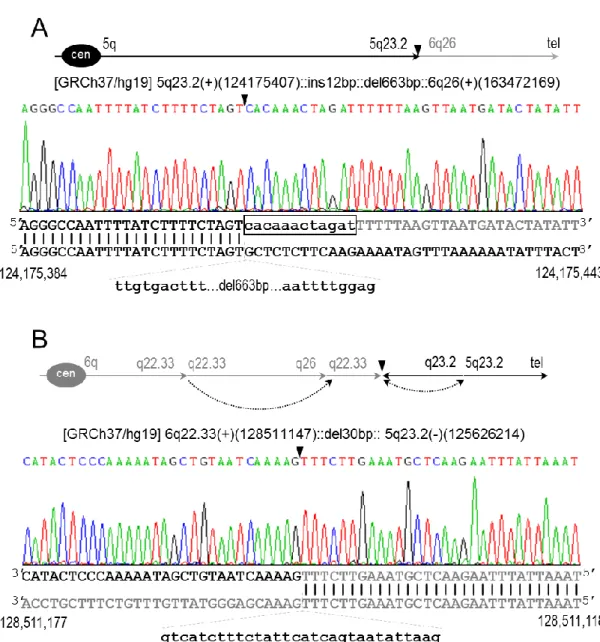
Concerning the t(5;6)(q23.2;q26) translocation, the 5q23.2 breakpoint is situated in an intergenic region whereas the 6q26 breakpoint disrupts IVS3 of PARK2 co-regulated gene (PACRG). This gene shares a bidirectional promoter with parkin RBR E3 ubiquitin protein ligase (PARK2), which is associated with early onset Parkinson disease. About 300kb downstream of this breakpoint is the homolog of quaking mouse (QKI) gene that also plays a role in brain development.
III The application of liWGS unveiled the presence of two additional cryptic alterations on der(6), an excision/insertion and an inversion.
The cryptic excision at 6q22.33 disrupts protein tyrosine phosphatase receptor type K (PTPRK), a gene from the protein tyrosine phosphatase family which is associated with tumor suppression. As a result of the excision/insertion, the excised 48 kb fragment containing PTPRK exon 7 and flanking intronic sequences is inserted 36 Mb further distal at 6q26. Located 70kb from the PTPRK gene, the laminin 2 (LAMA2) gene was reported has being involved in brain malformations, including polymicrogyria. The inversion breakpoint at 5q23.2 is located within an intergenic region.
In conclusion, these findings suggest that disruption of PRPF40A and PACRG genes, in association with misregulation of CACNB4, RBM28, PARK2, QKI and LAMA2 genes from the breakpoint regions are the most likely candidate genes responsible for this complex malformation phenotype. Additionally the modulating effect of TGFB3 gene cannot be excluded.
Comparative analysis of this complex chromosome rearrangement by array painting and liWGS demonstrates that currently only liWGS is able to identify the full spectrum of balanced, otherwise cryptic, structural alterations. In this way, liWGS allows high-throughput delineation of chromosomal rearrangements, allowing a better phenotype-genotype association.
A major drawback of studying chromosome anomalies is the unavailability of relevant human biological material or of data from such samples. Theoretically, to overcome this issue, animal or induced pluripotent stem cells models can be used.
During this study, the obtainment of a proband-specific iPSC model was attempted. Unfortunately, the complexity of the pluripotency induction process, the associated costs and the requisites of using non-viral vectors hinder the development of such cellular models for the study of the molecular pathogenesis of congenital anomalies.
Proband derived lymphoblastoid cell line (LCL), non-integrative episomal plasmids containing the four Yamanaka factors – OCT3/4, c-MYC, SOX2 and KLF4 and an electroporation platform were used for the pluripotency induction experiments. Electroporated cells were maintained on a human foreskin fibroblasts (HFF) feeder-layer.
While performing the reprogramming experiments, several technical difficulties were identified. A major difficulty is achieving high transfection efficiency of LCL with episomal plasmids without high cell mortality rates. Although no LCL derived iPSC colonies were obtained, the identification of the critical steps in the induction protocol of LCL derived cells will certainly contribute for further development of such cellular models.
IV Furthermore, the availability of individual-derived iPSCs will definitely lead to a robust cellular model for the study of the molecular pathogenesis of chromosome rearrangements associated with congenital anomalies.
Keywords: Congenital anomalies; Complex chromosome rearrangement; large-insert Whole Genome
Sequencing; induced Pluripotent Stem Cells.
V
R
ESUMO
As anomalias congénitas constituem uma das principais causas da mortalidade fetal, neonatal e infantil na Europa. Adicionalmente, devido à gravidade dos fenótipos apresentados pelos indivíduos que sobrevivem, este tipo de anomalias contribui em grande medida para a morbilidade, sobrecarregando em muito o sistema público de saúde.
Os rearranjos cromossómicos constituem uma das principais causas no desenvolvimento de malformações congénitas graves e estão associados a cerca de 25% das mortes devidas a anomalias congénitas no período perinatal. Por seu lado, os rearranjos cromossómicos estruturais, nomeadamente deleções, duplicações, inversões e translocações cromossómicas, têm vindo a ser recorrentemente associados a diversos fenótipos deletérios, nomeadamente síndromes malformativos caracterizados por atraso global do desenvolvimento psicomotor e anomalias cerebrais graves.
O principal objetivo deste estudo é a identificação de genes candidatos responsáveis pelo fenótipo caracterizado por atraso do crescimento intrauterino, atraso grave do desenvolvimento psicomotor, malformações cerebrais e epilepsia refratária identificado num indivíduo portador de uma translocação cromossómica dupla de novo, aparentemente equilibrada - t(2;7)(q23;q32),t(5;6)(q23;q26)dn.
A identificação e mapeamento das alterações cromossómicas estruturais foi realizada através da utilização de array genómico, de array painting com amplicões dos cromossomas derivados e ainda por sequenciação pangenómica de grandes insertos (do inglês large-insert Whole Genome
Sequencing). Seguidamente, todos os fragmentos de junção das diversas alterações estruturais foram
amplificados e os respetivos pontos de quebra foram identificados com resolução nucleotídica por sequenciação de Sanger.
Através da análise do array genómico foi possível a identificação de uma deleção de 651.76 kb na banda 24.3 do cromossoma 14, nas posições g.76,673,181- 77,324,937 (Genoma de Referência [GRCh37/hg19]). A montante do ponto de quebra proximal da deleção, a uma distância de 224 kb, o gene codificante para o fator de transformação do crescimento beta 3 (TGFB3) encontra-se associado a duas doenças autossómicas dominantes, displasia arritmogénica do ventrículo direito e síndrome de Loeys-Dietz (OMIM#107970 e #615582).
Os pontos de quebra da translocação dupla foram identificados por array painting e por sequenciação pangenómica de grandes insertos. O ponto de quebra do derivado do cromossoma 2 da t(2;7)(q23.3;q32.1) interrompe o homólogo para o fator 40 de processamento de pré-mRNA (PRPF40A), um gene codificante para uma proteína associada com a doença de Huntington (OMIM#143100). O gene codificante para a subunidade beta do canal de cálcio dependente de voltagem (CACNB4), localizado 600 kb a montante deste ponto de quebra está associado com três
VI condições autossómicas dominantes que envolvem diversos variantes de epilepsia (OMIM #613855, #607682 e #607682). O gene codificante para a nuclease estafilocócica e domínio tudor 1 (SND1), que se encontra interrompido pelo ponto de quebra do derivado do cromossoma 7, não está, presentemente, associado a qualquer fenótipo conhecido. Por outro lado, o gene codificante para a proteína 28 de ligação de RNA (RBM28), localizado 300 kb a jusante do ponto de quebra deste derivado, tem vindo a ser associado a defeitos neurológicos progressivos (OMIM #612079).
Relativamente à translocação t(5;6)(q23.2;q26), o ponto de quebra do derivado do cromossoma 5 está localizado numa região intergénica, enquanto que o ponto de quebra da translocação no derivado do cromossoma 6 interrompe o terceiro intrão do gene co-regulador da Parkina (PACRG). Este gene partilha um promotor bidirecional com o gene codificante para a proteína ubiquitina ligase da Parkina RBR E3 (PARK2), o qual se encontra associado com o aparecimento precoce da doença de Parkinson. A jusante deste ponto de quebra, a cerca de 300 kb, encontra-se o gene homólogo do murganho
quaking (QKI), o qual apresenta igualmente um papel no desenvolvimento cerebral.
A aplicação da sequenciação pangenómica de grandes insertos revelou a presença de duas novas alterações crípticas no derivado do cromossoma 6, uma excisão/inserção e uma inversão.
A excisão críptica na banda q22.33 no derivado do cromossoma 6 interrompe o gene codificante para o recetor da proteína tirosina fosfatase tipo K (PTPRK). Este gene é um membro da família das proteínas fosfatases de tirosina que se encontram maioritariamente associadas à supressão de tumores. Como resultado da excisão/inserção o fragmento excisado, que tem uma extensão de 48 kb, contém o exão 7 do gene PTPRK e flanqueia sequências intrónicas, é inserido a montante no ponto de quebra da banda 6q26, a uma distância de 36 Mb. Localizado 70 kb a jusante do gene PTPRK, o gene codificante para a laminina 2 (LAMA2) foi reportado como estando envolvido em malformações cerebrais, incluindo polimicrogiria. Por outro lado, o ponto de quebra da inversão no 5q23.2 está localizado numa região intergénica.
Em suma, os dados encontrados sugerem que a interrupção dos genes PRPF40A e PACRG, em associação com a desregulação dos genes CACNB4, RBM28, PARK2, QKI e LAMA2 que flanqueiam as regiões dos pontos de quebra, serão os genes candidatos mais prováveis para a explicação do fenótipo reportado de malformação complexa. Adicionalmente, o efeito modulador do gene TGFB3, que se encontra a montante do ponto de quebra proximal da deleção no cromossoma 14, não poderá para já ser excluído.
A análise comparativa deste rearranjo cromossómico complexo por array painting e por sequenciação pangenómica de grandes insertos, permitiu demonstrar que, neste momento, apenas a última abordagem tem a capacidade de identificar o espectro completo dos rearranjos cromossómicos estruturais aparentemente equilibrados, que de outra forma continuariam desconhecidos. Desta forma,
VII a sequenciação pangenómica de grandes insertos permite a delineação dos rearranjos cromossómicos estruturais com uma elevada resolução, permitindo uma associação mais fiável entre o genótipo e o fenótipo reportados.
Um dos principais obstáculos no estudo de anomalias cromossómicas é a indisponibilidade de material biológico humano relevante, bem como de dados acerca desse mesmo material biológico. Teoricamente, de forma a ultrapassar este problema poderão se utilizados modelos animais ou modelos celulares, incluindo células pluripotentes induzidas.
Durante o decorrer deste estudo foram iniciadas as experiências para a obtenção de um modelo de células pluripotentes induzidas específicas do indivíduo portador da translocação t(2;7)(q23;q32),t(5;6)(q23;q26)dn. Contudo, a complexidade do processo de indução de pluripotência, os custos associados e a necessidade da não utilização de vetores virais, dificultou grandemente o desenvolvimento deste modelo celular para o estudo da patogénese molecular das anomalias congénitas apresentadas.
De forma a realizar as experiências de indução de pluripotência foram utilizadas linhas linfoblastóides derivadas do indivíduo índex, plasmídeos epissomais não integrativos contendo os quatro fatores de Yamanaka - OCT3/4, c-MYC, SOX2 e KLF4 – e uma plataforma de eletroporação celular. As células eletroporadas e em processo de indução foram mantidas numa camada de suporte constituída por fibroblastos de prepúcio humano inativados por radiação gama.
Ao longo do desenvolvimento destas experiências foram encontradas diversas dificuldades técnicas. A principal dificuldade encontrada deteve-se na obtenção de uma elevada eficiência de transfecção da linha linfoblastóide com os plasmídeos epissomais sem obter, simultaneamente, taxas de mortalidade excessivamente elevadas. Apesar de não ter sido possível a obtenção de colónias de células pluripotentes derivadas da linha linfoblastóide, foram identificados os passos críticos do protocolo de indução, o que contribuirá certamente para o futuro desenvolvimento destes modelos celulares.
Adicionalmente, a disponibilidade de células pluripotentes induzidas específicas para cada indivíduo portador de um rearranjo cromossómico irá definitivamente conduzir a um modelo celular robusto para o estudo da patogénese molecular dos rearranjos cromossómicos associados com anomalias congénitas e síndromes malformativos. Da mesma forma, a possibilidade de diferenciar células pluripotentes induzidas específicas de um indivíduo índex em quaisquer células dos três folhetos embrionários é, sem dúvida, uma vantagem no estudo dos rearranjos cromossómicos.
Palavras-Chave: Anomalias congénitas; Rearranjos cromossómicos complexos; sequenciação
pangenómica de grandes insertos; células pluripotentes induzidas
VIII
T
ABLE OF
C
ONTENTS
ACKNOWLEDGEMENTS ... I ABSTRACT ... II RESUMO ... V TABLES LIST ... X FIGURES LIST ... X ABBREVIATIONS ... XI 1. INTRODUCTION ...1 1.1. CHROMOSOME STRUCTURE ...11.2. STRUCTURAL CHROMOSOMAL REARRANGEMENTS ...1
1.3. CONGENITAL MALFORMATIONS ASSOCIATED WITH CHROMOSOMAL REARRANGEMENTS ...3
1.4. METHODOLOGY EVOLUTION ON THE STUDY OF CHROMOSOMAL STRUCTURAL ANOMALIES ...4
1.4.1. Classic Cytogenetic ...4
1.4.2. Fluorescence in situ hybridization ...5
1.4.3. Array-based Comparative Genomic Hybridization and Array painting ...5
1.4.4. Next-Generation Sequencing ...6
1.5. MODELS FOR THE STUDY OF STRUCTURAL CHROMOSOMAL ANOMALIES PHENOTYPIC CONSEQUENCES ...8
1.5.1. Induced Pluripotent Stem Cells ...8
2. OBJECTIVES ...12
3. MATERIAL AND METHODS ...13
3.1. DETERMINING CHROMOSOME BREAKPOINTS ...13
3.1.1. Sample collection ...13
3.1.2. Establishment and maintenance of lymphoblastoid cell lines ...13
3.1.3. DNA extraction from peripheral blood and LCL ...14
3.1.4. High Resolution Genomic Array ...15
3.1.5. Flow sorting of derivative chromosomes, Genomic amplification and Array painting ...15
3.1.6. Large-insert Whole Genome sequencing ...15
3.1.7. Amplification of junction fragments and Sanger sequencing ...16
3.2. PLURIPOTENCY INDUCTION ...17
3.2.1. Plasmid isolation and characterization ...17
3.2.2. Feeder Layer Inactivation ...19
IX
4. RESULTS ...21
4.1. CLINICAL DESCRIPTION ...21
4.2. CYTOGENETIC STUDIES ...21
4.3. UNBALANCED GENOMIC ALTERATIONS ...22
4.4. COMPARATIVE MAPPING OF THE TRANSLOCATION’S BREAKPOINTS...25
4.5. AMPLIFICATION AND SEQUENCING OF JUNCTION FRAGMENTS ...28
4.6. IDENTIFICATION OF POSSIBLE CANDIDATE GENES AT THE TRANSLOCATION’S BREAKPOINTS33 4.7. IDENTIFICATION OF POSSIBLE CANDIDATE GENES AT THE CRYPTIC ALTERATIONS’ BREAKPOINTS ...37
4.8. PLURIPOTENCY INDUCTION FROM INDIVIDUAL SPECIFIC CELLS ...37
4.8.1 Characterization of electroporation ready plasmid DNA ...37
4.8.2 Feeder Layer ...39
4.8.3 Electroporation Optimization Assay and Plasmid Transfection ...40
5. DISCUSSION ...42
5.1. IDENTIFICATION OF THE BREAKPOINT REGIONS OF THE REPORTED DE NOVO DOUBLE TRANSLOCATION ...42
5.2. ESTABLISHMENT OF AN INDIVIDUAL-SPECIFIC IPSC MODEL ...44
6. CONCLUSIONS AND FUTURE PERSPECTIVES ...46
7. BIBLIOGRAPHY ...48
8. ANNEX ...58
X
T
ABLES
L
IST
Table 3.1: Sequence of the primers used in the amplification of the junction fragments of the double
translocation ... 16
Table 3.2: Plasmids used for pluripotency induction ... 18
F
IGURES
L
IST
Figure 3.1: PBMCs isolation and mature LCL culture. ... 14Figure 4.1: Pedigree of the proband’s family with the de novo double translocation. ... 22
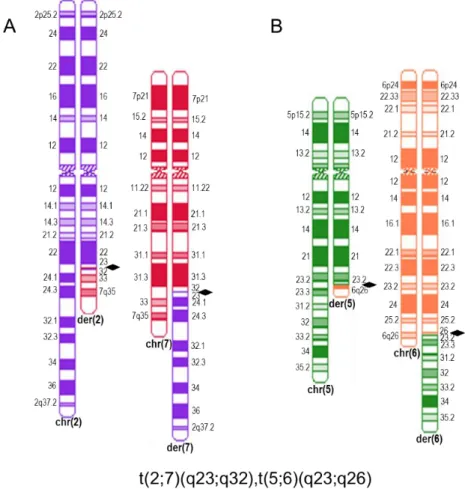
Figure 4.2: Ideograms of t(2;7)(q23;q32) and t(5;6)(q23;q26) ... 22
Figure 4.3 Overview of the chromosome 14q24.3 deletion region. ... 24
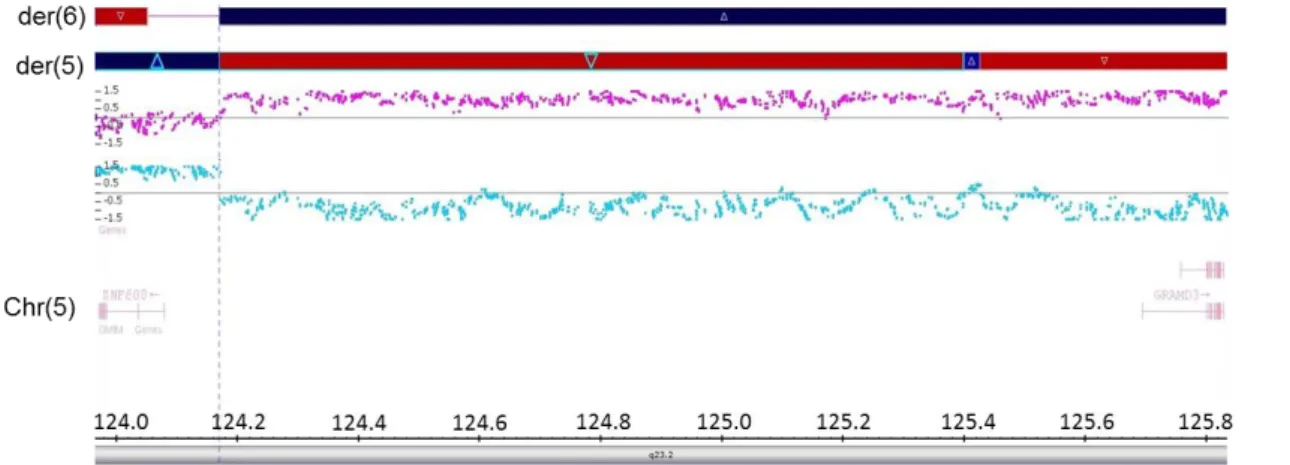
Figure 4.4: Array analysis of the t(5;6) breakpoint using CytoScan HD array from Affymetrix ... 25
Figure 4.5: Mapping of the breakpoints by li-WGS. ... 27
Figure 4.6: Amplification and DNA sequence of the der(2), der(7), der(5) and der(6) junction and control fragments. ... 29
Figure 4.7: Breakpoints of t(2;7)(q23.3;q32.1) at nucleotide resolution. ... 30
Figure 4.8: Breakpoints of t(5;6)(q23.2;q26) at nucleotide resolution. ... 31
Figure 4.9: Breakpoints of the cryptic rearrangements found in der(6) at nucleotide resolution ... 32
Figure 4.10: Physical maps across the breakpoint regions of t(2;7)(q23.3;q32.1). ... 35
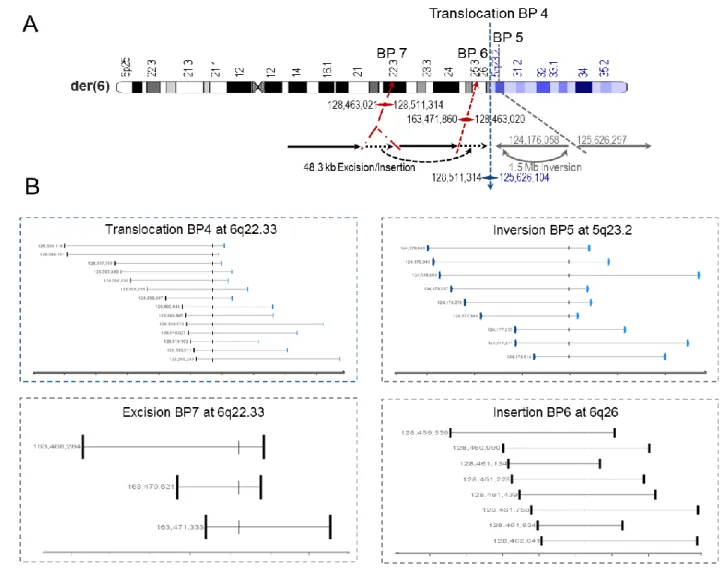
Figure 4.11: Physical maps across the breakpoint regions of t(5;6)(q23.2;q26), including the rearrangements found by liWGS. ... 36
Figure 4.12: PFGE agarose gel depicting all the plasmids used to induce pluripotency. ... 38
Figure 4.13: Agarose gels depicting whole plasmids and their enzymatic digestion with EcoRV and SpeI... 38
Figure 4.14: Inactivated human foreskin fibroblasts as feeder-layer. ... 39
Figure 4.15: Optimization assay of Lonza’s SF kit using LCL culture. ... 40
XI
A
BBREVIATIONS
ARVD1 arrhythmogenic right ventricular dysplasia, familial, 1 BACs bacterial artificial chromosomes
bp base pairs
chr chromosome
CCR complex chromosomal rearrangement CGH comparative genomic hybridization
CN copy number
DGAP Developmental Genome Anatomy Project DNA deoxyribonucleic acid
der derivative chromosome DSBs double strand breaks
EDTA ethylenediamine tetraacetic acid FISH fluorescence in situ hybridization FBS fetal bovine serum
GRCh37 Genome Reference Consortium Human genome build 37
Gy Gray
HFF human foreskin fibroblasts
IMDM Iscove’s Modified Dulbecco's Medium iPSC induced pluripotent stem cells
kb kilobases
LB Luria-Bertani
LDS5 Loeys-Dietz syndrome 5
liWGS Large-insert Whole Genome Sequencing
Mb megabases
MDC1A muscular dystrophy, congenital merosin-deficient, 1A NGS Next-Generation Sequencing
OMIM Online Mendelian Inheritance in Man PACs P1-derived artificial chromosomes PCR Polymerase Chain Reaction PFGE Pulsed-Field Gel Electrophoresis RPMI Roswell Park Memorial Institute RNA ribonucleic acid
TBE Tris-borate Ethylenediamine tetraacetic acid Tm melting temperature
1
1. I
NTRODUCTION
1.1. C
HROMOSOMES
TRUCTUREThe word chromosome comes from the greek khrôma, meaning colored, and sôma, meaning body (Gardner et al. 2012).
Chromosomes were first observed by light microscopy in the late 19th century in dividing
eukaryotic cells. Later, it was found that these structures corresponded to the most condensed form of chromatin, a fiber that consists in equal parts of deoxyribonucleic acid (DNA) and proteins, mostly histones (Alberts et al. 2008).
In the 1950’s, with the discovery of DNA’s double helix polymer structure by Franklin, Watson and Crick (Franklin and Gosling 1953; Watson and Crick 1953), it was found that DNA is not a structural molecule, as initially thought, but in fact it contains hereditary information. This double helix polymer consists in two antiparallel strands of complementary nucleotides - adenine and thymine, cytosine and guanine – which are organized to form genes that code the working proteins in the organism, and are in that way responsible for our hereditary information (Nelson and Cox 2008).
Most DNA is found in the cell nucleus. During interphase, it is possible to observe two conformations of the chromatin fiber, euchromatin which is more distended and is usually under active transcription processes, and heterochromatin which is highly condensed and is mainly responsible for gene regulation. During mitosis, each DNA molecule reaches its most condensed form, showing a two arms structure divided by a centromere with both arms terminating in telomeres (Nelson and Cox 2008)
Chromosome nomenclature is based on mitotic chromosomes. The short arm of the chromosome is called p, from the French word petit, and the long arm is called q. With the application of G-banding, it is also possible to identify several bands delimiting regions in each chromosome (Nelson and Cox 2008). Morphologically, chromosomes may be divided into metacentric, submetacentric, acrocentric or telocentric, according to where the centromere divides the p and q arms.
1.2. S
TRUCTURALC
HROMOSOMALR
EARRANGEMENTSStructural chromosomal rearrangements are defined as changes in the chromosomal structure that require chromosome breakage followed by abnormal end-joining (Griffiths et al. 2007). Structural chromosomal rearrangements may be balanced or unbalanced. Balanced rearrangements refer to alterations in the chromosomal gene order and may appear as inversions or translocations. On the
2 other hand, unbalanced rearrangements refer to alterations that involve gain or loss of genetic material in the form of duplications and deletions, respectively (Luthardt and Keitges 2001; Griffiths et al. 2007).
The first evidence of a chromosome inversion was published in 1921 by Alfred Sturtevant. This chromosome anomaly occurs when there are two double strand breaks (DSBs) in the same chromosome and the broken fragment rejoins the same chromosome in the reverse orientation (Kirkpatrick 2010). Inversions may be pericentric, in which the inverted region includes the centromere, or paracentric, in which the centromere is not involved in the anomalous region (Griffiths et al. 2007; Kirkpatrick 2010).
A chromosome translocation is defined as a chromosomal anomaly in which a portion of a chromosome breaks and reattaches to a different chromosome (Agarwal et al. 2006; Griffiths et al. 2007; Potter 2008; Roukos and Misteli 2014). This anomaly may originate direct gene disruption or disruption of regulatory elements, namely cis regulatory elements which are key in gene expression control. Besides this, when the previously broken sequence is rejoined a fusion gene may be formed, and its expression often leads to deleterious phenotypes (Kleinjan and Coutinho 2009; Roukos and Misteli 2014).
Deletions consist in loss of material in a single chromosome. There may be interstitial deletions, where there are two DSBs in the same chromosome and a portion of a chromosomal arm is lost, or terminal deletions, when a single break occurs near the telomere and the terminal portion of the chromosome is lost (Luthardt and Keitges 2001). Occasionally, when two terminal deletions occur the resulting non-corrected extremities fuse forming a ring chromosome, which is often highly unstable during cell division (Luthardt and Keitges 2001; Bershteyn et al. 2014).
Chromosome duplications usually occur by unequal crossing-over between homologous chromosomes (Luthardt and Keitges 2001). These anomalies may affect phenotype by altering gene dosage and, consequently, altering gene expression (Clancy et al. 2016).
In 1980, a chromosomal rearrangement involving more than two breakpoints in two or more chromosomes was defined as being a complex chromosomal rearrangement (CCR) (Pai et al. 1980). However, with the development and worldwide spreading of new techniques that allowed for a more detailed vision over chromosomal structural rearrangements, the definition of CCR has been revised. Nowadays, a structural rearrangement is considered complex not only when there are more than two breakpoints in two or more chromosomes, but also when it is possible to find more than three breakpoints independently of the number of chromosomes involved (Houge et al. 2003). In this way, CCRs may present combinations of translocations, insertions and transpositions (Pellestor et al. 2011; Liao et al. 2014).
3
1.3. C
ONGENITALM
ALFORMATIONSA
SSOCIATED WITHC
HROMOSOMALR
EARRANGEMENTSAccording to the World Health Organization, congenital malformations are defined as structural or functional anomalies that occur during the intrauterine period and can be identified prenatally, at birth or during infancy (WHO 2016).
Congenital malformations are a leading cause of fetal and infant mortality in Europe (Dolk et al. 2010). Between 2003 and 2007, the European Surveillance of Congenital Anomalies Network (EUROCAT) recorded a total prevalence of major congenital anomalies of 23.9 in every 1,000 births. Of those, 2.5% died in the first week after birth (Dolk et al. 2010). Furthermore, congenital anomalies were responsible for 2.0% of fetal deaths and stillbirths (Dolk et al. 2010).
For the surviving individuals, congenital anomalies usually have severe health consequences, highly contributing to long term morbidity and, consequently, to a major burden to the European public health system (Dolk et al. 2010; Corsello and Giuffrè 2012).
Congenital anomalies may arise both from environmental or genetic factors (Corsello and Giuffrè 2012). Chromosomal rearrangements are responsible for 15% of all major congenital anomalies diagnosed before one year of age and are associated with about 25% of perinatal deaths due to congenital anomalies (Wellesley et al. 2012).
Chromosomal structural rearrangements, including CCRs, have been associated with multiple congenital anomalies, including malformation syndromes and global developmental delay (Houge et al. 2003; Kloosterman and Hochstenbach 2014). Usually, there is a correlation between the number of breakpoints and the severity of the phenotype (Houge et al. 2003). However, the genomic localization of the chromosomal breakpoints accounts for most of the phenotypical consequences (Kloosterman and Hochstenbach 2014).
Between 2011 and 2014, a copy number variation morbidity map of developmental delay was developed by analyzing the karyotypes and phenotypes from 15,767 young individuals. The individuals presented a number of phenotypes associated with developmental delay, as for instance congenital malformation, hypotonia and feeding difficulties, speech and motor deficits, growth retardation, cardiovascular and renal defects, epilepsy, hearing impairment, craniofacial and skeletal abnormal features and behavioral issues. This analyses made it possible to further annotate candidate genes affected by unbalanced chromosomal rearrangements, including Parkin 2 (PARK2) gene, which was found to contain a fragile site prone to deletions and overall breaks (Cooper et al. 2011; Coe et al. 2014).
Balanced genomic alterations have also been reported as being associated with developmental delay. Several authors have described numerous translocations and inversions associated with
4 developmental delay, intellectual disability and congenital anomalies (Higgins et al. 2008; Talkowski et al. 2012; Schluth-Bolard et al. 2013; Utami et al. 2014).
The Developmental Genome Anatomy Project (DGAP) has described several apparently balanced translocations and inversions associated with both developmental delay and congenital malformations. In fact, of the 40 chromosomal rearrangements studied, at least 25 presented developmental delay or mental retardation (Higgins et al. 2008).
Besides developmental delay, brain abnormalities associated with neurological disorders have been described in individuals presenting either balanced or unbalanced chromosomal rearrangements.
Several balanced translocations have been reported has being associated with brain malformations. In 2007, 27 balanced translocations were described with association to cognitive disorders and brain malformations, including encephalopathies leading to epileptic seizures (De Gregori et al. 2007). Furthermore, DGAP described 6 balanced translocations associated with both cortical malformations, including microcephaly, and epileptic seizures (Higgins et al. 2008).
In 2012, a 6q26 terminal deletion, which disrupted the Parkin Co-regulated (PACRG) gene, was found to be associated with polymicrogyria, a cortical malformation characterized by the presence of small and partially fused gyri at the surface of the brain. The individual presenting this deletion also presented a phenotype of microcephaly and progressive medication refractory epilepsy that lead to non-reversible left hemiparesis (Quelin et al. 2012).
1.4. M
ETHODOLOGY EVOLUTION ON THE STUDY OF CHROMOSOMALSTRUCTURAL ANOMALIES 1.4.1. Classic Cytogenetic
After the discovery, in 1956, that the correct number of chromosomes in humans is 46 (Tjio and Levan 1956), several techniques of fixation and coloration were developed to analyze these newly found structures. The fixation of metaphase chromosomes from cultured peripheral blood leukocytes and skin fibroblasts exposed to colchicine was the first technique that allowed the observation of chromosomal anomalies (Moorhead et al. 1960). In fact, this technique allowed for the detection of the chromosomal numerical anomalies present in Down syndrome (Lejeune et al. 1959), Turner syndrome (Ford 1958) and Klinefelter syndrome (Jacobs and Strong 1959).
In 1971, G-banding was developed. This technique, based on the application of trypsin and Giemsa staining, allowed for a higher resolution chromosome staining when compared to the previous used Q-banding technique (Seabright 1971). In fact, G-banding allows for the observation of structural chromosomal rearrangements with a size higher than 5Mb (Riegel 2014). In 1973, through the use of
5 this methodology, it was possible to identify the first chromosomal translocation associated with a deleterious phenotype. It was t(9;22), the translocation responsible for the Philadelphia chromosome associated with chronic myeloid leukemia (Rowley 1973).
In 1976, the protocol for synchronization of lymphocyte cultures was developed and allowed for the obtainment of a significantly high number cell the metaphase stage for observation with G-banding (Yunis 1976). With this technique it was possible to visualize chromosomal deletions, namely the deletion in chromosome 5 associated with Cry-du-Chat syndrome (Yunis 1976).
1.4.2. Fluorescence in situ hybridization
Even though G-banding represented an enormous advancement in the observation of chromosomal structural anomalies, the resolution of this technique was tremendously limited.
In 1982, a new method for detecting specific sequences in chromosomes using fluorescence biotinylated polynucleotides was developed (Langer-Safer et al. 1982). This methodology, later called fluorescence in situ hybridization (FISH) became one of the reference techniques in detection of chromosomal anomalies.
Throughout the years, many FISH probes were developed for specific DNA sequences, making it possible to paint whole chromosomes, chromosome arms, centromeric and subtelomeric regions and it is even possible to design locus-specific probes (Durmaz et al. 2015). Furthermore, with the Human Genome Project it was possible to design more and more probes targeting specific sequences. In fact, the use of cosmids, bacterial artificial chromosomes (BACs), P1-derived artificial chromosomes (PACs) and yeast artificial chromosomes (YACs) were made available for diagnostic purposes due to the Human Genome Project (Cheung et al. 2001; Riegel 2014; Durmaz et al. 2015). The use of artificial chromosomes has since became the most used technique for mapping chromosome breakpoints and to visualize chromosome imbalances. However, the highest resolution achieved by FISH was only of 2.3kb (Vorsanova et al. 2010).
FISH increased the resolution of the identification of chromosomal structural rearrangements to a sub-microscopic level. However, the complexity of this technique and the fact that it is highly expensive and time consuming, especially when using BACs or YACs to evaluate chromosomal rearrangements in the whole genome led to the development of new techniques, namely array-based Comparative Genomic Hybridization (CGH) (Vorsanova et al. 2010; Durmaz et al. 2015).
1.4.3. Array-based Comparative Genomic Hybridization and Array painting
Chromosomal CGH was first developed in 1992 in order to detect genomic imbalances on solid tumor cells (Kallioniemi et al. 1992). This technique is based on quantitative two-color FISH. Total genomic DNA obtained from both test samples and controls is differentially labelled with two fluorescent dyes,
6 co-precipitated and co-hybridized onto normal metaphase chromosomes, which appear differentially marked according to the gain or loss of DNA content (Kallioniemi et al. 1992; Riegel 2014).
Array-based CGH has brought the advantage of not being necessary to use metaphase chromosomes to hybridize the genomic DNA of interest. In fact, DNA is hybridized to reference DNA sequences adherent to a glass slide (Solinas-Toldo et al. 1997; Pinkel et al. 1998). This technique allows for the detection of whole genome copy number variation - duplications and deletions. The resolution of array-based CGH has been improved overtime. Shorter sequences are being used as targets and now it is even possible to perform single nucleotide polymorphism arrays that allow for a resolution of 5-10kb (Scouarnec and Gribble 2011).
Even though regular array-based CGH does not allow for the detection of balanced genomic alterations, new protocols have been developed in order to solve the issue.
In 2003, a new methodology termed array painting was described. Even though this technique is not sensitive to unbalanced genomic alterations, it allows for high resolution analysis of breakpoints in balanced chromosomal rearrangements. The methodology of array painting involves the separation, by flow sorting, of the derivative (der) chromosomes from a balanced translocation. DNA of the sorted chromosomes is then amplified using degenerate oligonucleotide-primed PCR, differentially labelled and hybridized onto the array. Since der chromosomes were sorted and amplified, the fluorescence ratio appears differentiated according to which der chromosomes hybridized to which clone. When the array reads the breakpoint region where both der chromosomes hybridize, the measured fluorescence ratio is intermediate making it possible to map the breakpoint region (Fiegler et al. 2003).
1.4.4. Next-Generation Sequencing
Next-generation sequencing (NGS) methodologies were first popularized 2005. Nowadays, these technologies allow for the sequencing of a whole genome with a much lower cost and much quicker than using the traditional Sanger sequencing (Metzker 2010).
Due to a previous library preparation of DNA fragments made in order to produce sequence reads, NGS allows for the reading of millions of DNA molecules simultaneously. These reads are aligned to the a reference genome and the results are analyzed using bioinformatic tools, making it possible to analyze a whole genome and detect insertions, deletions and structural variants with a much higher resolution than it would be possible with the previously described techniques (Metzker 2010).
In 2008, the Illumina/Solexa platform, based on massive parallel sequencing, allowed for the mapping of chromosomal breakpoint regions for the first time. After chromosome flow sorting and amplification, the amplified der chromosomes were randomly fragmented and subjected to 27 to 36
7 sequencing cycles, making it possible to map the breakpoint regions with an accuracy of less than 1kb (Chen et al. 2008).
Between 2007 and 2011, genomic DNA started to be used to produce libraries, allowing to skip both the flow sorting and PCR amplification steps. This allowed for breakpoint mapping using whole genome paired-end sequencing. Breakpoint mapping was possible by identifying paired-end reads for which the respective pair (mate pair) aligned to a different region on the reference genome (Korbel et al. 2007; Chen et al. 2010; Talkowski et al. 2011).
This read-pair method was popularized due to its ability to quickly indicate the possibility of a chromosomal structural rearrangement by clustering discordant pairs. It is expected that the aligned read pairs map at a certain distance and with a determined orientation. When two read pairs map with a significantly longer distance it is indicative of a possible deletion. On the other hand, when two read pairs map in different chromosomes it is indicative of a translocation breakpoint (Scouarnec and Gribble 2011).
Between 2011 and 2014, a new method for whole genome sequencing using large-insert jumping libraries was developed. This methodology, based on the previously used mate pair protocol from SOLiD 4 System (Applied Biosystems) which includes cap adaptors for circularization of the DNA of interest and a posterior step of enzyme restriction, was adapted for 25 cycle Illumina sequencing (Talkowski et al. 2011; Hanscom and Talkowski 2014).
The resulting libraries consist on short DNA fragments that represent junctions of much larger circularized genomic fragments. The use of such short reads allow for effective genomic coverage, with only 2,74% of non-covered genomic regions, and also minimizes the cost of performing Whole Genome Sequencing (Talkowski et al. 2011; Hanscom and Talkowski 2014).
This protocol has since been used to identify several structural chromosomal rearrangements, identifying cryptic rearrangements that would not have been otherwise unraveled. The newly described chromothripsis phenomena, in which a chromosome becomes completely shattered and is abnormally rejoined, is one of the examples of a set of cryptic rearrangements that could only be found using this high resolution technology (Kloosterman et al. 2011; Talkowski et al. 2011). Furthermore, this methodology has been applied to characterize structural rearrangements in pre-natal diagnosis with a much higher resolution than currently available diagnosis techniques (Ordulu et al. 2016).
8
1.5. M
ODELS FOR THES
TUDY OFS
TRUCTURALC
HROMOSOMALA
NOMALIESP
HENOTYPICC
ONSEQUENCESAs referred previously, structural chromosomal anomalies most often lead to deleterious phenotypes. However, the relationship between breakpoint regions and the individual’s phenotype is usually not obvious and most of the time it is not feasible to obtain samples from the affected tissues, nor is it possible to follow the affected individuals throughout an extensive amount of time in order to observe the evolution of the phenotype.
In 2003, a 10 year study of an individual with a CCR was published. During this 10 year period, by accompanying the development of structural chromosomal rearrangements analyses techniques, it was possible to continuously improve the defined karyotype and, in that way, better understand the presented phenotype (Houge et al. 2003). However, prolonged studies are most often not feasible.
In order to overcome this difficulty, animal and cellular models have been developed in order to understand the genotype-phenotype association when it comes to structural chromosomal rearrangements.
When it comes to animal models, mice are most often used to model chromosomal rearrangements, especially because of their biological and genetic similarity to humans (Weyden and Bradley 2008). Indeed, several mouse models were created to mimic the phenotypic consequences of a number structural chromosomal disorders (Brault et al. 2006; Weyden and Bradley 2008). However, creating a functional mouse model requires specific working conditions and it is proven to be a long and extremely expensive process.
The second option on modelling structural chromosomal rearrangements is the use of cellular models. However, as in mice modelling, inducing the exact DNA double strand breaks that happen in a structural chromosomal rearrangement, namely in a translocation or an inversion, has been proven to be incredibly difficult. The new CRISPR/Cas9 methodology opened doors on modelling chromosomal DNA. In fact, this technology already allowed for the modelling of a murine embryonic stem cell line that carries a t(5;7) balanced translocation (Jiang et al. 2016).
Induced pluripotent stem cells (iPSCs) provide another possible model for the study of structural chromosomal rearrangements. As it is described below, inducing pluripotency allows for the possibility of having a unique line for each individual specific chromosomal rearrangement.
1.5.1. Induced Pluripotent Stem Cells
The concept of pluripotency is generally applied to a cell that is able to differentiate into cells that originate any of the three germ layers - endoderm, mesoderm and ectoderm. Yet, pluripotency
9 definition requires a cell with this property to be able to originate a whole new organism with all his constituent parts (Han et al. 2010; Robinton and Daley 2012).
This property started to be explored in 1960’s (Robinton and Daley 2012) and the first publication regarding cell reprogramming was only made in 1986, when Lassar and his colleagues reported differentiation of the mouse fibroblast line 10T1/2 through the use of 5-azacitidine. These scientists found that if 10T1/2 line was transfected with DNA from 5-azacitidine induced myoblasts it was possible to observe myogenic conversion (Lassar et al. 1988).
About seven years before the first reprogramming experience being published, native mouse embryonic stem cells were isolated and cultured, beginning the era of pluripotent stem cell study (Robinton and Daley 2012). Later, in the 1990’s, Thomson et al. were able to isolate human embryonic stem cells from human embryos remaining from in vitro fertilization procedures, and found that these cells were in fact able to differentiate in a number of tissue specific cells, confirming its pluripotent capacity.
Due to severe ethical issues on the fact that in order to isolate human embryonic stem cells it is necessary to use human embryonic tissue, scientists quickly searched for new ways to produce stem cells. Thus, in 2006, Takahashi and Yamanaka and Thompson and its group independently found that it was possible to reprogram mouse embryonic and adult fibroblasts by introducing four transcription factors through retroviral transduction (Takahashi and Yamanaka 2006; Han et al. 2010; Robinton and Daley 2012). One year later, in 2007, the same authors were able to reprogram human adult fibroblasts for the first time using the same four reprogramming factors and a set of lentiviral plasmids (Takahashi et al. 2007).
The factors used in Doctor Yamanaka’s laboratory became known as the Yamanaka factors once reprogramming and inducing somatic cells became more and more popular in science. These four factors, octamer-binding transcription factor 4 (OCT3/4), SRY-BOX 2 (SOX2), proto-oncogene c-Myc (c-MYC) and kruppel like factor 4 (KLF4), were able to reprogram completely both mouse adult fibroblasts (Takahashi and Yamanaka 2006) and human adult fibroblasts (Takahashi et al. 2007), introducing the concept of induced pluripotent stem cells (iPSC). Also, Takahashi found that the induced cells expressed high levels of telomerase activity and had the ability to form subcutaneous teratomas when injected into immunodeficient mice. Additionally, the group was able to differentiate these cells into cardiac and neural cells, confirming once again its pluripotent ability (Takahashi et al. 2007).
Since Takahashi first induced pluripotency in adult human fibroblasts with lentiviral vectors, many other starting cells were used and other methodologies were developed.
10 iPSCs have already been developed from cord blood cells, namely CD34+ cells (Ramos-Mejía et al. 2012; Okita et al. 2013), peripheral blood cells , of which it has been mostly used PBMCs (Merling et al. 2016) and CD34+ cells (Mack et al. 2011; Meng et al. 2013), dental pulp cells (Lizier et al. 2013) and even squamous cells present in urine (Zhou et al. 2011; Wang et al. 2013).
1.5.1.1 Methodologies and Applications of iPSC
When it comes to methodologies, iPSC have been developed through the use of integrative vectors, namely retrovirus and lentivirus, but the tendency has been to start using integration-free vectors. Retrovirus and lentivirus may leave a residual viral activity throughout the reprogramming process, interfering with the reprogramming potential of the cells. Also, especially when it comes to retroviral transfection, it is possible to obtain only partially induced cell lines that will always depend on the viral vector to continue the reprogramming process. Lentivirus have some advantage over retrovirus since they offer the possibility of transfecting polycistronic expression cassettes that offer higher efficiencies than retrovirus (Stadtfeld and Hochedlinger 2010). A very present concern when using integrative viral vectors is its association with insertional mutagenesis and the probability of tumor induction if these cells were actually applied to a patient (Zhang 2013).
Lately, the most used vectors for pluripotency induction have been non-integrative vectors, namely transfection with Sendai virus and with episomal plasmids (Stadtfeld and Hochedlinger 2010; Manzini et al. 2015). Sendai virus is a RNA based virus which shows no integration in its host genome. Of the non-integrative vectors available, Sendai virus has been proven to have the highest efficiency when it comes to induce pluripotency, at around 0,01% (Fusaki et al. 2009; Fujie. et al. 2014).
Episomal plasmid vectors are used in combination with electroporation or pore-making reagents (e.g. Lipofectamine) in order to be able to enter the cells. Episomal plasmids are also non-integrative vectors and do not represent, in the face of today’s knowledge, any danger towards the receiver. Even though this vectors have been widely used towards de development of iPSC the reprogramming efficiency rarely surpassed 0,001% (Mack et al. 2011; Dowey et al. 2012; Zhang 2013; Okita et al. 2013; Barrett et al. 2014; Thomas et al. 2015).
The main objectives of iPSC development were both to broaden the knowledge of cell reprogramming mechanisms and to develop a way to have access to all types of individual specific cells in order to proceed to individual specific therapies in regenerative medicine (Yamanaka 2012).
At the moment, cells differentiated from iPSC were already used in the treatment of platelet diseases, spinal cord damages and in brain degenerative diseases such as Parkinson, Alzheimer and schizophrenia (Yamanaka 2012). Also, iPSC generated from CD34+ cells and differentiated into
11 retinal cells are being studied as a way to restore vision to patients with retinitis pigmentosa (Zhu et al. 2016).
Nonetheless, the main application of human iPSC has been in the understanding of human pathogenesis (Han et al. 2010). In fact, iPSC derived from human fibroblasts and human blood cells are being differentiated into several cell types and used to understand and monitor disease progression, which will allow for a greater knowledge on pathogenesis development mechanisms (Han et al. 2010; Robinton and Daley 2012).
12
2. O
BJECTIVES
The main objective of the present study is to identify the molecular alterations responsible for the malformation phenotype present in a subject with an apparently balanced de novo double chromosome translocation t(2;7)(q23;q32),t(5;6)(q23;q26)dn. In this way, it is intended to fulfil the following goals: 1. Enlightenment of the breakpoints localizations at a nucleotide level by amplifying the
breakpoint regions by PCR and Sanger sequencing the amplified fragments;
2. Characterization of the breakpoint regions associated with the translocation regarding the disrupted genes and the genes flanking these regions;
3. Proposition of an association of the interrupted genes and the genes flanking the breakpoint regions with the phenotype presented by the subject.
In addition to the main goal, it is intended to assess the feasibility of establishing an iPSC based disease model for this congenital anomaly using subject’s derived LCL. For this purpose it is expected to:
1. Establish ideal irradiation conditions for inactivating human foreskin fibroblasts;
2. Establish an electroporation methodology that will allow efficient transfection of the episomal vectors to the LCL.
13
3. M
ATERIAL AND
M
ETHODS
3.1. D
ETERMININGC
HROMOSOMEB
REAKPOINTS3.1.1. Sample collection
Blood samples from the proband were collected by venepuncture. Informed consent was obtained by signing the project’s Declaration of Consent, previously approved by the Ethics Committee of National Institute of Health Dr. Ricardo Jorge. The present study was carried out according to the
Declaration of Helsinki from the World Medical Association (Helsinki 1964; Tokyo 1975; Venice
1983; Hong Kong 1989; Somerset West 1996 e Edinburgh 2000).
3.1.2. Establishment and maintenance of lymphoblastoid cell lines
EBV-rich medium was obtained by culturing the B95-8 cell line in Roswell Park Memorial Institute (RPMI) 1640 medium (Gibco, New York, USA), supplemented with 10% fetal bovine serum (FBS) (Gibco, New York, USA), 1% L-glutamine (Gibco, New York, USA) and 1.5% Penicillin/Streptomycin (Gibco, New York, USA) and continuously increasing the cell culture density (Miller 1982; Neitzel 1986).
Cells were maintained in a 37ºC incubator with 5% CO2 and the medium was changed every other day for 12 days, until it turned lemon yellow overnight. The following week, medium was changed daily in order to accelerate cell culture growth. Cell culture density was adjusted to 1x10⁷
cells/mL in 15mL of medium and the culture was incubated for 12 days, until the medium was saturated with viral particles. At the end of the incubation period cell suspension was centrifuged and the viral supernatant was filtered twice through a 0,45μm syringe filter. EBV medium can be aliquoted and stored at 4ºC for at least one year without losing the ability of infecting and immortalizing peripheral blood mononuclear cells (PBMCs).
PBMCs were isolated from peripheral blood preserved in sodium heparin. Peripheral blood was diluted in equal parts with RPMI medium and carefully transferred to either a 12mL or 30mL LeucoSep centrifuge tube (Greiner Bio-One, Kremsmünster, Austria) pre-prepared with one volume of Ficoll-Paque solution (GE Healthcare Life Sciences, Washington, USA).
The tubes were centrifuged at 800xg and the cloudy white interphase containing PBMCs was transferred to a new centrifuge tube with a plastic Pasteur pipette. Two washes with phosphate-buffered saline (PBS) (Gibco, New York, USA) were made and PBMCs were counted with a hemocytometer. About 5x10⁶ cells are needed in order to proceed with the immortalization. The
remaining cells were suspended in freezing medium (90% FBS + 10% DMSO) and frozen in a liquid nitrogen storage.
14
Figure 3.1: PBMCs isolation and mature LCL culture. A Leucosep tube after separation by ficoll density gradient.
B Schematic representation of phase separation in PBMCs isolation. Legend of both A and B 1. Plasma; 2. Interphase
containing PBMCs; 3. Leucosep tube membrane; 4. Erythrocytes; 5. Ficoll layer.
C Mature LCL culture showing the characteristic cell clusters in suspension.
Isolated PBMCs were then exposed to EBV-rich medium and incubated at 37ºC for two hours. This incubation period should end when it is possible to observe small cell clusters. At the end of the incubation period, one volume of RPMI supplemented with 10% FBS, 1% L-glutamin, 1,5% Penicillin/Streptomycin and 1μg/μL of cyclosporine A (Novartis, Basel , Switzerland) was added to the culture.
Cell medium was changed 72 hours after starting the culture. For the following 21 days, 50% of the medium, without cyclosporine A, was changed once a week until the observed cell clusters became larger and presented the typical rosette morphology (Hussain and Mulherkar 2012) (Figure 3.1).
The established culture was then changed to a T25cm2 flask and half of the medium was changed
every other day. Once the flask was confluent the cells were divided at a reason of 1:2 or 1:3, depending on the proliferation rate. After freezing six aliquots of each culture, the cells were counted with a hemocytometer and cell density was maintained for at least seven days in order to proceed to nucleic acid extraction.
3.1.3. DNA extraction from peripheral blood and LCL
DNA extraction from both peripheral blood preserved in EDTA and from LCL was made with the QIAamp DNA Blood Midi Kit (Qiagen, Hilden, Germany). This is a column based kit in which the membrane has high affinity to genomic DNA. The initial sample of either peripheral blood or LCL was treated with Protease K and a lysis buffer. DNA was precipitated with ethanol and transferred to the purification column. Then two washing buffers were used to purify the DNA. Elution was made using low Tris-EDTA buffer.
15
3.1.4. High Resolution Genomic Array
In order to screen for unbalanced genomic alterations, previously isolated genomic DNA from the proband was analysed by high-resolution genomic array, using the CytoScan HD array according to the manufacturer’s instructions (https://tools.thermofisher.com/content/sfs/manuals/cytoscan_assay_ user_manual.pdf, Affymetrix, California, USA). The data retrieved from the array was analysed using ChAS software from Affymetrix (California, USA).
3.1.5. Flow sorting of derivative chromosomes, Genomic amplification and Array painting
Flow sorting of derivative chromosomes, genomic amplification and array painting were performed as previously described (David et al. 2013).
To summarize, metaphase chromosomes of the proband derived LCL were flow sorted by fluorescence-activated cell sorting with a FACS Vantage (Becton–Dickinson, New Jersey, USA), according to standard protocols, by a service provider at CHROMBIOS Molecular Cytogenetics (Raubling, Germany). Genomic amplification was carried out using the REPLI-g Midi Kit (Qiagen, Hilden, Germany) according to the manufacturer’s instructions. Purification of the genomic amplicons was made with the QIAamp Mini Spin Columns (Qiagen, Hilden, Germany) according to manufacturer’s instruction.
Genomic amplicons of isolated derivative chromosomes were analysed by high-resolution oligonucleotide array painting using the Cytogenetics Whole-Genome 2.7 array from Affymetrix (Santa Clara, CA, USA) by a service provider at the Gulbenkian Institute of Sciences (Oeiras, Portugal), according to manufacturer’s instructions. Data retrieved from the arrays was analysed with the Chromosome Analysis Suite (ChAS) software from Affymetrix (Santa Clara, CA, USA).
3.1.6. Large-insert Whole Genome sequencing
Large-insert Whole Genome sequencing was performed at the Centre for Human Genetic Research (Massachusetts General Hospital, Boston), under the cooperation protocol established by the Harvard Medical School-Portugal Program, according to the large-insert jumping libraries protocol (Talkowski et al. 2011).
Bioinformatic analysis of the sequencing raw data was also performed at the Centre for Human Genetic Research (Massachusetts General Hospital, Boston), using the pipeline described by Talkowski et al. (2011). An independent bioinformatic analysis was performed by the Genomic Diseases Research Group (National Institute of Health Doctor Ricardo Jorge, Lisbon), using a Python based pipeline adapted from the one described by Talkowski et al. (2011).
16
3.1.7. Amplification of junction fragments and Sanger sequencing
Refinement of the breakpoint regions determined by both array painting and liWGS was made by sequence-specific polymerase chain reaction (PCR) followed by Sanger sequencing.
Sequence-specific oligonucleotides were designed using either OLIGO software or NCBI Primer-BLAST (https://www.ncbi.nlm.nih.gov/tools/primer-blast/). Generally, oligonucleotides should have around 10 to 25bp in order to avoid both non-specific amplification and the formation of secondary structures. Primer self-complementarity and dimerization ability should be avoided in order to maximize the efficiency of the amplification reaction (Roux 2009). To maximize the efficiency of the reaction, primers were designed with a maximum of 25bp and RepeatMasker tool on UCSC Genome Browser (https://genome.ucsc.edu/; Kent et al. 2002) was used in order to avoid primer annealing on highly repetitive genomic regions flanking the breakpoints. Designed primer sequences and amplification conditions are shown in table 3.1.
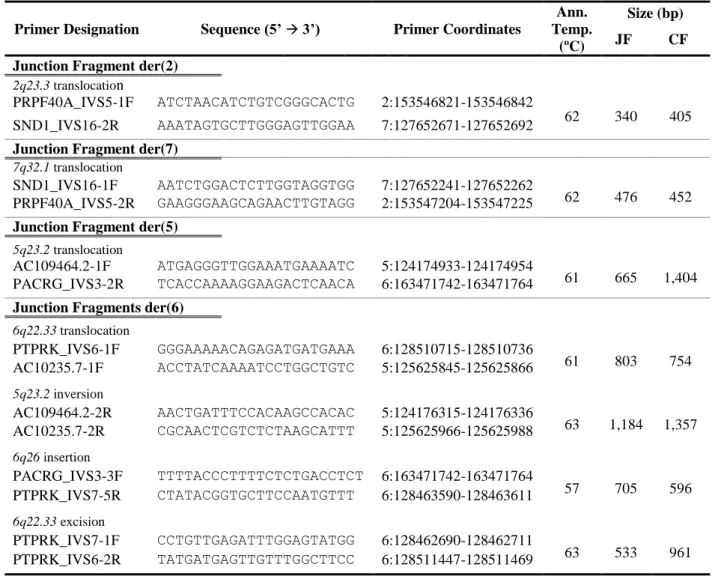
Table 3.1: Sequence of the primers used in the amplification of the junction fragments of the double translocation, respective
primers coordinates, annealing temperatures and size of the amplified fragment (JF – Junction Fragment; CF – Control Fragment) (Reference Human Genome Assembly 37/hg19).
Primer Designation Sequence (5’ 3’) Primer Coordinates
Ann. Temp.
(ºC)
Size (bp)
JF CF
Junction Fragment der(2)
2q23.3 translocation
PRPF40A_IVS5-1F ATCTAACATCTGTCGGGCACTG 2:153546821-153546842
62 340 405
SND1_IVS16-2R AAATAGTGCTTGGGAGTTGGAA 7:127652671-127652692
Junction Fragment der(7)
7q32.1 translocation
SND1_IVS16-1F AATCTGGACTCTTGGTAGGTGG 7:127652241-127652262
62 476 452
PRPF40A_IVS5-2R GAAGGGAAGCAGAACTTGTAGG 2:153547204-153547225
Junction Fragment der(5)
5q23.2 translocation
AC109464.2-1F ATGAGGGTTGGAAATGAAAATC 5:124174933-124174954
61 665 1,404
PACRG_IVS3-2R TCACCAAAAGGAAGACTCAACA 6:163471742-163471764
Junction Fragments der(6)
6q22.33 translocation PTPRK_IVS6-1F GGGAAAAACAGAGATGATGAAA 6:128510715-128510736 61 803 754 AC10235.7-1F ACCTATCAAAATCCTGGCTGTC 5:125625845-125625866 5q23.2 inversion AC109464.2-2R AACTGATTTCCACAAGCCACAC 5:124176315-124176336 63 1,184 1,357 AC10235.7-2R CGCAACTCGTCTCTAAGCATTT 5:125625966-125625988 6q26 insertion PACRG_IVS3-3F TTTTACCCTTTTCTCTGACCTCT 6:163471742-163471764 57 705 596 PTPRK_IVS7-5R CTATACGGTGCTTCCAATGTTT 6:128463590-128463611 6q22.33 excision PTPRK_IVS7-1F CCTGTTGAGATTTGGAGTATGG 6:128462690-128462711 63 533 961 PTPRK_IVS6-2R TATGATGAGTTGTTTGGCTTCC 6:128511447-128511469
17 PCR conditions were optimized using 100ng of genomic DNA isolated from LCL. AmpliTaq DNA Polymerase with buffer I by Applied Biosystems was used. Gradient PCR, with temperatures ranging from 58ºC to 64ºC, was performed in order to find the optimal annealing temperature. When needed, Stratagene's Opti-Prime PCR Optimization Kit, which contains twelve buffers with varying pH and concentrations of MgCl2 and KCl, was also used.
After PCR optimization, breakpoint regions were amplified using genomic DNA extracted from the proband’s blood. The amplified fragments were purified using Amicon Ultra 0,5mL columns (Merck Millipore, Darmstadt, Germany). Low TE buffer was added to the PCR product to make a volume of 500μL and the solution was transferred to the purification column. The column was centrifuged at 14,000xg for seventeen minutes and the eluate was dismissed. Then, the column was filled with 300μL of low TE and was centrifuged at 14,000xg for twelve minutes. Finally, the column was transferred upside down to a new tube and centrifuged for two minutes at 1,000xg in order to collect the purified DNA.
The purified fragments were directly sequenced using the BigDye terminator cycle sequencing kit (Applied Biosystems, California, USA). The annealing temperature of the sequencing reaction was adjusted according to the optimal annealing temperature of the used primer. Reaction products were separated on the Applied Biosystems 377 PRISM automated sequencer, which is based on a four-color fluorescent labeling technology, according to manufacturer’s instructions. Resulting sequences were aligned with the human genome assembly GRCh37/hg19, using reference sequences retrieved from UCSC Genome Browser (https://genome.ucsc.edu/; Kent 2002; Kent et al. 2002) .
Online Mendelian Inheritance in Man (OMIM) database (https://www.omim.org/; Hamosh et al. 2005) and GeneCards (http://www.genecards.org/; Stelzer et al. 2016) database were used as a foundation for retrieving information about the disrupted genes and the genes flanking the breakpoints.
3.2. P
LURIPOTENCYI
NDUCTION3.2.1. Plasmid isolation and characterization
E. coli containing episomal plasmids expressing pluripotency induction factors OCT3/4, Sox2, SV40LT, KLF4, shRNA-P53, L-MYC and LIN28 (Addgene references 27082, 20927, 27077, 27080 and
27078) (Table 2) were cultured overnight in Luria-Bertani (LB) agar medium, at 37ºC. Three well isolated colonies of each culture were picked and inoculated in a 15mL centrifuge tube with 10mL of LB medium and cultured overnight at 37ºC with continuous agitation. 5mL of each of the starter cultures were inoculated in 50mL of LB medium and cultured overnight at 37ºC with continuous agitation.