Inês Azevedo Isidro
Mestre em Engenharia Biológica
Cell functional enviromics:
Applications to
Pichia pastoris
Dissertação para obtenção do Grau de Doutor em
Bioengenharia
Orientador:
Rui Manuel Freitas Oliveira, Professor
Associado, FCT-UNL
Júri:
Presidente: Doutor Pedro Manuel Corrêa Calvente Barahona Arguentes: Doutora Susana de Almeida Mendes Vinga Martins
Doutor Armindo José Alves da Silva Salvador Vogais: Doutor Rui Manuel Freitas Oliveira
Doutora Ana Margarida Palma Teixeira
Cell functional enviromics: Applications to Pichia pastoris
Copyright © Inês Azevedo Isidro, Faculdade de Ciências e Tecnologia, Universidade Nova de Lisboa.
A Faculdade de Ciências e Tecnologia e a Universidade Nova de Lisboa têm o direito, perpétuo e sem limites geográficos, de arquivar e publicar esta dissertação através de exemplares impressos reproduzidos em papel ou de forma digital, ou por qualquer outro meio conhecido ou que venha a ser inventado, e de a divulgar através de repositórios científicos e de admitir a sua cópia e distribuição com objectivos educacionais ou de investigação, não comerciais, desde que seja dado crédito ao autor e editor.
Acknowledgments
I would like to express my gratitude to my supervisor, Prof. Rui Oliveira, without whose vision and support this thesis wouldn’t have been possible. My sincere thanks to Dr. Susana Vinga and Dr. Ana Teixeira, my thesis committee, for their valuable feedback and insight.
This PhD thesis was undertaken with financial support from the Fundação para a Ciência e a Tecnologia through scholarship SFRH/BD/70768/2010. I am grateful to the MIT-Portugal for the opportunity of being part of the Bioengineering Systems Doctoral Program, and to my host institutions FCT-UNL and IBET. I am particularly grateful to Dr. José Silva Lopes for the precious guidance through the necessary formalities.
My special thanks go to my colleagues at MIT-Portugal, SBE and IBET-UP for the cherished companionship and memorable moments.
Abstract
The present PhD thesis develops the cell functional enviromics (CFE) method to investigate the relationship between environment and cellular physiology. CFE may be defined as the envirome-wide cellular function reconstruction through the collection and systems-level analysis of dynamic envirome data. Throughout the thesis, CFE is illustrated by two main applications to cultures of a constitutive P. pastoris X-33 strain expressing a scFv antibody fragment.
The first application addresses the challenge of culture media development. A dataset was built from 26 shake flask experiments, with variations in trace elements concentrations and basal medium dilution based on the standard BSM+PTM1. Protein yield showed high sensitivity to culture medium variations, while biomass was essentially determined by BSM dilution. High scFv yield was associated with high overall metabolic fluxes through central carbon pathways concomitantly with a relative shift of carbon flux from biosynthetic towards energy-generating pathways. CFE identified three cellular functions (growth, energy generation and by-product formation) that together described 98.8% of the variance in observed fluxes. Analyses of how medium factors relate to identified cellular functions showed iron and manganese at concentrations close to PTM1 inhibit overall metabolic activity.
The second application addresses bioreactor operation. Pilot 50 L fed-batch cultivations, followed by 1H-NMR exometabolite profiling, allowed the acquisition of data for 21 environmental factors over
time. CFE identified five major metabolic pathway groups that are frequently activated by the environment. The resulting functional enviromics map may serve as template for future optimization of media composition and feeding strategies for Pichia pastoris.
The present PhD thesis is a step forward towards establishing the foundations of CFE that is still at its infancy. The methods developed herein are a contribution for changing the culture media and process development paradigm towards a holistic and systematic discipline in the future.
Keywords
Resumo
A presente tese de doutoramento desenvolve a envirómica funcional celular (EFC) como método para investigar a relação entre a fisiologia da célula e o seu ambiente. A EFC pode ser definida como a reconstrução da função celular através da aquisição e da análise sistemática de dados dinâmicos do ambiente extracelular, considendo o ambiente como um todo (o enviroma). A metodologia é ilustrada através de duas aplicações principais a culturas de uma estirpe de Pichia pastoris X-33 com expressão constitutiva de um fragmento de anticorpo do tipo scFv.
A primeira aplicação foi para o desenvolvimento de meios de cultura. Experiências em shake flasks
foram sujeitas a 26 variações nas concentrações de micro-minerais e na diluição do meio basal, com base no standard BSM+PTM1. O rendimento de produto mostrou uma grande sensibilidade às variações no meio, enquanto que a biomassa variou apenas com a diluição do meio basal. Um rendimento de produto elevado mostrou-se associado a fluxos superiores em todas as vias metabólicas centrais, em simultâneo com um desvio do fluxo de carbono de vias biosintéticas para vias energéticas. Foram identificadas três funções celulares que em conjunto explicam 98.8% da vâriancia observada nos fluxos. A análise da influência de factores do meio mostrou que o ferro e o manganésio em concentrações próximas do standard inibem a actividade metabólica em geral. A segunda aplicação efectuou-se sobre culturas em bioreactor. Culturas piloto de 50 L foram complementadas com análise metabolómica por 1H-NMR, permitindo a aquisição de dados para 21
factores ambientais ao longo do tempo. Foram identificados cinco grupos de caminhos metabólicos que são frequentemente activados pelo ambiente. O mapa de envirómica funcional resultante pode servir como base para a optimização do meio de cultura e de estratégias de alimentação em culturas de Pichia pastoris.
Esta tese é um passo em frente no sentido estabelecer os fundamentos da EFC. Os métodos aqui desenvolvidos constituem uma contribuição para mudar o actual paradigma do desenvolvimento de meio e de processos de cultura celular para o de uma metodologia sistemática e holística.
Palavras-chave
Table of Contents
List of Figures ... xiii
List of Tables ... xv
List of Abbreviations ... xvii
Chapter 1 Introduction ... 1
1.1 Context and motivation ... 1
1.2 Cell functional enviromics ... 2
1.3 Pichia pastoris expression system ... 3
1.4 Thesis objectives ... 4
1.5 Thesis outline... 4
References ... 5
Chapter 2 State-of-the-art review ... 7
Abstract ... 7
2.1 Introduction ... 7
2.2 Genome-scale networks lay the foundation ... 10
2.2.1 Structure of metabolic networks ... 10
2.2.2 Material balances ... 11
2.2.3 Elementary modes ... 11
2.2.4 Example: elementary modes of P. pastoris ... 13
2.3 Measuring the envirome ... 14
2.4 Elementary mode reduction ... 17
2.4.1 Reduction based on network structural properties ... 17
2.4.2 Reduction based on thermodynamic properties ... 17
2.4.3 Reduction based on flux data ... 18
2.4.4 Example: reduction of the elementary modes by weighting factor minimization ... 19
2.5 Pathway-level process control ... 20
2.5.1 Functional enviromics algorithm ... 21
2.5.2 Example: metabolic process control of P. pastoris cultures ... 22
2.6 Conclusions ... 25
Chapter 3 Prediction of heterologous protein expression by hybrid metabolic flux analysis 31
Abstract ... 31
3.1 Introduction ... 32
3.2 Materials and methods ... 33
3.2.1 DOE of medium composition... 33
3.2.2 Shake flask cultures ... 34
3.2.3 Shake flasks data pre-processing ... 35
3.2.4 Pichia pastoris metabolic network ... 36
3.2.5 Metabolic flux analysis ... 37
3.2.6 Hybrid metabolic flux analysis ... 38
3.3 Results and discussion ... 39
3.3.1 Shake flasks results ... 39
3.3.2 Central carbon fluxes determined by classical MFA ... 42
3.3.3 Heterologous protein yield predicted by hybrid MFA ... 45
3.4 Conclusions ... 48
References ... 49
Additional files ... 51
Chapter 4 Analysis of culture media screening data by projection to latent pathways ... 53
Abstract ... 53
4.1 Introduction ... 54
4.2 Materials and methods ... 55
4.2.1 Pichia pastoris culture media screening data... 55
4.2.2 Pichia pastoris metabolic elementary flux modes ... 56
4.2.3 Projection to latent pathways ... 57
4.3 Results and discussion ... 58
4.3.1 Pichia pastoris elementary flux modes ... 58
4.3.2 Projection to latent pathways ... 58
4.3.3 Consistency of EFM selection ... 62
4.3.4 Effect of medium factors on metabolism ... 62
4.3.5 Comparison to PLS ... 64
4.4 Conclusions ... 66
References ... 66
Additional files ... 67
Chapter 5 Cell functional enviromics of Pichia pastoris cells ... 69
Abstract ... 69
5.1 Introduction ... 69
5.2 Materials and methods ... 72
5.2.1 Strain and cultivation conditions ... 72
5.2.3 Determination and reduction of elementary flux modes ... 73
5.2.4 Projection to latent pathways ... 74
5.3 Results and discussion ... 75
5.3.1 Reactor experiments ... 75
5.3.2 Elementary flux modes ... 77
5.3.3 Projection to latent pathways ... 78
5.3.4 Analysis of selected EFMs ... 80
5.3.5 Assessment of envirome-EFM relationship... 82
5.4 Conclusions ... 83
References ... 84
Additional files ... 85
Chapter 6 Conclusions ... 87
6.1 General discussion ... 87
6.2 Future work ... 89
References ... 90
Appendix ... 91
Additional file 3.1 –Pichia pastoris network model for central carbon metabolism ... 93
Additional file 3.2 – Metabolic flux distribution ... 99
Additional file 4.1 – Culture media screening data ... 105
Additional file 4.2 –Pichia pastoris elementary modes network ... 109
Additional file 5.1 –Pichia pastoris core metabolic network ... 117
Additional file 5.2 – Sampling data ... 123
List of Figures
Figure 2.1 – Fluxome solution space of a metabolic network in steady state ... 12
Figure 2.2 – Bounded convex hull in the space of yields ... 14
Figure 2.3 –1H-NMR spectrum for a P. pastoris supernatant sample ... 16
Figure 2.4 – Functional genomics versus functional enviromics ... 21
Figure 2.5 – Functional enviromics of a P. pastoris X-33 strain expressing a scFv antibody ... 24
Figure 2.6 – Simulation of biomass and product dynamic profiles ... 25
Figure 3.1 – Hybrid metabolic flux analysis framework ... 38
Figure 3.2 – Biomass and product yields for shake flask experiments ... 40
Figure 3.3 – Model fitting and metabolic flux distribution for shake flask experiment 1 ... 41
Figure 3.4 –1H-NMR spectra of culture broth supernatant shows presence of ethanol ... 43
Figure 3.5 – Variability in MFD for different medium compositions ... 44
Figure 3.6 – Predictive power of hybrid MFA ... 46
Figure 3.7 – Bootstrapping of predictor weights for the first latent variable ... 47
Figure 4.1 – PLP regression results ... 59
Figure 4.2 – Explained variance by reaction for the PLP model ... 61
Figure 4.3 – R-biplot for the PLP model ... 61
Figure 4.4 – Bootstrapping of medium factors weight on selected elementary flux modes ... 63
Figure 4.5 – Variable importance on projection for the PLP model with 3 EFMs... 64
Figure 4.6 – PLS regression results ... 65
Figure 5.1 – Functional genomics versus functional enviromics ... 70
Figure 5.2 – Culture profiles over time ... 75
Figure 5.3 – Profiles for exometabolites over time as determined by 1H-NMR ... 76
Figure 5.4 – Clustering of the EFM footprint ... 78
Figure 5.5 – PLP regression and bootstrapping ... 80
Figure 5.6 – EFM activation profiles over time ... 81
Figure 5.7 – Variable importance in projection (VIP) ... 82
List of Tables
Table 2.1 – Different levels of metabolome analysis ... 15
Table 2.2 – Elementary mode reduction results for three distinct culture time points ... 19
Table 3.1 – Design factors for medium screening ... 33
Table 3.2 – Design of experiments for medium screening ... 34
Table 3.3 – Model-adjusted fluxes for shake flask experiments ... 42
Table 3.4 – Carbon flux though main pathways normalized by carbon intake ... 45
Table 3.5 – PLS regression to predict product yield (Y) from selected fluxes (X)... 46
Table 4.1 – Medium composition in dissociated salts ... 56
Table 4.2 – PLP regression results ... 59
Table 4.3 – Description of frequently selected EFMs ... 60
Table 4.4 – PLS regression results ... 65
Table 5.1 – EFM footprinting and clustering... 77
List of Abbreviations
Ala alanine
Arg arginine
Asp aspartate
BSM basal salts media
CFE cell functional enviromics DCW dry cell weight
EFM elementary flux mode (or elementary mode) EM elementary mode (or elementary flux mode) EMP Embden-Meyerhof-Parnas pathway
Glu glutamate
GlyOH glycerol
GPC glycerophosphocholine LV latent variable
Lys lysine
MFA metabolic flux analysis MFD metabolic flux distribution
nRMSE normalized root mean squared error OD optical density
PCA principal component analysis PLP projection to latent pathways
PLS partial least squares regression (or projection to latent structures) pO2 dissolved oxygen (as % of saturation)
PPP pentose phosphate pathway
Pro proline
PTM1 Pichia trace minerals 1 RMSE root mean squared error RQ respiratory quotient
Chapter 1
Introduction
1.1 Context and motivation
Competition in the production of public domain biotherapeutics will set forth the need for global process optimization to increase titers, productivity and to control product quality. For that purpose, the integration of classical process optimization and control schemes with emerging systems biology methodologies is a rational step forward to improve the current standard in the industrial biotechnology.
Bioprocess optimization and control currently rely on empirical models that describe the bioreactor at the macroscopic scale. This approach neglects the intricate details of the cell factory and is thus limited in its potential applications. One example is the control of product quality wherein molecular-level properties come into play. For such problems, models that integrate macro-, micro- and molecular-level process parameters are essential for a successful optimization and/or control outcome.
It should be also recognized that in any cell culture process there is a large number of environmental variables that shape cellular physiology. One important implication is that the design space for process development, namely culture medium optimization and process control, is potentially very large. Empirical methods are not well suited to handle high-dimensional design spaces unless a substantial level of reductionism is applied, that however may result in suboptimal performance. Both industry and academia are now acknowledging the need to use state-of-the-art, systems-level genomics, proteomics and metabolomics tools for bioprocess optimization and control [1, 2].
metabolome, rendering its analysis a valuable tool for the detection of metabolic adaptations [3, 4]. Additionally, the metabolites excreted by the cell to the culture medium are more readily available for analysis and quantification. Kell and co-workers [5] focused on what they called the “exometabolome”, defending it provides a “metabolic footprint” of cellular metabolism, by reflecting which pathways are active within the cellular compartment at any given moment. Metabolic profiling methods are relatively fast, cheap and high-throughput, and, therefore, are eligible for on-line monitoring. The detection of extracellular metabolites other than the desired end-product shows which non-productive pathways are active and if possible should be down-regulated through appropriate control.
1.2 Cell functional enviromics
Functional enviromics is an emerging systems biology methodology that aims at discovering the function of the entirety of environmental factors – the envirome – on cellular regulation. It is the “environmental analog” of functional genomics. Functional genomics is now a well-established discipline that aims at unravelling gene functions and gene-gene interactions and how these set phenotypic traits. The concept of functional enviromics has been first set forth as a counterpart to functional genomics in tackling mental disorders such as schizophrenia [6]. Only very recently functional enviromics has been addressed in the context of cell physiology [7].
While the genome sets the phenotypic space of a cell, particular trajectories within it are primarily driven by the environment. Such gene-environment interactions are still poorly understood [8]. Cell functional enviromics may contribute to fill that gap. Cell functional enviromics may be defined as the envirome-wide cellular function reconstruction through the collection and systems-level analysis of dynamic envirome data. The key steps for the realization of a functional enviromics study are:
(i) setting the universe of cellular functions and envirome components, (ii) collecting informative envirome data over time, and
(iii) systems-level analysis of dynamic envirome data to find relationships between environmental variables and cellular functions.
1.3
Pichia pastoris
expression system
The yeast Pichia pastoris was the chosen model organism to illustrate the application of cell functional enviromics in this thesis. More specifically, a P. pastoris X-33 strain constitutively expressing a scFv-type antibody under the pGAP promoter. A single-chain variable fragment (scFv), which for simplicity is usually described as an antibody fragment, is actually a fusion protein of the variable regions of heavy (VH) and light (VL) chains of immunoglobulins, joined together by a
flexible linker peptide. Single-chain variable fragments and other recombinant antibody fragments are emerging as a more economical and customizable alternative to monoclonal antibodies (mAbs) for a wide range of diagnostic and therapeutic applications [9].
The yeast Pichia pastoris is now established in the academia and in the industry as an expression system of choice. The key aspects that explain the success of P. pastoris have been recently reviewed in Ahmad et al. [10]. Among those key aspects is the fast and inexpensive growth that reaches extremely high cell densities on inexpensive, chemically defined media [11, 12]. It can produce foreign proteins at very high levels both intracellularly or secreted to the medium [13] and is able to carry out post-translational modifications. Unlike other yeasts, it shows a strong preference for respiratory growth and a limited tendency for fermentation [14]. Techniques for genetic manipulation are simple and similar to Saccharomyces cerevisiae, with commercial expression kits available for both intracellular and secretory expression. Furthermore, the P. pastoris genome sequence and annotation is publically available [15] and curated genome-scale metabolic models can be found in the literature [16, 17].
The Pichia platform currently has over 70 products on the market or in late stage of development [18]. Applications in the industry range from treatment agents in chemical processes (e.g. phospholipase C, nitrate reductase), to enzymes for the food and feed industries [19] (e.g. trypsin, phytase), and research reagents (e.g. collagen, cystatin C). In addition, several biopharmaceutical products have been approved by regulatory agencies for human use. These include vaccines (Shanvac™ from Shanta/Sanofi), two therapeutic antibody fragments (Nanobodies® ALX00171 and
ALX0061 from Ablynx) and several therapeutic proteins (e.g. Kabitor® from Dyax, Insugen® from
Biocon, Shanferon™ from Shanta/Sanofi, Ocriplasmin from ThromboGenics, and heparin-binding EGF-like growth factor from Trillium).
Despite the growing importance of the Pichia pastoris expression system as an industrial workhorse, the literature is almost absent in systematic studies on how environmental factors affect cellular physiology.
The present PhD thesis focuses on the topic of functional enviromics applied to Pichia pastoris
1.4 Thesis objectives
The central goal of this PhD dissertation was the development of analytical methodologies and computational algorithms for pathway-level optimization of cell culture processes based on functional enviromics.
In order to achieve this, the following intermediate objectives were devised:
Gather experimental data of recombinant Pichia pastoris cultures expressing a scFv antibody fragment. Explore the cell’s physiological response to variations in bioreactor operating parameters and culture medium composition while optimizing sampling and analytical techniques for envirome characterization.
Adapt and expand existent functional enviromics tools to process high-throughput envirome data. Implement algorithms in a robust systems biology framework suitable for large-scale process monitoring and control.
Develop Pichia pastoris functional enviromics models using pathway, sequence and annotation data available in public databases, integrated with the algorithms developed in the previous step.
Apply the developed functional enviromics models and tools to collected experimental data in order to generate knowledge on how envirome factors correlate and influence cell physiology. This knowledge can serve as basis for the design of optimized culture media formulations and operational strategies.
1.5 Thesis outline
This thesis is structured into six chapters. The current section, Chapter 1, is a short introduction to the thesis topic, scientific context and research objectives.
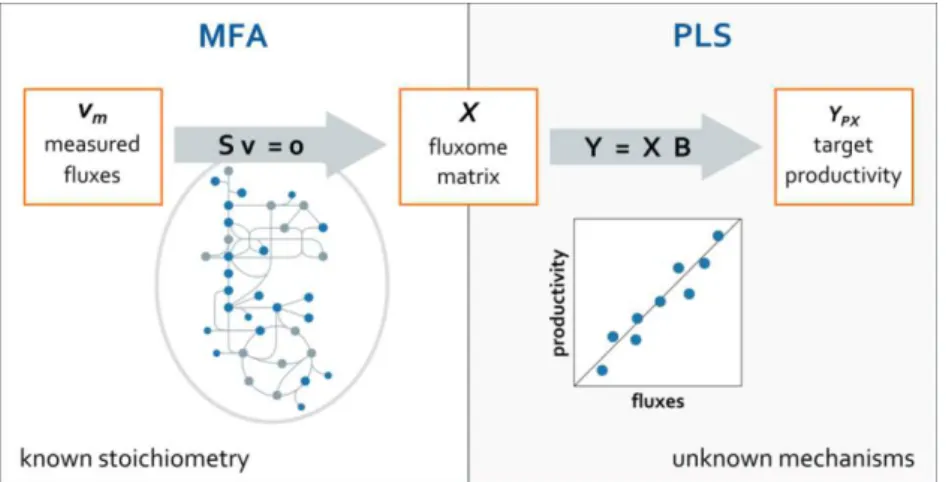
Chapter 2 is an extensive overview of the state-of-the-art based on a review manuscript previously published as a book chapter. It covers current analytical methodologies to measure the envirome, describes how elementary modes arise from metabolic networks, introduces a mathematical basis for cell functional enviromics and characterizes alternative approaches for the selection of elementary modes.
measured fluxes – with partial least squares regression (PLS) – to establish a link between central carbon fluxes and product yield.
Chapter 4 combines the same media screening data with projection to latent pathways (PLP) – the core functional enviromics algorithm – to assess how culture medium components up-regulate or down-regulate key metabolic pathways. The main novelty is the application of PLP in a way that allows inference of cause-effect relationships for culture medium components. The PLP method is evaluated for consistency on elementary mode selection and compared to the standard PLS regression.
In Chapter 5, cell functional enviromics is applied to Pichia pastoris data collected over time in a pilot-scale 50 L bioreactor, complemented with 1H-NMR exometabolite profiling. PLP is used to
identify key metabolic pathways with high correlation to the envirome and assess how activation of specific pathways varies over time. The resulting functional enviromics map (FEM) identifies links between envirome factors and cellular operation and may serve as basis to optimize media composition and feeding strategies for Pichia pastoris cultivations.
Finally, Chapter 6 summarizes the main findings and presents an integrated discussion with focus on impact and perspectives for future work.
References
1. Otero JM, Nielsen J (2010) Industrial Systems Biology. Biotechnol Bioeng 105:439–460
2. Teixeira AP, Carinhas N, Dias JML, et al. (2007) Hybrid semi-parametric mathematical systems: Bridging the gap between systems biology and process engineering. J Biotechnol 132:418–425
3. Raamsdonk LM, Teusink B, Broadhurst D, et al. (2001) A functional genomics strategy that uses metabolome data to reveal the phenotype of silent mutations. Nat Biotechnol 19:45–50
4. Urbanczyk-Wochniak E, Luedemann A, Kopka J, et al. (2003) Parallel analysis of transcript and metabolic profiles: a new approach in systems biology. EMBO Rep 4:989–993
5. Kell DB, Brown M, Davey HM, et al. (2005) Metabolic footprinting and systems biology: The medium is the message. Nat Rev Microbiol 3:557–565
6. Van Os J, Rutten BP, Poulton R (2008) Gene-environment interactions in schizophrenia: review of epidemiological findings and future directions. Schizophr Bull 34:1066–82
7. Teixeira AP, Dias JML, Carinhas N, et al. (2011) Cell functional enviromics: Unravelling the function of environmental factors. BMC Syst Biol 5:92
8. Smith EN, Kruglyak L (2008) Gene-environment interaction in yeast gene expression. PLoS Biol 6:e83 9. Holliger P, Hudson PJ (2005) Engineered antibody fragments and the rise of single domains. Nat
Biotechnol 23:1126–1136
10. Ahmad M, Hirz M, Pichler H, Schwab H (2014) Protein expression in Pichia pastoris: recent achievements and perspectives for heterologous protein production. Appl Microbiol Biotechnol 98:5301–17
12. Heyland J, Fu J, Blank LM, Schmid A (2010) Quantitative physiology of Pichia pastoris during glucose-limited high-cell density fed-batch cultivation for recombinant protein production. Biotechnol Bioeng 107:357–68
13. Cregg JM, Vedvick TS, Raschke WC (1993) Recent Advances in the Expression of Foreign Genes in
Pichia pastoris. Nat Biotechnol 11:905–910
14. Hagman A, Säll T, Piškur J (2014) Analysis of the yeast short-term Crabtree effect and its origin. FEBS J 281:4805–14
15. Mattanovich D, Callewaert N, Rouze P, et al. (2009) Open access to sequence: Browsing the Pichia pastoris genome. Microb Cell Fact 8:53
16. Chung BK, Selvarasu S, Andrea C, et al. (2010) Genome-scale metabolic reconstruction and in silico analysis of methylotrophic yeast Pichia pastoris for strain improvement. Microb Cell Fact 9:50
17. Sohn SB, Graf AB, Kim TY, et al. (2010) Genome-scale metabolic model of methylotrophic yeast Pichia pastoris and its use for in silico analysis of heterologous protein production. Biotechnol J 5:705–15 18. Research Corporation Technologies (2015) Pichia produced products on the market.
http://www.pichia.com/science-center/commercialized-products/.
Chapter 2
State-of-the-art review
1Abstract
In this chapter we explore the basic tools for the design of bioprocess monitoring, optimization, and control algorithms that incorporate a priori knowledge of metabolic networks. The main advantage is that this ultimately enables the targeting of intracellular control variables such as metabolic reactions or pathways directly linked with productivity and product quality. We analyze in particular design methods that target elementary modes of metabolic networks. The topics covered include the analysis of the structure of metabolic networks, computation and reduction of elementary modes, measurement methods for the envirome, envirome-guided metabolic reconstruction, and macroscopic dynamic modeling and control. These topics are illustrated with applications to a cultivation process of a recombinant Pichia pastoris X-33 strain expressing a single-chain variable fragment (scFv) antibody.
Keywords
bioprocess control · dynamic modeling · elementary modes · envirome measurement · metabolic networks
2.1 Introduction
Historically, process control for cell culture has relied on empirical models with cells treated as ‘‘black boxes’’. Purely descriptive empirical models based on measurements of the concentrations of biomass and normally only a few extracellular compounds, which completely neglect the
1 Chapter published as: Isidro IA, Ferreira AR, Clemente JJ, Cunha AE, Dias JML and Oliveira R (2013)
structure of the intracellular compartment, have been widely used for bioprocess optimization and control [1]. With the advances in systems biology, molecular biology data and mechanistic models for microorganisms of industrial interest are becoming available. Systems biology is expected to have a great impact on biotechnological processes including process control, enough to justify the coining of the term ‘‘industrial systems biology’’ [2].
Cell factories consist of complex, intricate networks of a large number of genes, proteins, and metabolites. At a higher hierarchical level, cells are part of larger networks comprising the environment as well as other cells or organisms [3]. As we learn more from genome-scale network reconstruction projects, it becomes apparent that the number of molecular interactions between the extracellular and intracellular environments is very large. Borenstein et al. [4] estimated that 8–11% of the metabolites in the metabolic networks of prokaryotic species originate from the environment. Indeed, cells take a large number of compounds from the environment to carry out their metabolic activity. These include inorganic ions and a large array of low molecular weight organic molecules such as sugars, vitamins, fatty acids and amino acids. As a consequence, cells leave a complex and informative metabolic footprint in the environment, which in yeast cultures may account for more than 100 metabolites [5]. Moreover, experiments with single-gene deletion mutants have shown that the metabolic footprint was sufficiently informative to classify the different mutants [6]. Larger macromolecules present in the environment, such as proteins, carbohydrates, and lipids, also play an important role in signal transduction pathways. Both the low and high molecular weight extracellular molecules form a natural extension of the intracellular biochemical networks of considerable complexity. Understanding the molecular interplay between extra- and intracellular components is essential to engineer the environment of cells more efficiently, namely for optimization of culture medium composition and design of process monitoring and control strategies that target intracellular control variables.
The main difficulty in macroscopic dynamic modeling based on elementary modes lies in the definition of the elementary mode weighting factors. As discussed later, any particular set of metabolic fluxes, or fluxome (i.e., phenotypic state), can be represented as a weighted sum of elementary modes. The magnitude of a weighting factor thus quantifies the contribution of the particular elementary mode to the overall phenotypic state. In Provost and Bastin [9], the elementary mode weighting factors were modeled by Michaelis-Menten kinetic laws as functions of extracellular concentrations. The analogy between Michaelis-Menten kinetics and elementary mode weighting factors is, however, not founded on mechanistic principles. Moreover, this approach gives rise to very complex nonlinear systems, which are difficult to identify. In Teixeira et al. [11] we developed hybrid macroscopic models structured by elementary flux modes for baby hamster kidney (BHK) cells. Instead of Michaelis-Menten kinetic laws, empirical modeling, namely artificial neural networks, was employed to model the elementary mode weighting factors as functions of extracellular physicochemical variables.
Another difficulty in macroscopic dynamic modeling based on elementary modes lies in the typically very high number of elementary modes. Indeed, the number of elementary modes increases exponentially with the size and complexity of the network [12]. However, most of these elementary modes are not active at preset environmental conditions [13]. It is thus not necessary to use the full set of elementary modes for a specific application. Of particular interest is the subset of elementary modes describing a collection of measured phenotypic data. The importance of this lies in the fact that the internal fluxes are not independently distributed but strictly constrained by external fluxes through the pathways at steady-state [14]. Therefore, the challenge is how to select the subset of elementary modes that describe a physiological state of interest. Effective reduction of elementary modes is mandatory to reduce the complexity of the final model and facilitate the design of process control.
2.2 Genome-scale networks lay the foundation
In January 2012, the genome online database (GOLD) recorded 3 065 completed bacterial genome sequences and 7 755 more sequencing projects underway [15]. Furthermore, the metagenomes (genome of mixed cultures) of 340 sample communities were also recorded in the same database, with 9% of them from engineered mixed microbial systems (wastewater, solid waste, or bioremediation) [16]. Genome-scale networks are constructed on the basis of the complete genome annotation. Identified genes may be associated with metabolic enzymes, membrane transporters, signal transduction, or regulatory control. Combining genome annotation with basic biochemical information currently available in several databases (e.g., KEGG [17] and BioCyc [18] databases), it is possible to reconstruct the majority of the metabolic reactions network and also the associated exometabolome [19]. At least 62 genome-scale metabolic models have been reconstructed for single organisms, representing 37 genera [20, 21], including organisms of industrial relevance such as Escherichia coli [22], Saccharomyces cerevisiae [23],
Pichia pastoris [24, 25], and many others. Metabolic networks convey critical information about the interaction between the extra and intracellular phases, which is essential for design of advanced process control strategies that target intracellular control variables.
2.2.1 Structure of metabolic networks
extracellular metabolites can be manipulated in order to control intracellular processes linked to product yield and quality.
2.2.2 Material balances
The list of metabolic reactions identified in a genome-scale reconstruction project can be translated into a stoichiometric matrix, A, with dim(A) = m× q, where m is the number of intracellular metabolites and q is the number of metabolic reactions. The material balances over the intracellular metabolites take the following general form:
𝑑𝐜𝑖
𝑑𝑡 = 𝐀 × 𝐯 − 𝜇 𝐜𝑖 (2.1)
where ciis the vector of intracellular concentrations with dim(ci) =m, vis the vector of intracellular
fluxes, and µis the specific growth rate. Under the pseudo-steady-state hypothesis, intracellular metabolites do not accumulate and the dilution term is much smaller than the net turnover of metabolites, thus Eq. (2.1) simplifies to
{ 𝟎 = 𝐀 × 𝐯𝐯
𝑗 ≥ 0 (2.2)
The inequality constraints in Eq. (2.2) refer to the subset jof irreversible reactions with nonnegative flux values. Equation (2.2) expresses an undetermined system of algebraic equations because q≫m, and thus it has no unique solution. The universe of solutions of Eq. (2.2) forms a polyhedral cone in the fluxome solution space whose edges correspond to independent elementary modes (elementary modes are discussed in more detail in the next section).
Equation (2.2) applies only to balanced intracellular metabolites. For extracellular metabolites the net accumulation is nonzero and the following equation applies:
{ 𝐛 = 𝐀′ × 𝐯𝐯
𝑗 ≥ 0 (2.3)
with b the vector of fluxes of extracellular metabolites across the cellular membrane and A’ the stoichiometric matrix of such extracellular metabolites.
2.2.3 Elementary modes
mode to function [10]. The universe of elementary modes of a given metabolic network defines the full set of non-decomposable steady-state flux distributions that the network can support. Any particular steady-state flux distribution can be expressed as a nonnegative linear combination of elementary modes.
As such, the phenotype of a cell, as defined by its fluxome, v, can be expressed as a weighted sum of the contribution of each elementary mode:
𝐯 = 𝜆1𝐞1+ 𝜆2𝐞2+ ⋯ + 𝜆𝑘𝐞𝑘 = ∑ 𝜆𝑖𝐞𝑖 𝑘
𝑖=1
(2.4)
where ei is an elementary mode vector with dim(ei) =q, λi is the weighting factor of ei, k is the
number of elementary modes, and dim(v) = dim(ei) =q is the number of metabolic reactions on the metabolic network. Geometrically the elementary modes correspond to the edges of the polyhedral cone in the fluxome solution space (Figure 2.1).
Figure 2.1 – Fluxome solution space of a metabolic network in steady state obeying to the material balances of Eq. (2.2). The solution space has the shape of a polyhedral cone whose edges are the elementary
modes.
The elementary mode matrix, EM, is obtained by concatenating all the eivectors into a q× kmatrix:
𝐄𝐌 = [𝐞1 𝐞2… 𝐞𝑘] (2.5)
Multiplying the EM matrix by the stoichiometric matrix of the extracellular metabolites, A’, one obtains the elementary mode stoichiometric matrix:
The dimension of AEM is m’× k, where m’ is the number of extracellular metabolites. Each column of
AEM contains the stoichiometry of extracellular metabolites for the particular elementary mode.
This matrix holds critical information for process control, since it defines the theoretical metabolic footprint of each elementary biochemical state of the cell. The specific reaction rates of extracellular compounds are given by
𝐛 = 𝐀𝐄𝐌× 𝜆 (2.7)
As shown later, these rates can be used to formulate macroscopic dynamic models of extracellular compounds.
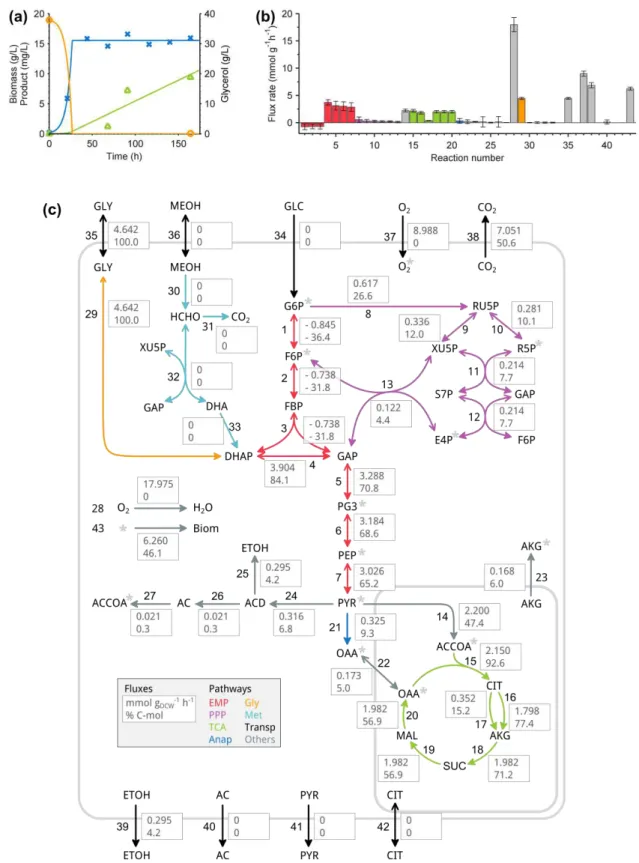
2.2.4 Example: elementary modes of
P. pastoris
To illustrate the elementary mode concept, we have built a P. pastoris metabolic network based on the KEGG database and papers by Chung et al. [24] and Çelik et al. [30]. The genes associated with each reaction are in most cases known and can be found in [24]. The network included the following processes/pathways: uptake reactions (glycerol, sulfate, phosphate, and ammonia), glycolysis/gluconeogenesis, pentose phosphate pathway, tricarboxylic acid cycle (TCA), biosynthesis of amino acids, biosynthesis of macromolecular components of biomass (nucleotides, lipids, carbohydrates, and proteins), biosynthesis of a single-chain variable fragment (scFv), interconversion of folate compounds, oxidative phosphorylation, and energy interconversions. The metabolic network was further simplified by lumping together in single reactions the consecutive reactions in the pathways for synthesis and degradation of biomass and product precursors. The stoichiometry of ATP, nicotinamide adenine dinucleotide (NADH), nicotinamide adenine dinucleotide phosphate (NADPH), flavin adenine dinucleotide (FADH2), and H2O were also
accounted for in the metabolic reactions in order to close the balance of oxygen, hydrogen, and phosphorus. It was assumed a fixed P/O ratio of 2 mol-ATP/mol-NAD(P)Hand of 1 mol-ATP/mol-FADH2. The resulting metabolic network for glycerol as carbon source has 104 reactions (thus
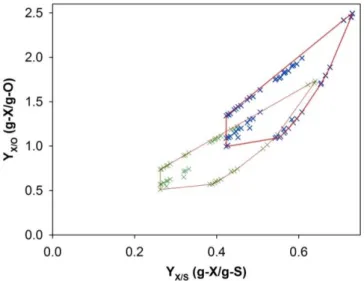
104 fluxes), 90 intracellular metabolites, and 16 extracellular metabolites (17% of all metabolites). The open source bioinformatics software METATOOL 5.0 [31] was used to compute the elementary modes for the P. pastoris metabolic network. The total number of elementary modes was 4 119. Figure 2.2 shows a representation of the yields of biomass and product on glycerol and oxygen obtained through stoichiometric analysis of elementary modes.
and oxygen are those that include the metabolic reactions involved in the secretion of organic acids from TCA, namely succinate for biomass growth and citrate for scFv synthesis. On the other hand, the elementary modes with the highest yields on glycerol and oxygen involve the metabolic reaction of the pentose phosphate pathway.
Figure 2.2 – Bounded convex hull in the space of yields of biomass (blue crosses) and product (green crosses) on glycerol and oxygen.
2.3 Measuring the envirome
Table 2.1 – Different levels of metabolome analysis
Metabolite target analysis Identification and quantification focused on one or a few metabolites related to a specific pathway [34]
Metabolite profiling (or metabolic profiling)
Identification and quantification of a selected group of metabolites, e.g., metabolites from a specific metabolic pathway or a specific compound class, such as amino acids, organic acids, or carbohydrates [34] Metabolomics Identification and quantification of all metabolites in a biological system.
Sample preparation method must retain all metabolites. Analytical technique must be suited to measure metabolites over a broad range of concentrations and needs high discriminatory power
Metabonomics Analysis of tissues and/or biological fluids to detect changes caused by disease or therapeutic treatments [35]
Metabolic fingerprinting Fast, high-throughput analysis of intracellular metabolites to provide a characterization of the cells for sample classification. Analytical technique must allow sample discrimination, but it is not required to identify and quantify all the metabolites individually [34]
Metabolic footprinting Fast, high-throughput analysis of the surrounding medium to characterize the cells based on their exometabolome. As with fingerprinting, it is not necessary to identify and quantify all the metabolites individually to allow sample discrimination [6]
Measuring the endometabolome (metabolic fingerprinting) is not as straightforward as measuring the exometabolome (metabolic footprinting) given the complex sample preparation protocols and the higher number of intracellular metabolites. Endometabolome analysis requires separation of cells from extracellular medium followed by cell breakage. In addition, the rapid turnover inherent to intracellular metabolites, which can be under one second for microbial systems [36], results in the need for a rapid quenching step to halt metabolism. In contrast, the turnover rates of exometabolites are much lower given the low volume ratio between the intracellular and extracellular phases.
Current analytical techniques for exo- or endometabolome analysis include nuclear magnetic resonance (NMR) spectrometry [37, 38] and mass spectrometry (MS) [39]. Either of them can be coupled to separation methods for higher resolution. These hyphenated methods include, for instance, capillary electrophoresis coupled to mass spectrometry (CE-MS) [40], gas chromatography mass spectrometry (GC-MS) [41], and liquid chromatography coupled to nuclear magnetic resonance spectrometry (LC-NMR) [42]. For a detailed review on the application of such methods to metabolomics refer to [5, 43, 44].
Figure 2.3 –1H-NMR spectrum for a P. pastoris supernatant sample. The black line is the acquired
spectrum, whereas the red line is the estimated sum of the individual spectra for identified metabolites. Looking more closely into specific regions of the spectrum it is possible to identify key metabolites.
Knowledge of the metabolome is useful since it is very closely related to cellular phenotype. Because changes upstream accumulate downstream, changes in the transcriptome and proteome are found amplified in the metabolome. As a result, the metabolome allows the detection of changes that have a very small effect on metabolic fluxes [37, 46]. Metabolic fluxes, which can be regarded as the phenotype of a cell, are regulated not only at transcription and translation levels, but also by means of posttranslational events, and as such the metabolome is considered closer to the phenotype than the transcriptome or proteome [34, 47].
2.4 Elementary mode reduction
The number of elementary modes increases geometrically with the size of the network. The typically very high number of elementary modes denotes the innate adaptability and robustness of biological networks. As a consequence, the computation of elementary modes suffers from combinatorial explosion, particular for genome-scale networks. The central carbon metabolism of a genome-scale reconstructed E. coli metabolic network has approximately 26 million EMs [49]. It is essential to reduce such large numbers of elementary modes according to some criterion in order to decrease the computational power requirements. Indeed, not all calculated elementary modes are thermodynamically feasible or even physiologically reachable [50]. Several methods have been developed to reduce the number of elementary modes, founded on different principles. In what follows we review some of them.
2.4.1 Reduction based on network structural properties
Elementary modes can be reduced on the basis of structural information of the metabolic network without the use of experimental data. Figueiredo et al. [51] presented a method based on the ranking of elementary modes in increasing order of number of reactions. This approach enables identification of the K shortest elementary modes, which are in principle energetically more efficient. Song and Ramkrishna [14] proposed a reduction algorithm based on the effect of elementary modes on the convex hull volume. The principle consists in removing the elementary modes with negligible contribution to the convex hull volume of the original network. This allowed a priori reduction from the initial 369 to a final set of 35 elementary modes for a yeast metabolic network fermenting both glucose and xylose without using experimental data.
2.4.2 Reduction based on thermodynamic properties
2.4.3 Reduction based on flux data
Several methods have been proposed to eliminate elementary modes on the basis of measured flux data. The equation that applies here is Eq. (2.4); however, the number of elementary mode weighting factors is in general much larger than the number of metabolic fluxes, thus the system is largely undetermined. Palsson and co-workers [54, 55] suggested linear optimization methods to determine how extreme pathways (the systemically independent subset of elementary modes) contribute to a given (measured) steady-state flux distribution. There is a range of possible nonnegative weighting values associated to extreme pathways that produce a given steady-state flux distribution. This range was calculated by maximizing and minimizing the extreme pathway weighting factors, resulting in the so-called α-spectrum. The allowable ranges for the values of λi
were computed as:
max 𝜆𝑖
subject to Eq. (2.4) , 𝑖 = 1, … , 𝑘 , 0 ≤ 𝜆𝑖≤ 1
min 𝜆𝑖
subject to Eq. (2.4) , 𝑖 = 1, … , 𝑘 , 0 ≤ 𝜆𝑖≤ 1
(2.8)
Wang et al. [56] presented a method to calculate the elementary mode coefficients for a large set of elementary modes by devising a quadratic program to explore the possibility and performance of using a subset of the elementary modes to reconstruct flux distributions. Alternatively, a framework based on elementary mode analysis and the convex properties of elementary modes was developed to calculate flux regulation coefficients (FRC) corresponding to an appropriate fractional operation of this mode within the complete set of elementary modes [57].
Schwartz and Kanehisa [58] showed that a combination of structural and kinetic modeling in yeast glycolysis significantly constrains the range of possible behaviors of a metabolic system. All elementary modes are not equal contributors to physiological cellular states, and this approach may open a direction towards a broader identification of physiologically relevant elementary modes among the very large number of stoichiometrically possible modes.
Very recently, Bastin et al. [59] developed a methodology to compute a decomposition of admissible flux vectors in a minimal number of elementary modes without explicitly enumerating all of them. They demonstrated that the vector of admissible weighting vectors (λ) rewritten as
𝛌 = ∑ 𝛽𝑖 𝐡𝑖 𝑘
𝑖=1
, 𝛽𝑖≥ 0, ∑ 𝛽𝑖 𝑘
𝑖=1
= 1 (2.9)
is necessarily an admissible λ satisfying Eq. (2.7). In this case, the convex polytope,
𝐇 = [ℎ1 ℎ2… ℎ𝑘], contains a number of solutions equal to the number of measurements. Each
as the simplest pathways that satisfy the pseudo-steady-state assumption and the constraints imposed by the extracellular measurements defined in Eq. (2.7).
2.4.4 Example: reduction of the elementary modes by weighting factor
minimization
Here we illustrate the method proposed by Schwartz and Kanehisa [58] for elementary mode reduction. This method identifies a subset of elementary modes by minimizing the sum of weighting factors (λ)
min ∑ 𝜆𝑖 𝑘
𝑖=1
subject to Eq. (2.4)
(2.10)
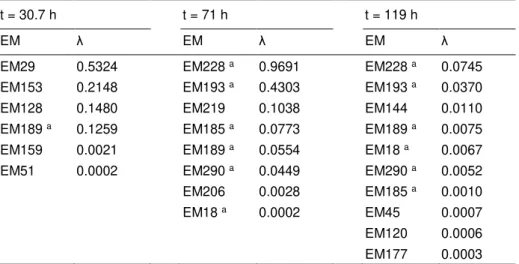
This method was applied to the previously described P. pastoris metabolic network including 4 119 elementary modes. The results are shown in Table 2.2 for three distinct time points. Only 17 elementary modes were obtained with nonzero weighting factors. Several of these are selected at least twice in the three different phases of the culture. Note that this method basically selects the elementary modes which are closest to the actual biological state by minimizing the sum of weighting factors.
Table 2.2 – Elementary mode reduction results for three distinct culture time points
t = 30.7 h t = 71 h t = 119 h
EM λ EM λ EM λ
EM29 0.5324 EM228 a 0.9691 EM228 a 0.0745
EM153 0.2148 EM193 a 0.4303 EM193 a 0.0370
EM128 0.1480 EM219 0.1038 EM144 0.0110 EM189 a 0.1259 EM185 a 0.0773 EM189 a 0.0075
EM159 0.0021 EM189 a 0.0554 EM18 a 0.0067
EM51 0.0002 EM290 a 0.0449 EM290 a 0.0052
EM206 0.0028 EM185 a 0.0010
EM18 a 0.0002 EM45 0.0007
EM120 0.0006 EM177 0.0003
2.5 Pathway-level process control
Upon the identification of the most significant elementary modes, macroscopic dynamic models can be derived with implicit intracellular structure, which can then be used for process monitoring and control. For a stirred tank bioreactor, such material balance equations take the following general form:
𝑑𝐜
𝑑𝑡 = 𝐛𝑋 − 𝐷(𝐜 − 𝐜𝐢𝐧) + 𝐐 (2.11)
In Eq. (2.11), the state space vector, c, is formed by the concentrations of extracellular compounds, X is the biomass concentration, D is the dilution rate, cin is the concentration of extracellular
compounds in the inlet stream, and Q is the vector of gas-liquid transfer rates of volatile extracellular compounds. Note that Eq. (2.11) is analogous to the state-space equation proposed by Dochain and Bastin to design adaptive state estimation and control algorithms [1]. The main difference lies in the fact that the extracellular fluxes, b, and the intracellular fluxes, v, are functions of the elementary flux mode weighting factors instead of the traditional reaction kinetics:
[ 𝐯𝐛 ] = [ 𝐀′𝐄𝐌× 𝐄𝐌 ] 𝝀 (2.12)
An important implication is that any state-space solution of Eqs. (2.11-2.12) obeys the steady-state stoichiometric constraints imposed by the metabolic network.
The main difficulty in deriving these models is the definition of the elementary mode weighting factors as functions of environmental properties. Provost and Bastin [9] employed Michaelis-Menten kinetic laws, resulting in very complex nonlinear systems, which are very difficult to identify. Teixeira et al. [11] have developed hybrid macroscopic models structured by elementary modes using neural networks to model the respective weighting factors. In any case, the effective reduction of the initially very large number of elementary modes is critical to decrease the complexity and to obtain a final parsimonious model.
enviromics studies the reconstruction of cellular function through the collection and analysis of dynamic envirome data. Functional enviromics applies the following main steps:
(i) Compute the elementary mode matrix, EM, from the microorganism metabolic network; (ii) Acquire informative envirome data over time and organize it in the form of an envirome data
matrix 𝐗 = {𝑐𝑖,𝑗}, a M× N matrix of N envirome factors, and respective measured flux data,
𝐑 = {𝐛𝑖}, a M× q’ matrix of measured fluxes;
(iii) Apply systems-level analysis of dynamic envirome data X and R to find relationships between environmental variables, ci,j, and elementary modes weighting factors, λi,j.
Figure 2.4 – Functional genomics versus functional enviromics. The genome sets the structure of elementary modes. The activation of elementary modes is controlled by the environment.
In what follows, we describe a possible functional enviromics algorithm based on the previous work by Ferreira et al. [13].
2.5.1 Functional enviromics algorithm
Among the whole set of elementary modes, the subset of elementary modes which is tightly linked to the envirome can be effectively determined by regression analysis of flux data, 𝐑 = {𝐛𝑖} against envirome data, 𝐗 = {𝑐𝑖,𝑗}, satisfying the following criteria:
a) Maximize the captured variance of envirome data 𝐗 = {𝑐𝑖,𝑗} and of flux data 𝐑 = {𝐛𝑖}; b) Maximize correlation between elementary modes weighting factors and envirome variables; c) Minimize the number of elementary modes required to capture a given variance of 𝐑 = {𝐛𝑖}
These criteria can be fulfilled by maximizing the covariance between envirome data, 𝐗 = {𝑐𝑖,𝑗}, and respective measured flux data, 𝐑 = {𝐛𝑖}, according to the formula:
Maximize
𝐈 cov(𝐗, 𝐑)
s. t. { 𝐑 = 𝚲 × 𝐄𝐌𝑇 𝚲 = 𝐗 × 𝐈𝑇
(2.13)
with 𝐄𝐌 = {𝐞𝑖} a q× K matrix of K elementary cellular functions, ei, each of length q, 𝚲 = {𝜆𝑖} a M× K matrix of weight vectors λi of elementary modes (dim(λi,) =M ), and 𝐈 = {𝐼𝑖,𝑗} a K× N matrix of
intensity parameters, which are the degrees in Eq. (2.13). Several methods can be used to solve Eq. (2.13). One efficient method consists in a one by one decomposition of elementary modes according to Eqs. (2.14-2.16):
𝐗 = 𝐓 × 𝐖𝑇+ 𝐄𝐅
X (2.14)
𝐑 = 𝚲 × 𝐄𝐌𝑇+ 𝐄𝐅
R (2.15)
𝚲 = 𝐓 × 𝐁𝑇+ 𝐄𝐅
𝚲 (2.16)
with EFi the residuals matrices that are minimized, W a matrix of loading coefficients and B a matrix of regression coefficients. Finally, the intensity matrix I is given by:
𝐈 = 𝐁 × 𝐖𝑇 (2.17)
The result of this procedure is the discrimination of a minimal set of elementary modes that is tightly linked with medium composition. The information can finally be organized in a N× K data array, called functional enviromics map:
Functional enviromics map = 𝐈
𝑇= {𝐼
𝑗,𝑖
} , 𝑗 = 1, … , 𝑁 , 𝑖 = 1, … , 𝐾
(2.18)The rows represent envirome factors, columns represent elementary modes and Ij,i the relative
“intensity” of up- or down-regulation of elementary cellular functions i by medium factor j.
2.5.2 Example: metabolic process control of
P. pastoris
cultures
the fermentation. Overhead pressure was controlled at 200 mbar. Glycerol feeding and dissolved oxygen (DO) control was divided into three phases:
(i) Glycerol batch phase – The reactor was operated initially in batch mode, starting with a glycerol concentration of 40 g/L. DO drops very slowly and remains close to saturation levels;
(ii) Glycerol fed-batch phase – An exponential feeding program is initiated once the concentration of biomass reaches the level of 18 g-DCW/L. It is in this phase that cell density increases significantly and DO decreases more rapidly. Once the DO reaches 50%, it is kept at that level by automatic closed-loop control, manipulating the stirrer speed between 300 and 1 000 rpm;
(iii) Oxygen transfer limitation phase – Once the stirrer speed reaches the maximum level of 1 000 rpm, DO decreases very rapidly and the glycerol feeding program is aborted. From this point on, the DO is kept constant at a low level (e.g., 3–5%) by closed-loop manipulation of the glycerol feeding rate (DO-stat feeding control strategy).
We have investigated how the calculated elementary modes in the example in Section 2.2.4 correlate with the environmental parameters by applying the previously described functional enviromics algorithm. Measured environmental parameters comprised the temperature (T), pH, stirrer speed, pressure, and the concentrations of dissolved oxygen, glycerol, biomass, product (scFv), and inorganic compounds (NH4+, K+, Ca2+, Mg2+, S, and P). From the concentrations of
inorganic salts we have calculated the ionic strength and the osmolarity. The measured rates were those of biomass, glycerol, oxygen, carbon dioxide, and product.
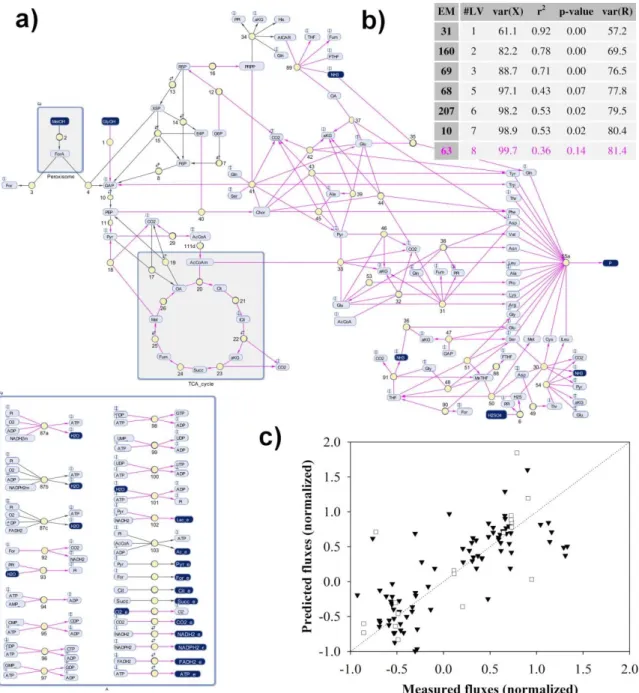
The initial number of elementary modes was 4 119, of which a small set of eight elementary modes were discriminated by functional enviromics (Figure 2.5b). The total explained variance of measured fluxes was 81.4%, and the correlation between predicted and measured fluxes was acceptable (Figure 2.5c) given the high level of noise in the measured rates.
Of the eight identified elementary modes, three made by far the largest contribution. Elementary modes 68 and 69 describe the biomass growth, and elementary mode 63 describes the product synthesis (marked in pink in the network of Figure 2.5). We have built a macroscopic model with these three elementary modes. The comparison between the model simulation and experimental measurements is shown in Figure 2.6.
Figure 2.5 – Functional enviromics of a P. pastoris X-33 strain expressing a scFv antibody: a)
metabolic network, b) subset of elementary modes with highest correlation with the environmental variables. Elementary mode 63 (marked in pink in the network and in the table) refers to the scFv biosynthesis. c)
Predicted versus measured fluxes by the method of Eq. (2.11).
Figure 2.6 – Simulation of biomass and product dynamic profiles on the basis of three elementary modes (EM 63, EM 68, and EM 69) identified by functional enviromics: a) biomass and product concentration over
time, and b) elementary mode weighting factors over time.
2.6 Conclusions
In a typical cell culture process there is a large number of environmental variables that shape cellular physiology. One important implication is that the design space for process development, namely culture medium optimization and process control, is potentially very large. Current process development methodologies in the industry are essentially of empirical nature. Empirical methods are not well suited to handle high-dimensional design spaces unless a substantial level of reductionism is applied, and even then with potential reduction of performance.
This paves the way for pathway-level process development strategies, which are much more efficient than traditional empirical methods.
Here we have laid out a process development methodology that can be summarized in the following main steps:
(i) Formulation of an accurate (genome-scale) metabolic network;
(ii) Computation of the elementary modes and pre-reduction of those elementary modes; (iii) Discrimination of elementary modes with high correlation with environmental variables by
functional enviromics;
(iv) Formulation of macroscopic material balances with explicit envirome-correlated elementary modes;
(v) Process optimization oriented to the manipulation of elementary mode weighting factors. Such design tools can be used to optimize culture media and for advanced process control. A main advantage is the significant reduction of the number of experiments for very large design spaces. This is possible because the structure of the metabolic network constrains the manipulation of the environment. Another big benefit is the possibility to target intracellular control variables such as metabolic reactions or metabolic pathways directly linked with productivity and product quality. All in all, such techniques have the potential to considerably accelerate process development speed, to improve the mechanistic interpretability, and to increase process performance.
References
1. Bastin G, Dochain D (1990) On-line estimation and adaptive control of bioreactors. Elsevier, Amsterdam 2. Otero JM, Nielsen J (2010) Industrial systems biology. Biotechnol Bioeng 105:439–460
3. Talarek N, Cameroni E, Jaquenoud M, et al. (2010) Initiation of the TORC1-regulated G(0) program requires Igo1/2, which license specific mRNAs to evade degradation via the 50-30 mRNA decay pathway.
Mol Cell 38:345–355
4. Borenstein E, Kupiec M, Feldman MW, Ruppin E (2008) Large-scale reconstruction and phylogenetic analysis of metabolic environments. Proc Natl Acad Sci U S A 105:14482–14487
5. Kell DB, Brown M, Davey HM, et al. (2005) Metabolic footprinting and systems biology: the medium is the message. Nat Rev Microbiol 3:557–565
6. Allen J, Davey HM, Broadhurst D, et al. (2003) High-throughput classification of yeast mutants for functional genomics using metabolic footprinting. Nat Biotechnol 21:692–696
7. Teixeira AP, Dias JML, Carinhas N, et al. (2011) Cell functional enviromics: unravelling the function of environmental factors. BMC Syst Biol 5:92
8. Haag JE, Wouwer AV, Bogaerts P (2005) Dynamic modeling of complex biological systems: a link between metabolic and macroscopic description. Math Biosci 193:25–49
10. Schuster S, Fell DA, Dandekar T (2000) A general definition of metabolic pathways useful for systematic organization and analysis of complex metabolic networks. Nat Biotechnol 18:326–332
11. Teixeira AP, Alves C, Alves PM, et al. (2007) Hybrid elementary flux analysis/nonparametric modeling: application for bioprocess control. BMC Bioinform 8:30
12. Feist AM, Palsson BO (2008) The growing scope of applications of genome-scale metabolic reconstructions using Escherichia coli. Nat Biotech 26:659–667
13. Ferreira A, Dias J, Teixeira A, et al. (2011) Projection to latent pathways (PLP): a constrained projection to latent variables (PLS) method for elementary flux modes discrimination. BMC Syst Biol 5:181
14. Song H-S, Ramkrishna D (2009) Reduction of a set of elementary modes using yield analysis. Biotechnol Bioeng 102:554–568
15. Pagani I, Liolios K, Jansson J, et al. (2012) The genomes online database (GOLD) v. 4: status of genomic and metagenomic projects and their associated metadata. Nucleic Acids Res 40:D571–D579
16. Tajparast M, Frigon D (2012) Genome-scale metabolic modeling to provide insight into the production of storage compounds during feast-famine cycles of activated sludge. In: Paper presented at the 3rd IWA/WEF wastewater treatment modeling seminar, Mont-Sainte-Anne, Quebec, 26–28 February 2012 17. Kanehisa Laboratories (2010) Kyoto encyclopedia of genes and genomes (KEGG).
http://www.genome.jp/kegg/
18. SRI International (2010) BioCyc database collection. http://biocyc.org/
19. Janga SC, Babu MM (2008) Network-based approaches for linking metabolism with environment. Genome Biol 9:239
20. Feist AM, Herrgard MJ, Thiele I, et al. (2009) Reconstruction of biochemical networks in microorganisms. Nat Rev Microbiol 7:129–143
21. Orth JD, Palsson BO (2010) Systematizing the generation of missing metabolic knowledge. Biotechnol Bioeng 107:403–412
22. Feist AM, Henry CS, Reed JL, et al. (2007) A genome-scale metabolic reconstruction for Escherichia coli
K-12 MG1655 that accounts for 1260 ORFs and thermodynamic information. Mol Syst Biol 3:121
23. Herrgard MJ, Swainston N, Dobson P, et al. (2008) A consensus yeast metabolic network reconstruction obtained from a community approach to systems biology. Nat Biotechnol 26:1155–1160
24. Chung BKS, Selvarasu S, Andrea C, et al. (2010) Genome-scale metabolic reconstruction and in silico analysis of methylotrophic yeast Pichia pastoris for strain improvement. Microb Cell Fact 9:50
25. Sohn SB, Graf AB, Kim TY, et al. (2010) Genome-scale metabolic model of methylotrophic yeast Pichia pastoris and its use for in silico analysis of heterologous protein production. Biotechnol J 5:705–715 26. Barabasi AL, Oltvai ZN (2004) Network biology: understanding the cell’s functional organization. Nat Rev
Genet 5:U101–U115
27. Bernhardsson S, Gerlee P, Lizana L (2011) Structural correlations in bacterial metabolic networks. BMC Evol Biol 11:20
28. Schuster S, Dandekar T, Fell DA (1999) Detection of elementary flux modes in biochemical networks: a promising tool for pathway analysis and metabolic engineering. Trends Biotechnol 17:53–60
29. Papin JA, Stelling J, Price ND, et al. (2004) Comparison of network-based pathway analysis methods. Trends Biotechnol 22:400–405
30. Celik E, Calik P, Oliver SG (2010) Metabolic Flux Analysis for recombinant protein production by Pichia pastoris using dualcarbon sources: effects of methanol feeding rate. Biotechnol Bioeng 105:317–329 31. von Kamp A, Schuster S (2006) Metatool 5.0: fast and flexible elementary modes analysis. Bioinformatics


![Table 3.1 – Design factors for medium screening. List of medium factors with respective baseline values [20], as well as upper and lower levels used for shake flask experiments](https://thumb-eu.123doks.com/thumbv2/123dok_br/16480546.732391/51.892.188.709.786.1092/table-design-factors-screening-factors-respective-baseline-experiments.webp)