Automatic tracking and deformation measurements of red blood cells flowing through a
microchannel with a microstenosis: the keyhole model
B. Taboadaa,b, F.C. Monteiroaand R. Limaa,b,c* a
ESTiG, IPB, C. Sta. Apolonia, 5301-857 Braganca, Portugal;bCEFT, FEUP, R. Dr Roberto Frias, 4200-465 Porto, Portugal; c
DEM, Universidade do Minho, Campus de Azure´m, 4800-058 Guimara˜es, Portugal
(Received 31 January 2014; accepted 20 August 2014)
This study aimed to assess the motion and its deformation index (DI) of red blood cells (RBCs) flowing through a microchannel with a microstenosis using an image analysis-based method. For this purpose, a microchannel having a smooth contraction was used and the images were captured by a standard high-speed microscopy system. An automatic image-processing and analysing method was developed in a MATLAB environment to not only track the motion of RBCs but also measure the DI along the microchannel. The keyhole model, tested in this study, proved to be a promising technique to automatically track individual RBCs in microchannels.
Keywords: automatic tracking; keyhole model; red blood cells; deformation index; microfluidics
Introduction
Ever since the clinical significance of red blood cells (RBCs) deformability became a possible way to diagnose several pathologies, many methods of measuring this phenomenon have been proposed. Some examples are the RBC filtration (Gueguen et al. 1984), laser diffraction ellipsometry (Shin et al. 2004), rheoscopy (Dobbe et al. 2002) and micropipette aspiration (Mokken et al.1992). Recently, by using a soft lithography technique, it was possible to fabricate transparent micrometre-sized channels to study motion (Abkarian et al.2008; Lima et al.2008, 2009,2012; Fujiwara et al.2009; Leble et al.2011; Garcia et al. 2012) and dynamical deformation (Yaginuma et al. 2011,2013; Pinho, Yaginuma, et al.2013; Faustino et al. 2014; Rodrigues et al. 2014) of cells flowing through microchannels. However, the majority of both cell tracking and deformation measurements are often made by using manual methods. These methods are extremely time-consuming and may introduce operator errors into the data. During the last years, several researchers have been developing different kinds of automatic particle tracking (APT) tools either as plugin for Image J (Sbalzarini and Koumoutsakos 2005; Smith et al.2011; Meijering et al. 2012) or as a MATLAB module (Meijering et al. 2012; Pinho, Gayubo, et al. 2013). Promising APT plugins for Image J are ‘Particletracker’ (Sbalzarini and Koumoutsa-kos 2005) and ‘SpeckleTrackerJ’ (Smith et al. 2011). Although both plugins can perform automatic tracking in an extremely fast way, these methods are still under development as the tracking trajectories tend to fail, especially at high haematocrits (Hcts). Recently, Pinho,
Gayubo, et al. (2013) developed a MATLAB module to track automatically labelled RBCs flowing through a microchannel. Using fluorescent labelling, several individ-ual RBCs were able to track automatically as bright object against a darker background. However, this method still requires some consuming time by the user to perform tracking and is not able to measure RBCs deformability flowing along the microchannel. Hence, it is crucial to develop a fast automatic method that is able to not only track individual RBCs but also measure their deformability. In this study, we propose an automatic image analysis technique based on the keyhole model to characterise the motion and deformation of RBCs flowing through a microchannel having a smooth contraction shape. In this geometry, the mechanical properties of RBCs are under the effect of both simple shear and extensional flows.
In this study, we propose an automatic image analysis technique (MKHtrackCells), based on the keyhole-tracking algorithm that describes the probable movement of RBC (Reyes-Aldaroro et al.2007). First, a sequence of binary images containing segmented foreground objects are obtained by pre-processing videos, and then tracks are formed by linking the objects with common optical flow in contiguous frames. Finally, we measure the deformation of individual RBCs flowing through a microchannel having a hyperbolic contraction. In this geometry, the mechanical properties of RBCs are under the effect of a strong extensional flow.
Optical flow segmentation is usually defined as a group of pixels of similar intensity that are associated with smooth and uniform motion information. Low-level
q2014 Taylor & Francis
*Corresponding author. Email:[email protected]
motion segmentation tries to group pixels with homo-geneous motion vectors without taking any other information apart from intensity or image gradient. High-level motion segmentation divides the image into regions that exhibit coherent motion and also uses other image cues to produce image segments that correspond to projections of real RBCs.
Our method takes the spatial atomic regions produced by the watershed algorithm and a variational motion estimation method and combines them into a complete algorithm producing a reliable motion segmentation framework that is used in the tracking step.
Materials and methods
Working fluids and microchannel geometry
The working fluid examined was composed of Dextran 40 containing ,2% of human RBCs (i.e. Hct, ,2%). The blood used was collected from a healthy adult volunteer, and ethylenediaminetetraacetic acid was added to the samples to prevent coagulation. The blood samples were then washed by centrifugation and then stored
hermeti-cally at 48C until the experiments were performed at a temperature of,378C.
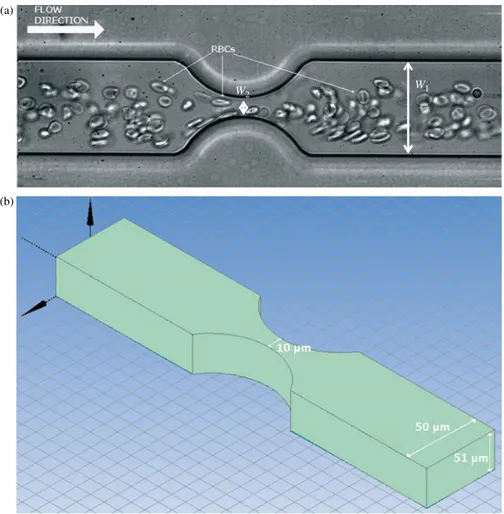
The microchannels containing the smooth contraction were produced in polydimethylsiloxane (PDMS) using a standard soft-lithography technique from a SU-8 photo-resist mould. The moulds were prepared in a clean room facility by photo-lithography using a high-resolution chrome mask. The geometry of the fabricated micro-channel is shown inFigure 1. The channel has a constant depth of 51mm throughout the PDMS chip and the width of the upstream and downstream channels was the same, cf. W1¼50mm. The minimum width in the contraction
region (W2) is 10mm.
For the microfluidic experiments, the device contain-ing the microchannel was placed on the stage of an inverted microscope (IX71, Olympus, Tokyo, Japan) and the temperature of the stage was adjusted to 378C by means of a thermoplate controller (Tokai Hit, Shizuoka, Japan). The flow rate of 1ml/min was controlled using a syringe pump (KD Scientific Inc., Holliston, MA, USA). The images of the flowing RBCs were captured using a high-speed camera (Phantom v7.1, Vision Research, W
2
W 1
(a)
(b)
Figure 1. (a) RBCs flowing through a microchannel having a smooth contraction shape.W1¼50mm andW2¼10mm. (b) A schematic of the microchannel in 3D.
B. Taboadaet al. 2
Wayne, NJ, USA) with the frame interval of 8000 fps and transferred to the computer for analysis. An illustration of the experimental set-up is shown inFigure 2.
Image analysis
The proposed methodology for image analysis has five major stages. First, we remove the background, noise and some artefacts of the original movie, as a pre-processing stage, obtaining an image only with the RBCs. Next, we create an over-segmented image, based on the initial magnitude gradient image, using the watershed transform. The optical flow information of these regions is obtained by using the variational method proposed by Brox et al. (2004). After that, the cell tracking links the atomic regions in contiguous frames, according to their motion, to form the tracks by means of a keyhole model proposed by Reyes-Aldaroro et al. (2007). Finally, we measure the deformation index (DI) of each RBC.
Pre-processing
At this stage, the image background is removed by subtracting the average of all movie images from each image. To improve the identification of RBCs, the image contrast is adjusted by histogram expansion.
Images taken with digital cameras will pick up noise from a variety of sources. As the watershed algorithm is very sensitive to noise, it is desirable to apply a noise reduction filter in the pre-processing step. Several filters have been proposed in the literature to reduce the spurious boundaries created due to noise. However, most of these filters tend to blur image edges while they suppress noise. To prevent this effect, we use the median filter. This filter preserves image structures while suppressing noise.
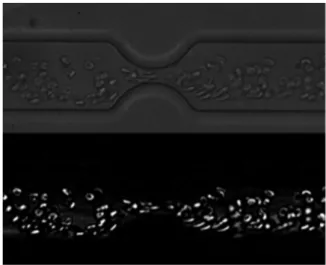
Figure 3 shows the result obtained after pre-processing
the image. For a better visualisation, we use the image negative.
Segmentation
Image segmentation is a fundamental step in image analysis systems, and aims to identify regions, the so-called segments that have a specific meaning within images. The regions have to be uniform with respect to some parameter, such as image intensity, texture or motion.
An ideal over-segmentation should be easy and fast to obtain and should not contain too many segmented regions, and it should have its region boundaries as a superset of the true image region boundaries. In this section, we present an algorithm step that groups pixels into ‘atomic regions’. The motivations of this preliminary grouping stage resemble the perceptual grouping task: (1) abandoning pixels as the basic image elements, we instead use small image regions of coherent structure to define the optical flow patches. In fact, because the real world does not consist of pixels, it can be argued that this is even a more natural image representation than pixels as those are merely a consequence of the digital image discretisation.
Watershed transform is a classical and effective method for image segmentation in grey-scale mathemat-ical morphology. For images, the idea of the watershed construction is quite simple. An image is considered as a topographic relief where for every pixel in position (x,y), its brightness level plays the role of thez-coordinate in the landscape. Local maxima of the activity image can be thought of as mountain tops, and minima can be considered as valleys.
In the flooding or immersion approach (Vincent and Soille 1991), single-pixel holes are pierced at each regional minimum of the activity image which is regarded as topographic landscape. When sinking the whole surface slowly into a lake, water leaks through the holes, rising uniformly and globally across the image, and proceeds to fill each catchment basin. Then, in order to avoid water Figure 2. Experimental set-up: inverted microscope,
high-speed camera, syringe pump and thermoplate controller.
Figure 3. Up: original image. Down: pre-processed image.
coming from different holes merging, virtual dams are built at places where the water coming from two different minima would merge.
We start by computing the image gradient magnitude and remove the weakest edges by gradient minima suppression (pre-flooding). Figure 4 shows the gradient image, the image after applying a 5% of the gradient maximum pre-flooding, and the image after applying the watershed method.
Figure 5 shows the original RBC segmented by
watershed transform.
Optical flow
There is a strong interdependence between the definition of the spatial support of a region and of its motion estimation. On the one hand, the estimation of the motion information of the region depends on the region of support. Therefore, a careful segmentation of the regions is needed in order to estimate the motion accurately. On the other hand, a moving region is characterised by coherent motion characteristics over its entire surface (assuming that only rigid motion is permitted). Therefore, a precise estimation of the motion is required in order to obtain an accurate segmentation of the region.
All the motion estimation approaches assume that there is a point correspondence between two consecutive frames which induces dense motion vector field of an image. No matter what method is used, at some stage we need a mechanism to assign each point to one of the
recovered motions. This mechanism must take into account the smoothness of the world, i.e. the intuitive notion that the points belonging to the same motion are also spatially clustered in the image.
Motion information will be initially represented through a dense motion vector field, i.e. it estimates which one best relates the position of each pixel in successive image frames. For the task at hand, we adopt a high accuracy optical flow estimation based on a coarse-to-fine warping strategy proposed by Brox et al. (2004) which can provide dense optical flow information. This method accelerates convergence by allowing global motion features to be detected immediately, but it also improves the accuracy of flow estimation because it provides better approximation of image gradients via warping. This technique is implemented within a multi-resolution framework, allowing the estimation of a wide range of displacements.
Estimating optical flow involves the solution of a correspondence problem. That is, which pixel in one frame corresponds to which pixel in the other frame. In order to find these correspondences, one needs to define some properties that are not affected by displacement. The combined variational approach (Brox et al.2004) differs from usual variational approaches by the use of a gradient constancy assumption. This assumption provides the method with the capability to yield good estimation results even in the presence of small local or global variations of illumination.
Given two successive images of a sequence Iðx;y;tÞ
and Iðxþu;yþv;tþ1Þ, we seek at each pixel x:¼
ðx;y;tÞ
T
the optical flow vector vðxÞ:¼ ðu;v;1Þ
T that describes the motion of the pixel at x to its new location ðxþu;yþv;tþ1Þin the next frame.
. Grey-value constancy assumption. It is assumed that the grey value of a pixel is not changed by displacement:
Iðx;y;tÞ ¼Iðxþu;yþv;tþ1Þ: ð1Þ
. Gradient constancy assumption. A global change in illumination both shifts and scales the grey values of an image sequence. Shifting the grey values will not affect the gradient. Although scaling the grey values Figure 4. (a) Gradient image. (b) Result after the pre-flooding.
(c) Result after the watershed method.
Figure 5. Image with a black background and the segmented regions with the original colour.
B. Taboadaet al. 4
changes the length of the gradient vector, it does not affect its direction. Thus, we assume that the spatial gradients of an image sequence can be considered as constants during motion:
7Iðx;y;tÞ ¼7Iðxþu;yþv;tþ1Þ: ð2Þ
. Smoothness assumption. If the model estimates the displacement of a pixel without taking into account any interaction with the neighbouring pixels, problems may occur. In addition, if only the flow in normal direction to the gradient can be estimated, then some outliers on the estimates are also expected. The smoothness of the flow will reduce these problems. Deviations from these assumptions of the model are penalised through the creation of an energy function. Considering x and v, the global deviation between the grey-value constancy and the gradient constancy assumptions are measured by the following energy function:
EDataðu;vÞ ¼ ð
V
cðjIðxþwÞ2IðxÞj2þgj7IðxþwÞ
27IðxÞj2Þdx; ð3Þ
where V is the region of interest over which the minimisation is done and g relates the weight between both assumptions. When the concave function c is increased, the outliers do not get much influence on the estimation.
The smoothness assumption is motivated by the observation that it is reasonable to introduce a certain dependency between neighbouring pixels in order to deal with outliers caused by noise, occlusions or other local violations of the constancy assumption. This assumption states that disparity varies smoothly almost everywhere (except at depth boundaries). This means that we can expect the optical flow map to be piecewise smooth and it follows some spatial coherency. This is achieved by penalising the total variation of the flow field. Smoothness
is assumed by almost every correspondence algorithm:
ESmoothðu;vÞ ¼ ð
V
cðj7uj2þ j7vj2Þdx ð4Þ
where7 represents the image gradient. The smoothness term gives a penalty to adjacent segments which have different motion parameters.
Applying non-quadratic penaliser functions to both the data and the smoothness term and also integrating the gradient constancy assumption result in the optical flow model described by the following energy function:
Eðu;vÞ ¼EDataþaESmooth; ð5Þ
where a is a positive regularisation parameter which balances the data and the smoothness terms. In our experiments, we use the value of 80. Now the goal is to find the functionsuandvthat minimise this energy.
To facilitate the visualisation of flow field, a representative RGB image is used, in which the colour indicates the direction of the displacement and the intensity indicates the magnitude (Figure 6).
Figure 7 represents the obtained optical flow for the
studied microchannel.
Tracking
In the keyhole model, assuming that the child RBC (cell at frame t) moves in the same direction and velocity as its parent (cell at frame t– 1), it is possible to predict the Figure 6. Colour code of the optical flow. (Colour online.)
Figure 7. Obtained result for the optical flow. (Colour online.)
Figure 8. Keyhole model.
position of the cell in the next frame. Two regions of probability where the RBC is most probable to be were therefore defined: a narrow wedge (608 wide) oriented towards the predicted position, and a truncated circle (3008) that complements the wedge; together they resemble a keyhole. This model was designed in a mask of 141£141 pixels, as shown inFigure 8, in which the keyhole has a wedge length of 60 pixels and the circle has a radius of 15 pixels. This design allows the keyhole model to rotate 1808within the mask.
Figure 9shows the tracking of two selected cells along
the microchannel with a smooth contraction. The RBC flowing in the centreline and far upstream of the contraction region has a mean diameter of about 25 pixels. In addition, the maximum velocity at the contraction region is around 12 mm/s.
Deformation index
DI is a dimensionless number which represents a degree of deformation of the circular object in 2D. Commonly used DI is obtained by the following formula:
DI¼ða2bÞ
ðaþbÞ; ð6Þ
whereaandbare the major and minor axes lengths of the circular object. DI values are between 0 and 1, and a perfect circle means DI¼0. When the object is strongly elongated, DI shows a high value. In order to obtain necessary axes lengths, the ‘regionprops’ function of MATLAB was used in the present method. Given the scalar ‘MajorAxisLength’ and ‘MinorAxisLength’, this function returns the major and minor axes lengths of the ellipse that is fitted to the object to measure.
Results and discussion
The proposed method (MKHtrackCells) was implemented to track four RBCs, represented inFigure 10, throughout a microchannel with a smooth contraction.
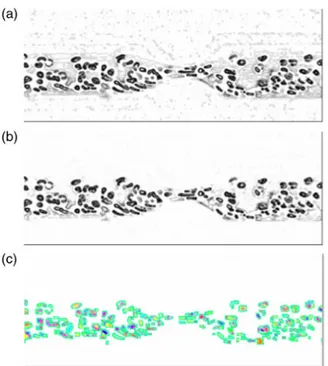
For RBCs 1 and 2, the proposed method could do the correct tracking along the microchannel and it was possible to measure their trajectories (seeFigure 11). Note
that the vertical red lines represent the microstenosis region. Regarding RBC 3, the method could not properly follow the cell throughout the microchannel because the colour of the cell was indistinguishable from the Figure 9. Trajectories of two RBCs by using the keyhole model
(MKHtrackCells). (Colour online.)
Figure 10. Selected RBCs to test the proposed image analysis method (MKHtrackCells). (Colour online.)
Figure 11. Blood cells trajectories: (a) RBC 1, (b) RBC 2 and (c) RBC 3. The vertical red lines represent the microstenosis region. (Colour online.)
B. Taboadaet al. 6
background colour, so that the image processing, including segmentation, could not identify the RBC 3 correctly, losing the region corresponding to the RBC 3. The Hct used in this study has also contributed to difficulties in tracking RBC 3. The region just after the microstenosis is the location where the tracking algorithm lost the RBC 3 and has identified other neighbour RBCs (see
Figure 11(c)).
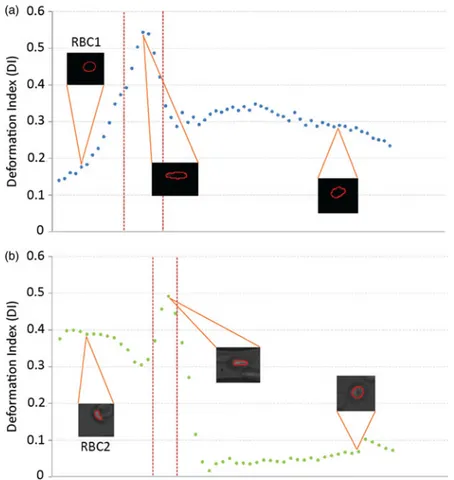
Figure 12 shows the DI along the microchannel for
RBCs 1 and 2. We can observe that RBC 1 had a higher value when the cell was passing in the microstenosis region. For RBC 2, it is possible to observe that before the microstenosis, the DI value is relatively high when compared with RBC 1 DI. This is mainly due to the orientation of RBC 2 that is affected by a neighbouring cell, and therefore its initial geometry is not spherical as RBC 1. However, when the RBC 2 leaves the microstenosis, it begins to modify to an ellipsoid shape and consequently its DI tends to lower down.
Figure 13shows average values of the DI of RBCs 1 – 3
at three different regions: before, within and after the microstenosis. These results show clearly that all RBCs increase their DI in the microstenosis region. Note that the absence of DI values of RBC 3 after the microstenosis was due to the loss of this particular RBC after passing through the stenosis. Currently, we are improving the pre-processing step of the proposed method in order to improve the segmentation of each RBC.
Conclusion and future work
This study applied an image analysis technique based on the keyhole model to the application for tracking RBCs Figure 12. DI along the microchannel of (a) RBC 1 and (b) RBC 2. The vertical red lines represent the microstenosis region. (Colour online.)
Figure 13. DI average values of RBCs 1, 2 and 3 at three different regions: before, within and after the microstenosis.
flowing through a microchannel with a microstenosis. Our results showed that the calculation of the direction of optical flow was the most suitable strategy to find the best position. Although the studied model has showed promising results, it is not a feasible model to conduct a study in real time, because the calculation of optical flow is slow. However, the model was proved to be a promising technique for cell tracking, because for the majority of the studied regions, their child cells were successfully found. In addition, the proposed method was proved to be an efficient technique to not only track the motion of RBCs but also measure the DI along a microchannel with a smooth contraction. This method by reducing the execution time and possible errors by the users provides a faster and accurate way to obtain automatically multiple RBC trajectories and DIs, especially when compared with the manual methods often used in microcirculation.
As a future work, taking advantage of the current model, we intend to create a new model that allows the cell tracking in real time, which provides faster and more accurate results. As the model has a potential to expand its functionality, we further intend to develop additional instantaneous measurement functions such as the distance of RBCs from the microchannel wall or neighbour cells.
The application of the proposed method to other more complex flows such as using microchannels with different geometries and higher Hcts are also worth studying in the near future. A large number of RBCs measurements are ideal and important in order to provide statistically trustable DI values. Because the deformability of cells is directly related to several diseases, such as diabetes and malaria, it will also be interesting to apply this method with pathological cells and verify the potential of this method to perform early diagnosis of diseases related to the deformability of cells.
Funding
This study was financially supported by the Science and Technology Foundation (FCT), COMPETE, QREN and the European Union (FEDER) [grant numbers PTDC/SAU-BEB/ 105650/2008, PTDC/SAU-ENB/116929/2010, EXPL/EMS-SIS/ 2215/2013].
References
Abkarian M, Faivre M, Horton R, Smistrup K, Best-Popescu CA, Stone HA. 2008. Cellular-scale hydrodynamics. Biomed Mater. 3(3):034011.
Brox T, Bruhn A, Papenberg N, Weickert J. 2004. High accuracy optical flow estimation based on a theory for warping. In: Pajdla T, Matas J, editors. European conference on computer vision (ECCV). Vol. 3024. Berlin: Springer, LNCS; p. 25 – 36.
Dobbe JGG, Hardeman MR, Streekstra GJ, Strackee J, Ince C, Grimbergen CA. 2002. Analyzing red blood cell-deform-ability distributions. Blood Cells Mol Dis. 28:373 – 384.
Faustino V, Pinho D, Yaginuma T, Calhelha R, Ferreira I, Lima R. 2014. Extensional flow-based microfluidic device: deformability assessment of red blood cells in contact with tumor cells. BioChip J. 8(1):42 – 47.
Fujiwara H, Ishikawa T, Lima R, Matsuki N, Imai Y, Kaji H, Nishizawa M, Yamaguchi T. 2009. Red blood cell motions in a high hematocrit blood flowing through a stenosed micro-channel. J Biomech. 42:838 – 843.
Garcia V, Dias R, Lima R. 2012.In vitroblood flow behaviour in microchannels with simple and complex geometries. In: Naik GR, editor. Applied biological engineering – principles and practice. Rijeka: InTech; p. 393 – 416.
Gueguen M, Bidet JM, Durand F, Driss F, Joffre A, Genetet B. 1984. Filtration pressure and red blood cell deformability: evaluation of a new device: erythrometre. Biorheol Suppl. 1:261 – 265.
Leble V, Lima R, Dias R, Fernandes C, Ishikawa T, Imai Y, Yamaguchi T. 2011. Asymmetry of red blood cell motions in a microchannel with a diverging and converging bifurcation. Biomicrofluidics. 5:044120.
Lima R, Ishikawa T, Imai Y, Yamaguchi T. 2012. Blood flow behavior in microchannels: advances and future trends. In: Dias R, et al., editors. Single and two-phase flows on chemical and biomedical engineering. Sharjah: Bentham Science; p. 513 – 547.
Lima R, Oliveira MSN, Ishikawa T, Kaji H, Tanaka S, Nishizawa M, Yamaguchi T. 2009. Axisymmetric PDMS microchan-nels for in vitro haemodynamics studies. Biofabrication. 1(3):035005.
Lima R, Wada S, Tanaka S, Takeda M, Ishikawa T, Tsubota K, Imai Y, Yamaguchi T. 2008. In vitro blood flow in a rectangular PDMS microchannel: experimental observations using a confocal micro-PIV system. Biomed Microdevices. 10(2):153 – 167.
Meijering E, Dzyubachyk O, Smal I. 2012. Methods for cell and particle tracking. In: Conn PM, editor. Imaging and spectroscopic analysis of living cells, of methods in enzymology. Vol. 504, Ch. 9. Amsterdam: Elsevier; p. 183 – 200.
Mokken FC, Kedaria M, Henny CP, Hardeman MR, Gelb AW. 1992. The clinical importance of erythtrocyte deformability, a hemorrheological parameter. Ann Hematol. 64:113 – 122. Pinho D, Gayubo F, Pereira AI, Lima R. 2013. A comparison
between a manual and automatic method to characterize red blood cell trajectories. Int J Numer Meth Biomed Eng. 29(9):977 – 987.
Pinho D, Yaginuma T, Lima R. 2013. A microfluidic device for partial cell separation and deformability assessment. BioChip J. 7(4):367 – 374.
Rodrigues R, Faustino V, Pinto E, Pinho D, Lima R. 2014. Red blood cells deformability index assessment in a hyperbolic microchannel: the diamide and glutaraldehyde effect. WebmedCentralplus Biomed Eng. 1:WMCPLS00253. Reyes-Aldaroro CC, Akerman S, Tozer G. 2007. Measuring the
velocity of fluorescently labelled red blood cells with a keyhole tracking algorithm. J Microsc. 229: Pt 1 2008:162 – 173.
Sbalzarini IF, Koumoutsakos P. 2005. Feature point tracking and trajectory analysis for video imaging in cell biology. J Struct Biol. 151(2):182 – 195.
Shin S, Ku Y, Park MS, Suh JS. 2004. Measurement of red cell deformability and whole blood viscosity using laser-diffraction slit rheometer. Korea-Austr Rheol J. 16:85 – 90. Smith MB, Karatekin E, Gohlke A, Mizuno H, Watanabe N,
Vavylonis D. 2011. Interactive, computer-assisted tracking B. Taboadaet al.
8
efficient algorithm based on immersion simulations. IEEE PAMI. 13(6):583 – 598.
Yaginuma T, Oliveira MSN, Lima R, Ishikawa T, Yamaguchi T. 2011. Red blood cell deformation in flows through a PDMS
2013. Human red blood cell behavior under homogeneous extensional flow in a hyperbolic-shaped microchannel. Biomicrofluidics. 7:054110.