Joao man I!I R.5. Tau
rl!5
CRC Press/Balkema is lfll illlpriJIt (~r ffIe Taylor & Froncis GruIlP, cm informa bllsiness
© 2012 Taylor & Francis Group, London, UK
Typeset by Vikatan Publishing Solutions (P) Ltd. , Chennai, India Printed and bound by CPI Group (UK) Ltd, Croydon, CRO 4YY
Ali rights rcscrvcd. No part of this publication or the information contained herein may be reproduced , stared in a retrieval system, ar transmitted in any form ar by any means, electronic, mechanical, by photacapying, rccarding ar atherwise, withaut written prior permission from the publisher.
AIthough ali care is takcn ta ensure integrity and the quality of this publication and the information herein , no responsibi!ily is assumed by the publishers nor the author for any damage to the property or persons as a result Df operation or use of this publication and/or the information contained herein.
Published by: CRC Press/Balkema
P.O. Bo, 447, 2300 AK Leidcn, Thc Nctherlands
e-mai!: [email protected]
www.crcpress.com - www.taylorandfrancis.co.uk - www.balkema.nI
ISBN: 978-0-415-68395-1 (Hbk) ISBN: 978-0-203-12818-3 (eBook)
PROCEEDINGS OF VIPIMAGE 2011 - THIRD ECCOMAS THEMATIC CONFERENCE ON COMPUTATIONAL VISION AND MEDICAL IMAGE PROCESSING, OLHÃO, ALGARVE, PORTUGAL, 12-14 OCTOBER 2011
ComputationaI Vision and MedicaI
Image Processing
VipIMAGE 2011
Editors
João Manuel R.S. Tavares & R.M. Natal Jorge
Faculdade de Engenharia da Universidade do PorIa
PorIa, Portugal
o
~Y~~F;'~~~~oup
Boca Rilton london New York LeidenComputational Vision and Medicallmage Processing - Tavares & Natal Jorge (eds)
© 2012 Tay/or & Francis Group, London, /SBN 978-0-415-68395-1
An
autol11atic l11ethod to track Red Blood Cells in l11icrochannels
D. Pinho
pofyteclmic: lnstiwlt! Df Bragança, ESTiGIIPB, C SI(/. Apolonia, Bragança, Portugal
F.
GayuboFllIulaôóll CAR TIF. Dilrisióll de Robótica y Visiúll Art{/iciaJ, Parque Tecnulógico de Buceilfo, ValladaUt!, SPllÍlI
A. Isabel
Polytedlllic IlIstilllle of Bragallça, ESTiGIJPB, eSta. Apolol/ia, Bragança, Porfllgal ALGORITMI, MinI/(} Ullil'el:\·ir)'. CamplIs de A=lIrJm, Guilllal'l;es. Portugal
R. Lima
PO/Jlfeclmic lllsfitllfe of Bragal/ça, ESTiGIIPB, C. Sra. Ap%llia, Bragal/ça, Portugal CEFT. FEUP, R DI: Roherto Frias, Porto, Portugal
ABSTRACT: Imagc analysis is cxtremely important to obtain crucial inrorrnation about lhe blood phenomena in microcirculation. The current sludy proposcs an automatic method ror scgmcntation and tracking Red Blood Cells (RBCs) Oo\Ving Ihrough a 100 (.Im Glass capillary. Thc original images \Vere obtaincd by means of a confocal systcm and then processcd in Mallab using the Image Processing Tool-box. The automatic measureme nts obtained with lhe proposed automatic rncthod a re compared with a manual tracking method using a plugin from ImageJ.
INTRODU CTION
The sludy of lhe red blood cells (RBCs) Oowing in mi crovesscls and microchanncls is very important to provide a bcttcr understanding on the blood rhcological properties and disorders in microvcs-seis [I -5). In Ihis kind of sludy, lhe image analysis is an csscntial part to obtain crucial inrormation about lhe blood rheology. However, most or the data analysis procedures have bcen cxecutcd man-ually [1 - 3] which is aD extrcrncly time consul11-ing ta sk especially with a large amounl of data. Additionally, ma nual tracking methods can also inlroduce use r crrors into the data. H encc, it is important to devclop image analysis methods able to get the data automatically. The main purposc of this work is to develop an approach ablc to track lhe RBCs with x and y eoordinatcs auto-matically. To accomplish it wc tcsted filtering, scgmcntation and feature extraction function s available in MatLab.
2 MATERIALS AND METHODS
2.1 Experimellfa/ sel-lIp
The conrocal micro-PIV syslem used in this
Olympus) combined with a Confoeal Scanning Unil (CSU22; Yokogawa), a Diode-Pumpcd Solid-Slatc (DPSS) laser (Laser Quanlum) \Vilh an excitation wavelength of 532 nm and a high-speed camera (Phantom v7.l; Vision Re sea rch ) (Fig. I). The glass capillary was plaeed on lhe slage of lhe invertcd microscope and by using a sy rin ge pump (KD Scientiric) a pressurc-driven now was kept constant (Re - 0.008).
Temp~rllture
1~ ~:~;;:~
c ;ontrOller
OPSS huer Data Transfer
study consists or an inverted microsco pe (IX? I ; Figure I. Experimentalsel-up.
More detailed information about this system can be found eIsewhere [I].
2.2 /lI1age ana(Jlsis
The laser beam was ilIuminated from below the microscopc stage through a dry 40x objcctive lens with a Numerical Aperture (NA) equal to 0.9. The confocal images were captured in middle of the capillary with a resolution of 640 x 480 pixel at a rate of 100 frames/s with an exposure time of 9.4 ms. Two image analyses rncthods were used in this study: method I (manual approach) and method 2 (automatic approach).
2.2.1 Method I
A manual tracking plugin (MTrackJ) [6] of an image analysis software (ImagcJ, NlH) [7] was uscd to track individual RBC. By using MTrackJ plugin , lhe bright ccntroid of the selected RBC was automaticalIy computed through successive images for an interval Df time of 10 ms. After obtaining
x and y positions, the data were exported for lhe determination of each individual RBC trajectory.
2.2.2 Mei/lVd 2
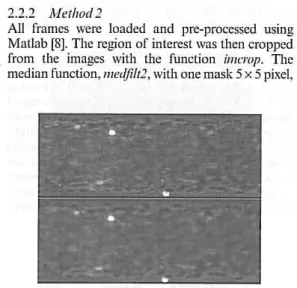
Ali [rames \Vere loaded and pre-processcd using Matlab [8]. The region of interest was then cropped . from the images with the function ill/crop. Thc median function, mel(/i!12, with one mask 5 x 5 pixel,
Figure 2. The regian af intercst (above) and lhe image
liltercd by using the median functian mcdjU/2.
Figure 3. Result af the iterativc threshold mcthod and
the filter Sobe/o
was applied to eliminate most of the noise and to enhancc the flowing object. In Fig. 2 we can see the result of these processing steps. In the next step, the images are subject to a segmentation filter, Sobe/.
With this segmentation it is possible to separate RBCs from the background, i.e. diITerentiate the area of interest (the RBCs) from the not-interest area (background irnage). This is possible using a
Iflresfl-o/dmethod. where a definition of one or more values of separation is enough to divide the image into one or more regions. The function iteratil'e tflres/101d was applied for the scquence of ali lhe images.
The objects are defincd with the Sobe! filter (see Fig. 3), which shows only the edge of the objects.
The Sobe/ computes an approxirnation of the
gra-dient of the image intensily. At each pixel point in the image. the result of the Sobe! operator is either the correspon'ding gradient vector or the norrn of this vector . .
3 RESULTS AND DISCUSSION
After the segmentation processing, the RBCs were tracked and sets of data (x and y positions) were obtained with the Matlab function (Fig. 4), stored in the image processing toolbox, regioJ/props.
This function measures a set of properties (arca, centroid, etc.) for each connected component (RBC) in the binary image.
In the Fig. 5 we can see the tracking of two RBCs, in a sequence of successive images, with an intervaJ of 4 [carnes.
AlI of thesc image processes, presentcd in this work, are placed in an application. RBC Data
Trar...'killg, built in MatLab, in which ali the steps
can be done automatically.
Fig. 6 shows a qualilalive comparison between melhod I (manual) and method 2 (automatic). The trajectories obtained from the proposcd automatic method looks more smooth when compared with manual mcthod.
Some deviations are observed belween both methods. This may be due to the inaccuracy in manual tracking, especially for determination of the center of the RBCs, bccause the automatic method is more sensitivc, even in the presence of smalI changcs in the centroid.
Figure 5. RBCs tracking and data extraction in a sequence of 4 to 4 fmmes.
m CeUl
'"
- " _""l""'.U<'" I--- - - -_--_--.-____ ~~--
-'"
'"
~ ~ 11 ) m lU In rol nl Pti l ~
_hun]
o)
CeJl2
- l U
~
'"
,
..
'"
:::L/
m _____ ~,--- ________ _
• ]....,1
b)
Figure 6. Comparison of the manual (a) and automatic (b) methods.
223
Velocity
CO ·
0,8 ~ _ ed I M."",1 ___ C.!U A,;t ... u< _C.!UM".:n1 --_ c,Mlk::=.t.<:
"
o~ ~,p.~ .Í-\ .. '- , .'7
o., }..I1P-''"'A../''VV''''''' ... 'Q'o''''' .... '''' ... )''<''<' '"vl\.(r;';v.
'l-~ 'l-~--'l-~--'l-~-- - ---~ ---- --- ~ --- ~
"
,.
'"
Figure 7. Velocity af two cells by using both methods.
Fig. 7 shows the velocity of cell I and cell 2 cal~ culated by data obtained from both methods. The results show good agreement between the two methods.
4 CONCLUSIONS
Although the automatic mcthod presentcd in this study is a promising way to track the nowing RBCs, additiooa! image analysis needs to be performcd. Hence, detailed quantitative measurements of the RBC trajectories are currently under way and will be presented in due time.
In future work we are planning to explore more techniques to obtain quantitativc measurements of the RBC trajectories, and more image analysis strategies oeed to be performed.
ACKNOWLEOGEMENTS
The authors acknowledgc the financiai support provided by: PTOC/SAU-BEBII08728/2U08, PTOC/SAU-BEB/l05650/2008 and PTOC/EME-MFE/099I 09/2008 from the FCT (Seienee and Teeh-nology Foundation) and COMPETE, Portugal.
REFERENCES
[I] Lima R, Ishikawa T, Imai Y, Takeda M, \Vada S and Yamaguchi T. Mcasurerncnt of individual red blood cell motions undcr high hcrnatocrit conditions using a confocall11icro~
PTV systcm. Awwls oj'Biollledical EI/gil/eering
37,1546--1559,2009.
[2] Fujiwara H, Ishikawa T, Lima R, et aI. Red blood cell motions in high-hematocrit blood flowing through a stenoscd microchannel.
JOlll'llal of Biomeclu1I/ics 42,838- 843,2009 .
I
I
(4) Pries A. Sccomb T, et a1. Resistancc to blood Ilow in microvessels in vivo . Ci/'clIlatiol1 Research 75, 904-9 I 5 1994.[5J Pinho D, et a1. Red bl~od ceIls motion in a glass microchannel , NumericaJ Analysis and Applied
Mathematics, VoJ. 128 I: 963- 966, 20 I O.
[6J Mcijering E, Smal I and Danuser G. Tracking
in molecular bioimaging, IEEE Sigllal Processo
Nfag 23: 46-53, 2006.
[7] AbramofT M , Magclhaes P and Ram S. Imagc
processing with imageJ, Bioplwtonics Im.
11 : 36-42, 2004.
[8] Steven L. Eddin, Rafael C. Gonzalez, Richard E.
Woods, Digital Image Processing UsingMallab,