Preanalytical Conditions and DNA Isolation
Methods Affect Telomere Length
Quantification in Whole Blood
Alexander Tolios, Daniel Teupser, Lesca M. Holdt*
Institute of Laboratory Medicine, Ludwig-Maximilians-University Munich, Munich, Germany
Abstract
Telomeres are located at chromosome ends and their length (TL) has been associated with aging and human diseases such as cancer. Whole blood DNA is frequently used for TL measurements but the influence of preanalytical conditions and DNA isolation methods on TL quantification has not been thoroughly investigated. To evaluate potential preanalytical as well as methodological bias on TL, anonymized leftover EDTA-whole blood samples were pooled according to leukocyte counts and were incubated with and without actinomy-cin D to induce apoptosis as a prototype of sample degradation. DNA was isolated from fresh blood pools and after freezing at -80°C. Commercially available kits using beads (Invi-trogen), spin columns (Qiagen, Macherey-Nagel and 5prime) or precipitation (Stratec/Invi-sorb) and a published isopropanol precipitation protocol (IPP) were used for DNA isolation. TL was assessed by qPCR, and normalized to the single copy reference gene36B4using two established single-plex and a new multiplex protocol. We show that the method of DNA isolation significantly affected TL (e.g. 1.86-fold longer TL when comparing IPP vs. Invitro-gen). Sample degradation led to an average TL decrease of 22% when using all except for one DNA isolation method (5prime). Preanalytical storage conditions did not affect TL with exception of samples that were isolated with the 5prime kit, where a 27% increase in TL was observed after freezing. Finally, performance of the multiplex qPCR protocol was com-parable to the single-plex assays, but showed superior time- and cost-effectiveness and required>80% less DNA. Findings of the current study highlight the need for standardiza-tion of whole blood processing and DNA isolastandardiza-tion in clinical study settings to avoid preanaly-tical bias of TL quantification and show that multiplex assays may improve TL/SCG
measurements.
Introduction
Telomeres are DNA sequences defining the ends of chromosomes [1]. They are present in almost all species with linear chromosomes [2] and consist of repetitive hexameres
(TTAGGG)noriented from 5’to 3’as well as a heterogeneous group of associated
telomere-binding proteins [3]. Their size is highly dynamic spanning from less than 500 bp to more than 20 kbp [4]. Telomere shortening has been suggested as an intrinsic clock [5], limiting somatic
OPEN ACCESS
Citation:Tolios A, Teupser D, Holdt LM (2015) Preanalytical Conditions and DNA Isolation Methods Affect Telomere Length Quantification in Whole Blood. PLoS ONE 10(12): e0143889. doi:10.1371/ journal.pone.0143889
Editor:Gabriele Saretzki, University of Newcastle, UNITED KINGDOM
Received:September 4, 2015
Accepted:November 10, 2015
Published:December 4, 2015
Copyright:© 2015 Tolios et al. This is an open access article distributed under the terms of the Creative Commons Attribution License, which permits unrestricted use, distribution, and reproduction in any medium, provided the original author and source are credited.
Data Availability Statement:All relevant data are within the paper and its Supporting Information files.
Funding:The authors have no support or funding to report.
cell divisions (known as the“Hayflick limit”[6]) before entering the stage of“replicative senes-cence”[3,7]. Decreased telomere length has also been associated with obesity and smoking [8,
9], as well as genomic instability [10]. Moreover, an association of decreased telomere length with several diseases, such as increased risk of cancer [11], idiopathic pulmonary fibrosis [12], bone marrow failure and/or liver cirrhosis [13], acute myeloid leukemia, and myelodysplastic syndrome [14–16] has been demonstrated.
For assessment of telomere length, different methods have been established. The first tech-nique was the Terminal Restriction Fragment (TRF) length analysis by Southern blot gel elec-trophoresis [4,17]. This method utilizes restriction enzymes to fully digest genomic DNA while sparing telomeres due to their repetitive sequences, resulting in short genomic DNA pieces and long telomeric sequences. Although this technique is still considered the gold stan-dard for telomere analysis, it has several limitations and disadvantages, for example the high DNA amounts required for the analysis as well as the complex and time-consuming methodol-ogy [2]. Alternative approaches were aimed to overcome these limitations, such as the Single TElomere Length Analysis (STELA), a single molecule ligation PCR-based method [18], and quantitative fluorescence in situ hybridization (Q-FISH) using digital fluorescence microscopy [19–21].
To facilitate high-throughput telomere length measurements, PCR-based assays were devel-oped which normalize TL to a single copy gene [2,22]. Although this method is fast, scalable [20], and the cost per sample is significantly lower compared to TRF, standardization is diffi-cult and results from different laboratories may not be directly compared [23,24]. Further-more, there is evidence that qPCR-based TL quantification may also be affected by DNA isolation methods [25].
Therefore, it was the aim of the current study to evaluate the effect of five different commer-cial DNA isolation kits (from Invitrogen, Qiagen, Macherey-Nagel, 5prime and Stratec/Invi-sorb) as well as one published isopropanol precipitation protocol (IPP) in combination with different preanalytical sample treatments, such as sample freezing and degradation, on telo-mere length. TL was analyzed with an established single-plex protocol, normalizing TL to the single copy reference gene36B4[22] and compared to a novel, multichrome multiplex assay allowing high throughput parallel analysis
Materials and Methods
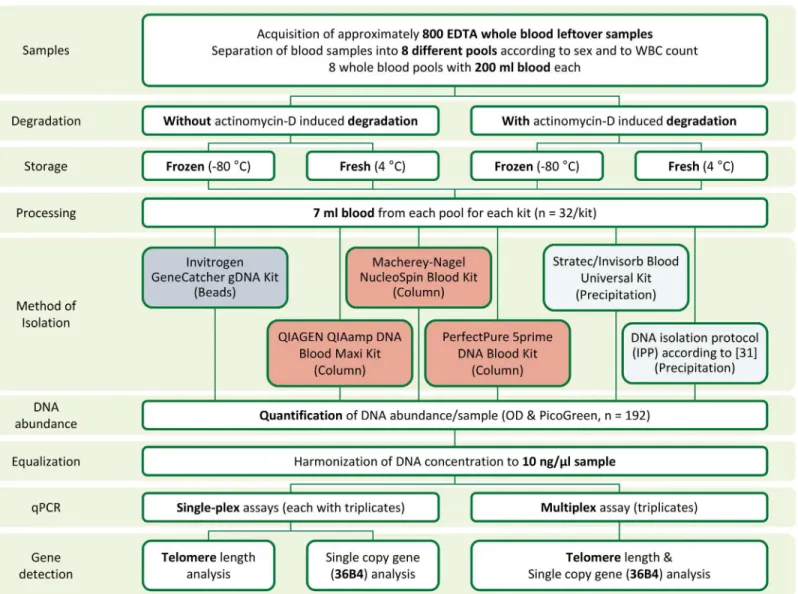
Study design and sample preparation
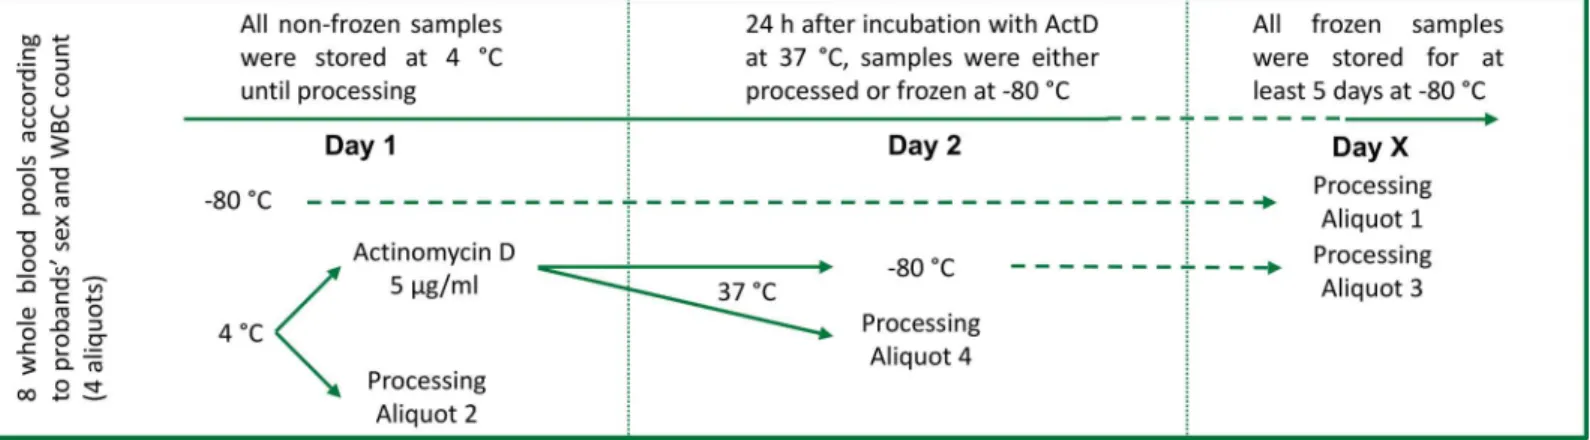
Anonymized left-over whole blood from routine laboratory analyses from 800 patients was pooled. Guidelines of the LMU ethics comittee do not require a specific ethics statement for this type of study. Samples were pooled at the day of collection according to patients’sex and white blood cell numbers classified in quartiles according to absolute leukocyte counts (4 male pools and 4 female pools;Fig 1,S1 Fig). No significant differences were found with respect to age of patients composing the different pools (data not shown). A cell count was performed in all pools using a Sysmex XT 2000i automated hematology analyzer and pools were kept in movement at 4°C until processing or freezing. Each pool was divided in 4 aliquots, of which two were incubated with 5μg/ml actinomycin D for 24 hours at 37°C to induce apoptosis [26,
DNA isolation
DNA isolation was performed using 7 ml aliquots of fresh or frozen whole blood (Fig 2; n = 192). Maxi DNA extraction kits from 5 different suppliers (GeneCatcher gDNA Kit from Invitrogen, QIAamp DNA Blood Maxi Kit from Qiagen, NucleoSpin Blood XL Kit from Macherey-Nagel, PerfectPure DNA Blood Kit from 5prime and Invisorb Blood Universal Kit from Stratec) as well as one published isopropanol precipitation protocol (IPP) [30,31] were used. DNA extraction kits used magnetic beads (Invitrogen), large (Marcherey-Nagel, Qiagen) and small (5prime) spin columns or precipitation (Stratec, IPP). DNA isolation was performed according to the manufacturers’instructions and DNA was eluted in 300μl (5prime kit),
600μl (IPP), 1000μl (Marchery-Nagel, Qiagen), 1400μl (Stratec) or 1500μl (Invitrogen).
After elution, DNA was quantified using OD measurements performed in duplicates for each sample on a NanoDrop ND-1000 spectrophotometer (Fisher Scientific) and was stored at -20°C until further use. An overview about the characteristics of the kits can be found in
Table 1. Before qPCRs, samples were diluted to a DNA concentration of 10 ng/μl and
quanti-fied with the Quant-iT PicoGreen dsDNA Assay Kit (Invitrogen) on a SpectraMax Paradigm Multi-Mode Microplate Detection Platform (Molecular Devices) before subsequent analyses. One sample was lost due to handling errors.
Quantitative PCR
For TL measurement, a qPCR-based method was adapted from the protocol used by Cawthon [22]. Quantification was performed using the SensiMix SYBR No-ROX Kit (Bioline) and Ct-values were calculated according to Pfaffl [32]. Data were normalized to the single copy gene (SCG)36B4, which was quantified using published primers [22,31] and fold changes were cal-culated accordingly. Characteristics of both assays are provided inTable 2. qPCRs were per-formed in 384-well plates on a ViiA7 (Life Technologies). A multiplex-assay was established for simultaneous measurement of TL and SCG in a single well. To this end, a probe with 5’ -LC610 fluorophore and 3’BHQ-2 labelling (Eurofins-MWG) was used to detect the single copy gene. The sequences for probe and primers are as following: Tel1b: 5’- CGG TTT GTT TGG GTT TGG GTT TGG GTT TGG GTT TGG GTT -3’; Tel2b: 5’- GGC TTG CCT TAC CCT TAC CCT TAC CCT TAC CCT TAC CCT -3’; 36B4 fwd: 5’- CAG CAA GTG GGA
Fig 1. Study design.Leftover EDTA-whole blood samples were pooled according to the patients’sex and leukocyte counts (n = 8). Each pool was divided in 4 aliquots (n = 32). The first aliquot (Aliquot 1; n = 8) was directly frozen. The second aliquot (Aliquot 2; n = 8) was processed directly without incubation (Day 1), while the rest was stimulated with actinomycin D (5μg/ml). After 24 hours (Day 2), the third aliquot (Aliquot 3; n = 8) was frozen, while the last aliquot
(Aliquot 4; n = 8) was processed. Before freezing, a white blood cell count was performed. Frozen aliquots (Aliquots 1 and 3) were processed within 5 to 14 days (Day X).
AGG TGT AAT CC -3’; 36B4 rev: 5’- CCC ATT CTA TCA TCA ACG GGT ACA A -3’; 36B4 probe: 5’- LC610—CGG ATT TCT TCA GCT TGT GCT TGT CTC CCT—BHQ2–3’. Due to the different light absorption and emission maxima from SYBR green I (495 nm and 520 nm, respectively) and LC610 (590 nm and 610 nm, respectively), telomeres and SCG were detected simultaneously without signal interferences when performing qPCR.
Statistics
Statistical analysis was done using GraphPad PRISM (Version 6.02, GraphPad Software) and Microsoft Excel (Version 2010). Normality of distribution was tested using the Kolmogorov-Smirnov test. Comparison of two groups was done using Mann-Whitney U test for non-nor-mally distributed data, Welch’s t-test or Student’s t-test for normally distributed data with unequal or equal variances, respectively. Bonferroni correction was applied for multiple testing.
Fig 2. Sample preparation and analysis procedure.For comparison of preanalytical conditions and DNA isolation kits, EDTA-whole blood aliquots (8 pools, each in 4 different conditions) were processed using 6 different procedures. DNA concentration was harmonized in all 192 samples to 10 ng/μl and
qPCR was performed with 1μl sample in a total reaction volume of 10μl. Each sample was analyzed using both a multiplex and a single-plex assay for
telomere length quantification.
DNA extraction efficiency was tested by using linear regression as provided in GraphPad PRISM. TheΔCt andΔΔCt method was calculated as described previously [32].
Results
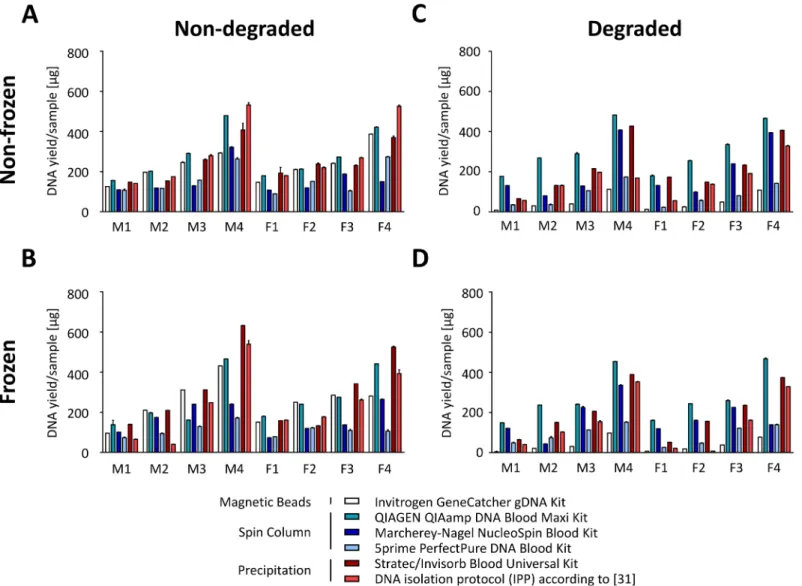
We first assessed the DNA yields obtained with the different isolation protocols. A total of 89– 532μg DNA were isolated with the different DNA isolation kits (Fig 3A). As expected, the Table 1. Specifications of DNA isolation methods and required laboratory equipment.
Invitrogen GeneCatche
gDNA Kit
Qiagen QIAamp DNA Blood Maxi
Kit Macherey-Nagel NucleoSpin Blood Kit 5prime PerfectPure DNA Blood Kit Stratec/ Invisorb Blood Universal Kit DNA isolation protocol (IPP) according to [31]
Method Beads Spin Column
Large
Spin Column large Spin Column small Precipitation Precipitation
Hands-on time 1.5 hours 1.5 hours 1.5 hours 1.5 hours 1.5 hours 2 hours
Incubation/ elution times
1 hour - - - 1 hour overnight incubation
Yield according to supplier
300μg 15–600μg 200–300μg 150–250μg up to 400μg up to 500μg
Suggested elution volume
1000–1500μl 1000μl 1000μl 300μl 1400μl 300–600μl
Expected DNA fragment size
larger than 50 kb 100 bp up to 50 kb, maximum at
30 kb
200 bp until approx. 50 kb
larger than 50 kb no data available no data available
Centrifuge (50 ml tubes)
- x x x x x
Centrifuge (1.5 ml tubes)
- - - x -
-Water bath (50 ml tubes)
x x x - - x
Thermomixer(50 ml tubes)
- - - - x x
Thermomixe (1.5 ml tubes)
- - X - -
-Additionally required equipment
Magnetic Rack for 50 ml tubes
- - - -
-“x”- required;“-“—not required.
doi:10.1371/journal.pone.0143889.t001
Table 2. Comparison of a published single-plex assays for quantification of TL and SCG and multiplex assay (adapted from [22,31]).
Single-plex assay according to [31] Multiplex assay Advantages of multiplex assay
Telomere analysis 25μl/reaction with 12.5μl Taq-Pol MM* 10μl/reaction with 5μl Taq-Pol MM* 80% reduction of Taq-Pol MM* Single Copy Gene
analysis
25μl/reaction with 12.5μl Taq-Pol MM* LC610-labelled probe added to TL assay
Identical input DNA, thus better standardization
Sample DNA required
30 ng DNA/reaction (2 assays x triplicate values = 180 ng DNA)
10 ng DNA (multiplex assay in triplicates = 30 ng DNA)
>80% less DNA required for parallel TL and SCG measurement
Throughput 32 samples on Rotorgene Q (Qiagen) in triplicates according to [31]
384well plate compatibility, 126 samples in triplicates
4x higher throughput
Time on thermal cycler
~ 80 minutes/reaction (2 reactions = 160 minutes)
~ 50 minutes >65% less time on thermal cycler
*MM- Taq-Polymerase Mastermix SensiMix SYBR No-ROX Kit (Bioline).
isolated DNA amount was proportional to the number of leukocytes in the respective DNA pools. Higher WBC counts, however, decreased the overall DNA extraction efficiency as shown inS2 Fig. Highest DNA amounts were extracted using the IPP (28% higher than aver-age) and the kit from Qiagen (22% higher than averaver-age) as well as the kit from Stratec (10% higher than average,Fig 3A). Overall, freezing did not lead to a statistically significant effect on DNA yield, except for the 5prime kit, where a significant 30% decrease in DNA recovery was detected (S2 Fig).
In contrast to freezing, sample degradation significantly impaired DNA recovery (Fig 3C). This effect was particularly pronounced for the Invitrogen kit using magnetic beads (DNA extraction decrease by 79%, p<10−4), but also noticeable when using the 5prime kit (decrease by 48%) and the IPP (decrease by 45%). Freezing in addition to degradation did not further decrease DNA extraction efficiency (overall 9% decrease compared to degraded, non-frozen samples; not significant,Fig 3D,S2 Fig).
Fig 3. Effect of freezing and degradation on DNA isolation efficiency.Amounts of DNA isolated from 7 ml whole blood aliquots from 8 pools (M/F; n = 4/ 4) depending on preanalytical conditions. Actinomycin D was used for apoptosis-induced sample degradation.(A)Non-frozen, non-degraded samples.(B)
Frozen, non-degraded samples.(C)Non-frozen, degraded samples.(D)frozen, degraded samples.
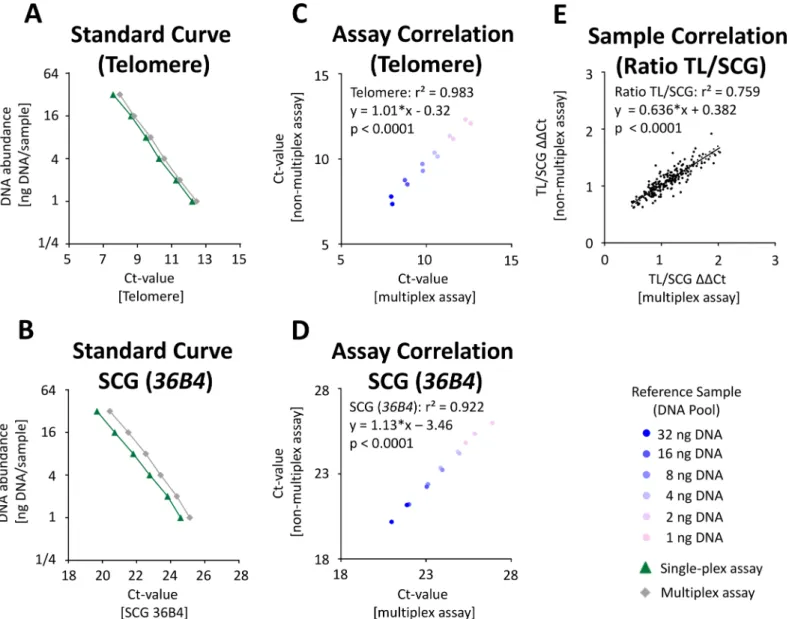
For TL measurement, an established method [22,31] was adapted as a multiplex assay as described in the material and methods section. To investigate the technical performance of the multiplex test, we generated a pool from all DNA samples (n = 192) that were previously isolated with the 6 different DNA isolation methods. Using this control pool in different con-centrations (1-32ng DNA per qPCR), we showed that the multiplex assay revealed a good lin-earity when compared to the analysis of TL and SCG36B4using single-plex assays (Fig 4A and 4B). qPCR efficiency was comparable between the multiplex and the single-plex assay (>95%)
and a high correlation of TL (r2= 0.983;Fig 4C) and SCG (r2= 0.922;Fig 4D) quantification was shown. Using all 192 DNA samples at a defined concentration (for details seeMaterials and Methods), a correlation of r2= 0.759 between the TL/SCG ratio of both assays was demonstrated (p<10−4,Fig 4E). Compared to the published assay [31], an 80% reduction of
Fig 4. Comparison of TL and SCG quantification using single-plex assays and a multiplex assay.For evaluation of telomeres, qPCRs were performed as described previously [22,31] with adjustments as described in Material and Methods. Dilutions of a control pool sample were used as standard curve. Standard curves for telomere(A)or single copy gene 36B4(B)qPCR assays using the single-plex (green) or multiplex (grey) assay. Correlation between the multiplex and the single-plex assays for TL(C)and SCG(D).(E)Correlation of TL/SCG ratio in 192 DNA samples.
Taq-Polymerase mastermix was achieved when using the multiplex protocol in the 384-well format (Table 2). Furthermore, the input DNA was reduced by>80% compared to the original
assay and the analysis time was reduced by>60% (Table 2).
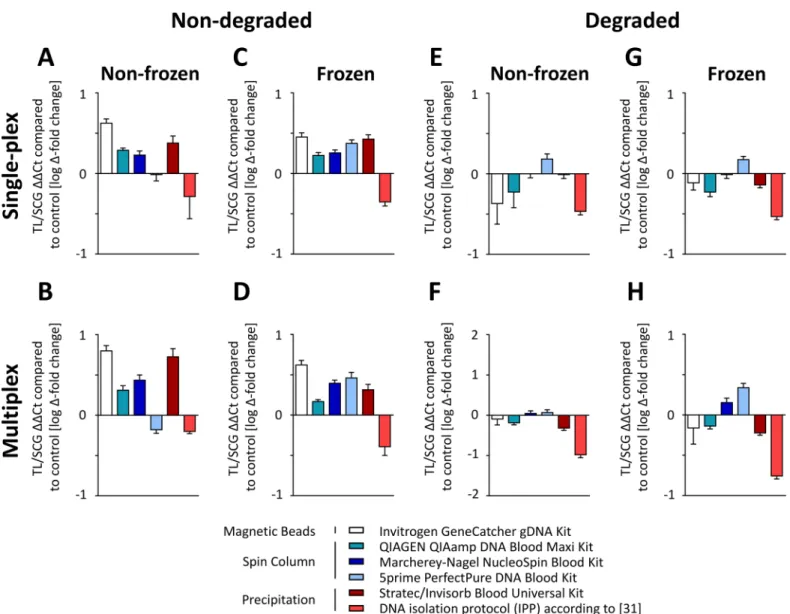
Next, we investigated the effects of DNA isolation procedures on TL and SCG quantifica-tion. To detect whether the single-plex and the multiplex assays performed equally, qPCR anal-yses were run with both assays (Fig 5). To this end, we analyzed the TL/SCG ratio in 192 DNA samples in relation to a pooled reference sample. As shown inFig 5A and 5B, different DNA isolation methods significantly affected the TL/SCG ratio already (S1 Table); in non-frozen, non-degraded samples, the strongest changes in TL were ranging from 1.65 to 0.88 when com-paring the Invitrogen kit to the IPP protocol. Notably, freezing had generally minor effects on TL quantification (<5%, not statistically significant;Fig 5C and 5DandS3 Fig). A detailed
comparison of TL quantification in frozen and non-frozen samples is provided inS3 Fig. The
Fig 5. Telomere length is depending of DNA isolation method and preanalytical conditions.192 samples were analyzed using the single-plex and the multiplex assay. Results from male and female pools (n = 8) per preanalytical condition (n = 4) and DNA isolation (n = 6) method were pooled for analysis of TL/SCG ratio in relation to a pooled reference sample. Absolute differences between both assays were approx. 9% (not significant).(A,B)Non-frozen, non-degraded samples.(C,D)Frozen, non-degraded samples.(E,F)Non-frozen, degraded samples.(G,H)frozen, degraded samples.
only kit that revealed significant differences in the TL analysis in frozen and non-frozen sam-ples was the 5prime PerfectPure DNA Blood Kit, which led to a 27% higher telomere abun-dance in frozen samples. To exclude handling errors as a source of this result, measurements were repeated and revealed comparable results (data not shown).
As shown inFig 5E–5H, sample degradation had a major impact on TL quantification with an average decrease of 22% compared to non-degraded samples (p<10−5;S4 Fig). This effect was especially pronounced when using the Invitrogen GeneCatcher gDNA Kit, where a lower TL quantification of 40% compared to non-degraded samples was observed. This effect was also strong but less pronounced for the other kits (34% for the Stratec/Invisorb Blood Universal Kit, 25% for the Qiagen QIAamp DNA Blood Maxi Kit, 17% for the IPP and 17% for the Macherey-Nagel NucleoSpin Blood XL Kit compared to non-degraded samples, respectively). The least differences between degraded and non-degraded material was found using the 5prime kit.
Discussion
In the current study, we systematically evaluated 6 DNA isolation procedures and preanalytical sample treatments such as freezing and apopotosis-induced degradation with respect to their effect on telomere length (TL) and SCG quantification using a high throughput multiplex assay. As major findings, we demonstrate that TL was significantly affected by different DNA isolation methods and that sample degradation reduced TL when using all but one kit. In con-trast, sample freezing at -80°C had only minor impacts on TL/SCG quantification with the exception of one DNA isolation method. Our results underscore the importance of standard-ized preanaytical and analytical procedures when determining TL in clinical and population based studies.
Our study is the largest comparison of DNA isolation methods with respect to TL quantifi-cation to date. Since we required 200 ml EDTA-whole blood to compare the effect of four dif-ferent preanalytical conditions (non-frozen non-degraded, frozen non-degraded, non-frozen degraded and frozen degraded) and six different DNA Maxi isolation kits (7 ml each) on TL quantification, we decided to use pools of anonymized left-over whole blood samples instead of samples from individual probands. A further advantage of pooling samples is that potential bias due to inter-individual biological variance is reduced and pooled samples have also been used by other groups to evaluate technical aspects of TL quantification [23].
does affect TL quantification. This is especially important, since the observed biological differ-ences between healthy and diseased patients may vary only in a low percent range [37–41].
In contrast, freezing did not have a significant effect on TL measurement with the exception of the 5prime kit. This is in line with results from Zanet et al., who reported no significant changes in TL between frozen and non-frozen samples. Since this study was only performed using only the QIAcube and QIAamp DNA Mini Kit from Qiagen [42], our study extends this important notion to other DNA isolation kits with the caveat that exceptions might exist.
Especially in large study settings, robust and high throughput methods are warranted for TL analysis. Since qPCR-based methods for TL quantification are widely established because of the analysis speed, scalability and costs-per-sample [2,43], we have focused on the evaluation of different qPCR methods and have not compared qPCR to Southern blotting or STELA results. We have adapted the method of quantifying telomere length originally published by Cawthon [22,31] and have established a cost- and time-effective multiplex assay, which can be run in the 384-well format using as little as 10 ng of DNA as opposed to 60 ng [31]. In contrast to a study by Eisenberg et al. [43], we detected no significant changes of TL quantification with respect to the position on the PCR plate speaking in favor of the robustness of the multiplex assay. Additionally, pipetting and other handling errors might also be diminished through the multiplex assay allowing greater standardization and reliability. Since we did not investigate TL using other methods, such as Southern blotting or STELA, it remains to be determined whether results of the current study apply for TL quantification using these techniques, as well.
In the work by Martin-Ruiz et al, the reproducibility of TL quantification in 10 different lab-oratories was investigated with 3 different techniques (Southern blotting, STELA, qPCR) using 10 human DNA samples and pools [23]. As a main conclusion, the authors suggest to establish a common set of TL standards to improve comparability of TL quantification between meth-ods. Currently, there is an ongoing discussion about the comparability and reproducibility of qPCR, STELA or Southern blotting for TL quantification [23,44–47]. Whereas the focus of that work was on comparison of different methods for TL quantification, the primary goal of our study was to compare the effects of different DNA isolation protocols and preanalytical conditions. Taken together, previous work and results from our study highlight the need for standardization of the complete process, starting from blood collection, sample storage and DNA isolation, up to TL measurement to obtain reliable TL results, especially in large multi-center study settings.
Supporting Information
S1 Fig. Effect of actinomycin D on white blood cell counts.White blood cell (WBC) counts were measured in samples with and without induction of apoptosis-mediated cell degradation with actinomycin D (ActD; 5μg/ml) for 24 hours at 37°C. Degradation led to an average 10%
WBC decrease.(A)The absolute number of leukocytes measured in the sample with or without actinomycin D treatment is shown.(B)The relative leukocyte count changes after actinomycin D treatment are presented.
(PDF)
samples). The additional effect of freezing(B, D)was minor. (PDF)
S3 Fig. Effects of freezing on TL quantification.When comparing TL of frozen with non-fro-zen samples, differences were found to be minor (overall approx. 3%) in both the single-plex assay(A, C)and the multiplex assay(B, D)and irrespective of the analysis of non-degraded (A, B)or degraded(C, D)samples. The sole exception was the 5prime PerfectPure DNA Blood Kit (27% longer TL in frozen samples). Data are given as fold change of the ratio frozen to non-frozen samples compared to a reference sample.
(PDF)
S4 Fig. Effects of degradation on TL quantification.When comparing degraded to non-degraded samples, degradation significantly affected TL measurements (p<10−5) in both the single-plex assay(A, C)and the multiplex assay(B, D)and irrespective of the analysis of non-frozen(A, B)or frozen(C, D)samples. These effects were strongest for the Invitrogen Gene-Catcher gDNA Kit and the Stratec/Invisorb Blood Universal Kit (40% and 34% decrease, respectively). Data are shown as fold change of the ratio degraded to non-degraded samples compared to a reference sample.
(PDF)
S1 Table. Statistically significant differences between TL quantification performed by dif-ferent DNA extraction kits.Corresponding toFig 5, levels of significance were calculated for different DNA isolation methods. Bonferroni-correction was applied to correct for multiple testing, thus a p-value of p<0.00042 was considered to be statistically significant.
(XLSX)
Acknowledgments
The authors thank the companies (Invitrogen, Qiagen, Marcherey-Nagel, 5prime, Stratec) for their support and kind supply of reagents used in this study.
Author Contributions
Conceived and designed the experiments: AT LMH. Performed the experiments: AT. Analyzed the data: AT LMH. Contributed reagents/materials/analysis tools: LMH DT. Wrote the paper: AT DT LMH.
References
1. Armanios M. Telomeres and age-related disease: how telomere biology informs clinical paradigms. The Journal of clinical investigation. 2013; 123(3):996–1002. Epub 2013/03/05. doi:10.1172/JCI66370
PMID:23454763; PubMed Central PMCID: PMC3673231.
2. Aubert G, Hills M, Lansdorp PM. Telomere length measurement-caveats and a critical assessment of the available technologies and tools. Mutation research. 2012; 730(1–2):59–67. Epub 2011/06/15. doi:
10.1016/j.mrfmmm.2011.04.003PMID:21663926; PubMed Central PMCID: PMC3460641.
3. Lin KW, Yan J. The telomere length dynamic and methods of its assessment. Journal of cellular and molecular medicine. 2005; 9(4):977–89. Epub 2005/12/21. PMID:16364206.
4. Moyzis RK, Buckingham JM, Cram LS, Dani M, Deaven LL, Jones MD, et al. A highly conserved repeti-tive DNA sequence, (TTAGGG)n, present at the telomeres of human chromosomes. Proceedings of the National Academy of Sciences of the United States of America. 1988; 85(18):6622–6. Epub 1988/ 09/01. PMID:3413114; PubMed Central PMCID: PMC282029.
6. Hayflick L, Moorhead PS. The serial cultivation of human diploid cell strains. Experimental cell research. 1961; 25:585–621. Epub 1961/12/01. PMID:13905658.
7. Harley CB, Futcher AB, Greider CW. Telomeres shorten during ageing of human fibroblasts. Nature. 1990; 345(6274):458–60. Epub 1990/05/31. doi:10.1038/345458a0PMID:2342578.
8. Valdes AM, Andrew T, Gardner JP, Kimura M, Oelsner E, Cherkas LF, et al. Obesity, cigarette smoking, and telomere length in women. Lancet. 2005; 366(9486):662–4. Epub 2005/08/23. doi:10.1016/ S0140-6736(05)66630-5PMID:16112303.
9. Armanios M, Price C. Telomeres and disease: an overview. Mutation research. 2012; 730(1–2):1–2. Epub 2011/11/22. doi:10.1016/j.mrfmmm.2011.11.005PMID:22100639.
10. Chang S, Khoo CM, Naylor ML, Maser RS, DePinho RA. Telomere-based crisis: functional differences between telomerase activation and ALT in tumor progression. Genes & development. 2003; 17(1):88–
100. Epub 2003/01/07. doi:10.1101/gad.1029903PMID:12514102; PubMed Central PMCID: PMC195968.
11. McGrath M, Wong JY, Michaud D, Hunter DJ, De Vivo I. Telomere length, cigarette smoking, and blad-der cancer risk in men and women. Cancer epidemiology, biomarkers & prevention: a publication of the American Association for Cancer Research, cosponsored by the American Society of Preventive Oncology. 2007; 16(4):815–9. Epub 2007/04/10. doi:10.1158/1055-9965.EPI-06-0961PMID:
17416776.
12. Armanios M. Telomerase and idiopathic pulmonary fibrosis. Mutation research. 2012; 730(1–2):52–8. Epub 2011/11/15. doi:10.1016/j.mrfmmm.2011.10.013PMID:22079513; PubMed Central PMCID: PMC3292861.
13. Armanios M, Alder JK, Parry EM, Karim B, Strong MA, Greider CW. Short telomeres are sufficient to cause the degenerative defects associated with aging. American journal of human genetics. 2009; 85 (6):823–32. Epub 2009/12/01. doi:10.1016/j.ajhg.2009.10.028PMID:19944403; PubMed Central PMCID: PMC2790562.
14. Kirwan M, Vulliamy T, Marrone A, Walne AJ, Beswick R, Hillmen P, et al. Defining the pathogenic role of telomerase mutations in myelodysplastic syndrome and acute myeloid leukemia. Human mutation. 2009; 30(11):1567–73. Epub 2009/09/18. doi:10.1002/humu.21115PMID:19760749.
15. Calado RT, Regal JA, Hills M, Yewdell WT, Dalmazzo LF, Zago MA, et al. Constitutional hypomorphic telomerase mutations in patients with acute myeloid leukemia. Proceedings of the National Academy of Sciences of the United States of America. 2009; 106(4):1187–92. Epub 2009/01/17. doi:10.1073/pnas. 0807057106PMID:19147845; PubMed Central PMCID: PMC2627806.
16. Yamaguchi H, Baerlocher GM, Lansdorp PM, Chanock SJ, Nunez O, Sloand E, et al. Mutations of the human telomerase RNA gene (TERC) in aplastic anemia and myelodysplastic syndrome. Blood. 2003; 102(3):916–8. Epub 2003/04/05. doi:10.1182/blood-2003-01-0335PMID:12676774.
17. Southern EM. Measurement of DNA length by gel electrophoresis. Analytical biochemistry. 1979; 100 (2):319–23. Epub 1979/12/01. PMID:525781.
18. Baird DM, Rowson J, Wynford-Thomas D, Kipling D. Extensive allelic variation and ultrashort telomeres in senescent human cells. Nature genetics. 2003; 33(2):203–7. Epub 2003/01/23. doi:10.1038/ng1084
PMID:12539050.
19. Martens UM, Zijlmans JM, Poon SS, Dragowska W, Yui J, Chavez EA, et al. Short telomeres on human chromosome 17p. Nature genetics. 1998; 18(1):76–80. Epub 1998/01/13. doi:10.1038/ng0198-018
PMID:9425906.
20. Vera E, Blasco MA. Beyond average: potential for measurement of short telomeres. Aging. 2012; 4 (6):379–92. Epub 2012/06/12. PMID:22683684; PubMed Central PMCID: PMC3409675.
21. Poon SS, Lansdorp PM. Measurements of telomere length on individual chromosomes by image cytometry. Methods in cell biology. 2001; 64:69–96. Epub 2000/11/09. PMID:11070833.
22. Cawthon RM. Telomere measurement by quantitative PCR. Nucleic acids research. 2002; 30(10):e47. Epub 2002/05/10. PMID:12000852; PubMed Central PMCID: PMC115301.
23. Martin-Ruiz CM, Baird D, Roger L, Boukamp P, Krunic D, Cawthon R, et al. Reproducibility of telomere length assessment: an international collaborative study. International journal of epidemiology. 2014. Epub 2014/09/23. doi:10.1093/ije/dyu191PMID:25239152.
24. Cawthon RM. Telomere length measurement by a novel monochrome multiplex quantitative PCR method. Nucleic acids research. 2009; 37(3):e21. Epub 2009/01/09. doi:10.1093/nar/gkn1027PMID:
19129229; PubMed Central PMCID: PMC2647324.
the American Society of Preventive Oncology. 2013; 22(11):2047–54. Epub 2013/09/11. doi:10.1158/ 1055-9965.EPI-13-0409PMID:24019396; PubMed Central PMCID: PMC3827976.
26. Nagami K, Kawashima Y, Kuno H, Kemi M, Matsumoto H. In vitro cytotoxicity assay to screen com-pounds for apoptosis-inducing potential on lymphocytes and neutrophils. The Journal of toxicological sciences. 2002; 27(3):191–203. Epub 2002/09/20. PMID:12238143.
27. Whyte MK, Savill J, Meagher LC, Lee A, Haslett C. Coupling of neutrophil apoptosis to recognition by macrophages: coordinated acceleration by protein synthesis inhibitors. Journal of leukocyte biology. 1997; 62(2):195–202. Epub 1997/08/01. PMID:9261333.
28. Aviv A, Hunt SC, Lin J, Cao X, Kimura M, Blackburn E. Impartial comparative analysis of measurement of leukocyte telomere length/DNA content by Southern blots and qPCR. Nucleic acids research. 2011; 39(20):e134. doi:10.1093/nar/gkr634PMID:21824912; PubMed Central PMCID: PMC3203599.
29. Zhang B, Qian D, Ma HH, Jin R, Yang PX, Cai MY, et al. Anthracyclines disrupt telomere maintenance by telomerase through inducing PinX1 ubiquitination and degradation. Oncogene. 2012; 31(1):1–12. Epub 2011/06/07. doi:10.1038/onc.2011.214PMID:21643006.
30. Miller SA, Dykes DD, Polesky HF. A simple salting out procedure for extracting DNA from human nucle-ated cells. Nucleic acids research. 1988; 16(3):1215. Epub 1988/02/11. PMID:3344216; PubMed Cen-tral PMCID: PMC334765.
31. Codd V, Nelson CP, Albrecht E, Mangino M, Deelen J, Buxton JL, et al. Identification of seven loci affecting mean telomere length and their association with disease. Nature genetics. 2013; 45(4):422–7, 7e1-2. Epub 2013/03/29. doi:10.1038/ng.2528PMID:23535734; PubMed Central PMCID:
PMC4006270.
32. Pfaffl MW. A new mathematical model for relative quantification in real-time RT-PCR. Nucleic acids research. 2001; 29(9):e45. Epub 2001/05/09. PMID:11328886; PubMed Central PMCID: PMC55695.
33. Koppelstaetter C, Jennings P, Hochegger K, Perco P, Ischia R, Karkoszka H, et al. Effect of tissue fixa-tives on telomere length determination by quantitative PCR. Mechanisms of ageing and development. 2005; 126(12):1331–3. Epub 2005/09/27. doi:10.1016/j.mad.2005.08.003PMID:16182339.
34. Ghatak S, Muthukumaran RB, Nachimuthu SK. A simple method of genomic DNA extraction from human samples for PCR-RFLP analysis. Journal of biomolecular techniques: JBT. 2013; 24(4):224–
31. Epub 2013/12/03. doi:10.7171/jbt.13-2404-001PMID:24294115; PubMed Central PMCID: PMC3792701.
35. Rajatileka S, Luyt K, El-Bokle M, Williams M, Kemp H, Molnar E, et al. Isolation of human genomic DNA for genetic analysis from premature neonates: a comparison between newborn dried blood spots, whole blood and umbilical cord tissue. BMC genetics. 2013; 14:105. Epub 2013/10/31. doi:10.1186/ 1471-2156-14-105PMID:24168095; PubMed Central PMCID: PMC3817355.
36. Anchordoquy TJ, Molina MC. Preservation of DNA. Cell Preserv Technol. 2007; 5(4):180–8. doi:10. 1089/cpt.2007.0511PMID:ISI:000252604300003.
37. Valls-Bautista C, Pinol-Felis C, Rene-Espinet JM, Buenestado-Garcia J, Vinas-Salas J. In colon can-cer, normal colon tissue and blood cells have altered telomere lengths. J Surg Oncol. 2015; 111 (7):899–904. Epub 2015/04/16. doi:10.1002/jso.23894PMID:25873347.
38. Lin S, Huo X, Zhang Q, Fan X, Du L, Xu X, et al. Short placental telomere was associated with cadmium pollution in an electronic waste recycling town in China. PloS one. 2013; 8(4):e60815. Epub 2013/04/ 09. doi:10.1371/journal.pone.0060815PMID:23565277; PubMed Central PMCID: PMC3614985.
39. Svenson U, Nordfjall K, Stegmayr B, Manjer J, Nilsson P, Tavelin B, et al. Breast cancer survival is associated with telomere length in peripheral blood cells. Cancer research. 2008; 68(10):3618–23. Epub 2008/05/17. doi:10.1158/0008-5472.CAN-07-6497PMID:18483243.
40. Gertler R, Doll D, Maak M, Feith M, Rosenberg R. Telomere length and telomerase subunits as diag-nostic and progdiag-nostic biomarkers in Barrett carcinoma. Cancer. 2008; 112(10):2173–80. Epub 2008/ 03/19. doi:10.1002/cncr.23419PMID:18348304.
41. Mu Y, Zhang Q, Mei L, Liu X, Yang W, Yu J. Telomere shortening occurs early during gastrocarcinogen-esis. Medical oncology. 2012; 29(2):893–8. Epub 2011/03/02. doi:10.1007/s12032-011-9866-3PMID:
21359861.
42. Zanet DL, Saberi S, Oliveira L, Sattha B, Gadawski I, Cote HC. Blood and dried blood spot telomere length measurement by qPCR: assay considerations. PloS one. 2013; 8(2):e57787. Epub 2013/03/02. doi:10.1371/journal.pone.0057787PMID:23451268; PubMed Central PMCID: PMC3581490.
43. Eisenberg DT, Kuzawa CW, Hayes MG. Improving qPCR telomere length assays: Controlling for well position effects increases statistical power. Am J Hum Biol. 2015. Epub 2015/03/12. doi:10.1002/ajhb. 22690PMID:25757675.
telomere length measurements. International journal of epidemiology. 2015. doi:10.1093/ije/dyv169
PMID:26403813.
45. Martin-Ruiz CM, Baird D, Roger L, Boukamp P, Krunic D, Cawthon R, et al. Reproducibility of telomere length assessment: Authors' Response to Damjan Krstajic and Ljubomir Buturovic. International journal of epidemiology. 2015. doi:10.1093/ije/dyv170PMID:26403811.
46. Verhulst S, Susser E, Factor-Litvak PR, Simons MJ, Benetos A, Steenstrup T, et al. Commentary: The reliability of telomere length measurements. International journal of epidemiology. 2015. doi:10.1093/ ije/dyv166PMID:26403812.
![Table 2. Comparison of a published single-plex assays for quantification of TL and SCG and multiplex assay (adapted from [22, 31]).](https://thumb-eu.123doks.com/thumbv2/123dok_br/18426932.361667/5.918.57.863.834.1015/table-comparison-published-single-assays-quantification-multiplex-adapted.webp)