c
European Geosciences Union 2002
and Earth
System Sciences
Calibration and application of the MN2D dynamics model to the
avalanches of Las Le ˜nas (Argentina)
M. Naaim1, G. Furdada2, and H. Mart´ınez3
1Division ETNA, CEMAGREF, 2 Rue de la papeterie. BP 76, F-38402 Saint-Martin-d’H`eres cedex, France 2Dept. Geodin`amica i Geof´ısica, Universitat de Barcelona, Mart´ı i Franqu`es s/n, E-08028 Barcelona, Spain 3IDEPRN, Universidad Nacional de Cuyo – CONICET, Centro Universitario, C.C. 405, 5500 Mendoza, Argentina Received: 20 September 2001 – Revised: 13 March 2002 – Accepted: 15 March 2002
Abstract. During the winters of 1999 and 2000 large avalanches occurred in the ski resort of Las Le˜nas (Los Andes, Mendoza, Argentina). On 8 September 1999 an avalanche of new, dry snow ran over a path with a 1000 m vertical drop. On 30 June and on 1 July 2000 five avalanches of similar vertical drop, which start with new snow, entrained very wet snow during their descent, and evolved into dense snow avalanches.
To use the MN2D dynamics model correctly, calibration of model parameters is necessary. Also, no previous works with the use of dynamics models exist in South America. The events used to calibrate the model occurred during the win-ters of 1999 and 2000 and are a good sample of the kind of avalanches which can occur in this area of the Andes range.
By considering the slope morphology and topography, the snow and meteorological conditions and the results of the model simulations, it was estimated that these avalanches were not extreme events with a return period greater than one hundred years. This implies that, in natural conditions, bigger, extreme avalanches could happen.
In this work, the MN2D dynamics model is calibrated with two different avalanches of the same magnitude: dry and wet. The importance of the topographic data in the simulation is evaluated. It is concluded that MN2D dynamics model can be used to simulate dry extreme avalanches in Argentinean Andes but not to simulate extreme wet avalanches, which are much more sensitive to the topography.
1 Introduction
Snow avalanche dynamics models had never been used in Argentina to simulate avalanches.
During the winters of 1999 and 2000 large avalanches oc-curred in the ski resort of Las Le˜nas (Los Andes, Mendoza, Argentina). On 8 September 1999 an avalanche of new, dry
Correspondence to:M. Naaim
snow ran over on a path with a 1000 m vertical drop. On 30 June and on 1 July 2000 five avalanches of similar ver-tical drop, which start with new snow and entrained very wet snow during their descent, evolved into extremely dense avalanches. One of them started at the same location as the big dry avalanche in the previous 1999 episode and followed a similar path in the upper track zone (Furdada et al., 2000). The two big avalanches that started at the same release area are treated in this study with the following objectives: (1) Try to calibrate the MN2D dynamics model with two different avalanches of the same magnitude: dry and wet; (2) Evalu-ate the importance of the topographic data in the simulation; (3) Evaluate whether the avalanches of 1999 and 2000 were extreme avalanche events; and (4) Evaluate whether MN2D dynamics model can be used to simulate extreme avalanches in Argentinean Andes.
2 The site and the avalanches
Las Le˜nas ski resort is located in the Argentinean Andes, De-partment of Malarg¨ue, Province of Mendoza. The area where the resort is located has a minimum altitude of 2200 m a.s.l. The highest altitude corresponds to Cerro F´osiles (3430 m a.s.l.), at the top of a nearly flat plateau of about 1 km wide and more than 2 km length. This surface, exposed to the winds, dominates an East oriented slope with a vertical drop greater than 1000 m. The top of the rocky slope is chan-nelled, with well marked incisions that become progressively wide. The run-out zone is an open, unchanelled slope. Also, the natural channels have been modified to improve the ski runs. The avalanches considered in this work overran this slope.
Cerro F´osiles and the flat plateau becomes West (C. Torres, chief of pistes, personal communication). These winds gen-erate considerable snow accumulations at the top of the East facing slope.
The two large avalanches treated in this work occurred on 8 September 1999 (dry avalanche) and on 30 June 2000 (wet avalanche). Both occurred after some days of snow storms. The meteorological conditions and the main characteristics of snow cover and of both avalanches are sumarised below.
2.1 Avalanche conditions on 8 September 1999
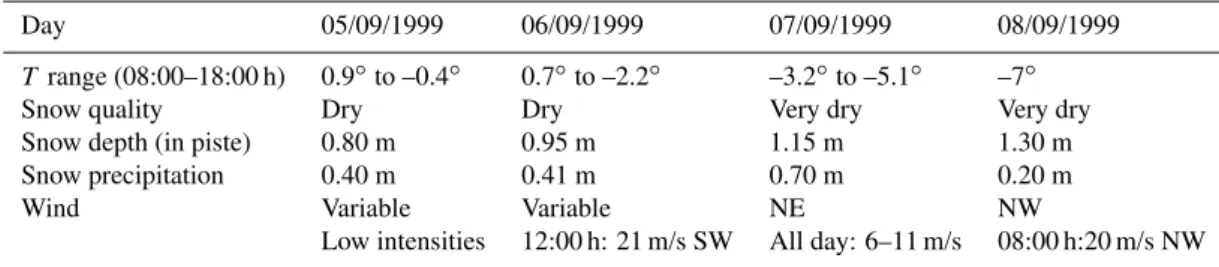
The avalanche occurred at 08:00 h in the morning, after two episodes of heavy snowfalls. The first was from 29 Au-gust to 1 September. It was followed by three days of vari-able weather and daily positive temperatures at 2250 m a.s.l. Temperatures did not descend below 0◦C during the third to fourth night, so the snow cover stabilised. The second snow-fall, which caused the avalanche, was from 5 to 8 September (Tables 1 and 2).
The snow of this episode was very dry and light (com. pers. of C. Torres, chief of pistes of Las Le˜nas and J. A. Ver-gara, Dept. of Geophysics, University of Chile: data from Lagunitas, 2670 m a.s.l., Central Chilean Andes. The obser-vations are coherent due to the regional scale of the snow-storm). In Table 1 a summary of significant snow and mete-orological conditions measured in Las Le˜nas at 2250 m a.s.l. is shown. Absolute maximum and minimum daily temper-atures were not recorded. The snow depth measured in one slope gives an idea of the magnitude of the snowfall, though the snow was mechanically compressed and the measure is not representative of the total snow during the episode. It has to be pointed out that the decrease of temperature on 7 September and the morning of 8 September prevented the snow cover from stabilizing. The intense NW winds on the morning of 8 September (which, due to local topographic ef-fects, had to be even more intense and from the West at the top of the East facing slope) also prevented the snow cover from stabilizing.
The great quantity of snow which fell at different altitudes during this episode is shown in Table 2. Neither settlement nor wind drift is taken into account in the total amount of measured snow.
The snow profile of Fig. 1 shows that 18 h before the avalanche, at 2415 m a.s.l. there was about 1 m of dry and very light snow. The temperature profile shows the gradi-ent, which increased the next day (Table 1), most probably maintaining the quality of the snow and minimising the set-tlement.
All these data support the conclusion that the dry snow-fall and the intense wind transport produced snowdrifts in the channels at the top of the considered slope. At the same time, the whole slope was covered by a very light snow cover which could be easily eroded and entrained by the avalanche.
120 100 80 60 40 20 Resistence (kgf)
300
270
240
210
180
150
120
90
60
30
+ + 1.5 1 1 100
1.0 2 2 180
1.0 3 2 260
0.5 3 2 220 / /
/
Orientation: S Slope: 25º emperature : -03.0ºC Weather: Snowing Air t
H
cm
F1 F2 Dm
mm
d U ρ
kg/m3
Temperature (ºC)
-24 -20 -16 -12 -8 -4
Fig. 1. 7 September 1999: Las Le˜nas snow profile (2415 m a.s.l.) at 12:00 h. H (cm) is the height of the snow above the ground in cm; F1 F2, form of the snow grains, the symbols are in accor-dance with international classification standards; Dm, diameter of the snow grains; d, hardness of the snow layer (qualitative mea-sure); U, water content in the snow layer (qualitative meamea-sure);ρ, density of the snow layer.
2.2 Avalanche conditions on 30 June 2000
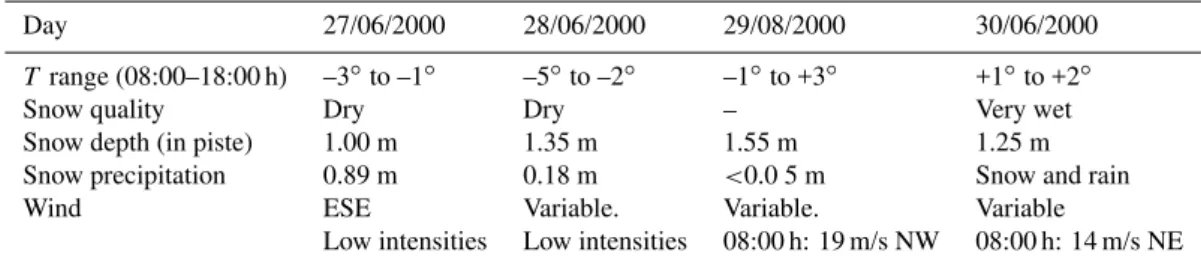
The avalanche occurred at 19:00 h, after 17 days of snow-storms and strong winds (C. Torres and G. Chiguay, com. pers.). The last episode began on 27 June and finished on 30 June (Tables 3 and 4). In Table 3, a summary of sig-nificant snow and meteorological conditions measured at 2250 m a.s.l. is shown. Absolute maximum and minimum daily temperatures were not recorded. The snow depth mea-sured at a location gives an idea of the snow settlement and melting that began on 29 June as a result of the rain and positive temperatures. However, the snow was mechanically compressed and the measure is not representative of the nat-ural snow cover.
Table 1.Snow and meteorological conditions(1)(2250 m a.s.l.)
Day 05/09/1999 06/09/1999 07/09/1999 08/09/1999
T range (08:00–18:00 h) 0.9◦to –0.4◦ 0.7◦to –2.2◦ –3.2◦to –5.1◦ –7◦
Snow quality Dry Dry Very dry Very dry
Snow depth (in piste) 0.80 m 0.95 m 1.15 m 1.30 m
Snow precipitation 0.40 m 0.41 m 0.70 m 0.20 m
Wind Variable Variable NE NW
Low intensities 12:00 h: 21 m/s SW All day: 6–11 m/s 08:00 h:20 m/s NW
(1)Temperatures were measured at 08:00 h, 10:00 h, 12:00 h, 15:00 h, and 18:00 h. Temperature ranges correspond to the maximum and
minimum of these 5 measures. Snow precipitation corresponds to the total snow fallen at the end of the day (18:00 h), except for 8 September, that corresponds to 08:00 h.
Table 2.Daily snow precipitation accumulated until 18:00 h(2)(m)
Day (Sept. 1999) 3 4 5 6 7 8 total
Base (2250 m a.s.l.) 0 0 0.40 0.41 0.70 0.20 1.71
Bacus (2600 m a.s.l.) 0 0 0.75 0.53 0.84 0.30 2.42
Bora Bora (3400 m a.s.l.) 0 0 0.90 0.64 0.90 0.38 2.82 Minerva B. (2290 m a.s.l.) 0 0 0.60 0.37 0.65 0.20 1.82
(2)Data of 8 September corresponds to 08:00 h.
snow cover below 2600 m a.s.l. was saturated with water (G. Chiguay, com. pers.) and, in consequence, presented a very low cohesion and was easily entrained by the avalanche. 2.3 The avalanches
All the previous data, the indications of the ski resort person-nel, the observed damages after the avalanches and expert criteria were used to define the avalanches (Figs. 2 and 3). Settlement, according to the different meteorological condi-tions, wind drift and slope angle were considered to estimate snow fracture heights for both avalanches.
The avalanche on 8 September 1999 presented the follow-ing characteristics:
– It was a dry avalanche; snow entrainment increased the mass of the avalanche considered.
– The avalanche developed two flowing “tongues” and an important powder part.
– The estimated fresh snow accumulation at 2400 m a.s.l. was of about 1.10 m.
– The estimated avalanche snow height fracture (at 3250 m a.s.l.) was about 1.50 m.
– The snow density at 2400 m a.s.l. was the following: 0.40 m of 180 kg/m3plus 0.70 m of 100 kg/m3. – The estimated average snow density at fracture was
100 kg/m3.
– The estimated average snow depth that could be en-trained, (approx. from 3000 m a.s.l. to 2300 m a.s.l.) was about 1 m of snow with a density of 100 kg/m3. The avalanche on 30 June 2000 presented the following char-acteristics:
– The isotherm of 0◦C was at 2600 m a.s.l. during all the day. Below this altitude it rained the entire day. – The estimated avalanche snow height fracture (at
3250 m a.s.l.) was approximately 1.30 m to 1.50 m. – The estimated average snow density at fracture was
be-tween 150 and 180 kg/m3.
– The avalanche developed a powder part at the begin-ning (2850 m a.s.l.), above the saturated snow limit of 2600 m a.s.l.
– The avalanche reached very wet snow at 2600 m a.s.l., entrained very wet snow and changed to a very wet avalanche. It developed two very wet “tongues” that adapted very well to the topography.
– The estimated average snow depth that could be en-trained from 2600 m a.s.l. to lower altitudes was of about 0.80–1.00 m.
– The estimated density of the very wet snow entrained below 2600 m a.s.l. was greater than 450 kg/m3. The damages produced by both avalanches are indicated in Figs. 2 and 3.
3 Calibration of the MN2D model
3.1 The model
Table 3.Snow and meteorological conditions(3)( 2250 m a.s.l.)
Day 27/06/2000 28/06/2000 29/08/2000 30/06/2000
T range (08:00–18:00 h) –3◦to –1◦ –5◦to –2◦ –1◦to +3◦ +1◦to +2◦
Snow quality Dry Dry – Very wet
Snow depth (in piste) 1.00 m 1.35 m 1.55 m 1.25 m
Snow precipitation 0.89 m 0.18 m <0.0 5 m Snow and rain
Wind ESE Variable. Variable. Variable
Low intensities Low intensities 08:00 h: 19 m/s NW 08:00 h: 14 m/s NE
(3)Temperatures were measured at 08:00 h, 10:00 h, 12:00 h, 15:00 h, and 18:00 h. Temperature ranges correspond to the maximum and
minimum of these 5 measures. Snow precipitation corresponds to the total snow fallen at the end of the day (18:00 h).
Table 4.Daily snow precipitation accumulated until 18:00 h(4)(m)
Day (June 2000) 25 26 27 28 29 30 total
Base (2250 m a.s.l.) 0.10 0 0.89 0.18 – – >1.17
Bacus (2600 m a.s.l.) 0.60 0 1.00 0.25 – – >1.85
Bora Bora (3400 m a.s.l.) 0.60 0 1.00 0.35 – – >1.95 Minerva B. (2290 m a.s.l.) 0.35 0 0.90 0.22 – – >1.47
(4)The lines (–) mean that no data were taken because of the bad
weather.
based upon the shallow water equations. In Naaim and An-cey’s model, the following general expression for the friction term is adopted:
τ =τ0+ρdghcosθtanϕ+a||ud|| +b||ud||2. (1)
With this general approach, several kinds of rheologi-cal behaviour can be readily incorporated. For example, a Bingham fluid (parametersτ0 anda), a granular fluid with Coulomb-type friction (bed friction angleϕ), or a VF (pa-rametersϕandb) can all be expressed using this approach. Substituting (1) into the equations for the conservation of mass and momentum yields:
∂h ∂t +
∂hu ∂x +
∂hv
∂y =0 (2a)
∂ ∂t
hu
hv
+ ∂
∂x
hu2
huv
+ ∂
∂y
huv
hv2
+
∂
x ∂y
1
2kg cosθ·h2
= −gh
cosθx cosθy
− 1
||ud||
u
v
τ
ρd (2b)
wherehis flow depthud =(u, v)t the dense flow velocity, θx andθy are the terrain slope angles in thex andy direc-tions, andkthe active-passive pressure coefficient.
The above system of equations is solved using a finite ele-ment method on a mesh consisting of quadrilateral eleele-ments placed a digitised terrain model. The elevation of the nodes of this irregular mesh is determined and the mean slope and
orientation of each element are computed. The numerical flux through each edge is then determined using a simplified Riemann solver (Naaim, 1991).
3.2 DTM used
To apply the MN2D model to Las Le˜nas avalanche paths a digital terrain model (DTM) was generated. The original to-pographic map (scale 1:5000; distance between contour lines of 10 m; made by Ecosign: Mountain Resort Planners Ltd., in 1992) was digitised. Contour lines were codified (alti-tude was assigned to each line). To obtain the best DTM, ArcInfo TINs (Triangulated Irregular Network models) were generated. Talwegs and dicks were used as breaklines (which define edges of triangles and force the DTM to maintain as much as possible the irregularities of the relief). Some DTMs were generated with different point simplifications along the contour lines in order to find the distance between points that create the minimum artifacts in the TIN DTM.
The best resulting TIN was transformed to an ArcInfo Lat-tice of 3×3 m square cell. This resolution seemed to create few errors when compared to the original topographic map. This 3×3 m square cell Lattice was exported to an ASCII file to be used for the MN2D dynamics model.
The resolution of the final DTM is limited by the quality of the original map. Also, interpolations applied in order to obtain the 3×3 cell Lattice result in real topography simpli-fications because original data have less resolution than the final DTM.
4 Results
3300 2300 3300 3200 2300 00 250 0 2400 310
0 3000 2900
2900 3000 3000 2900 2800 2800 2700 2600 2800 2500 2600 2700 2400 2700 2600 2500 2400 2300 # # # # # # # # e d a b c f g #
a: dry snow flow (3-5 m) + aerosol b: dry snow flow (4-5 m) + aerosol c: aerosol
d: dry snow flow (3 m) + aerosol e, f and g: aerosol
N
500 0 500 Meters
Lifts.shp
Dmg1999.shp
Avalan1999.shp
aerosol
flow-dry
Simu1999.shp
Limit of the simulated avalanche Avalanche 1999: aerosol flow-dryski lift affected pilons and transported pilon ski lift
buildings #
13,14
Flow characteristics from damages: # # # # # # 14 13
Figure 2: Map of the dry avalanche of
8 September 1999. Observations and simulation. Furdada, Martinez, Naaim
Fig. 2. Map of the dry avalanche of 8 September 1999. Observa-tions and simulation.
long historic register of avalanches that could support these magnitude avalanches had not occurred before. In a first ap-proach, it could be thought that the observed avalanches had a return period shorter than centenary.
On the other hand, we have found that Lied and Bakke-hoi (1980), Salm et al (1990) or Mears (1992), the slope an-gles where the extreme avalanches are considered to begin to decelerate range approximately from 15◦to 8.5◦, and they stop at lower angle slopes. The studied avalanches stopped at slope inclinations between 10◦and 15◦. This fact and the smooth terrain made us think that larger avalanches could occur.
Finally, MN2D dynamics model was recently calibrated by using some well known extreme avalanches from dif-ferent European paths (Barbolini et al, 2000). The basal Coulomb friction coefficientµ used to calibrate Las Le˜nas dry avalanche does not reach the value used to calibrate the European avalanches. From all these we deduce that the avalanches occurred in Las Le˜nas are not extreme avalanches.
5 Conclusions and perspectives
The first and obvious remark is that some knowledge of the region and information obtained from the personnel of the ski resort were absolutely necessary. In countries in develop-ment (and in some places also in developed countries), snow and meteorological data are not always complete nor are they completely representative of the avalanche conditions. All the data (specially the qualitative) must be treated carefully by experts. Otherwise, important mistakes can be made when using models. # # # # a b a: dense flow (4-6 m) + aerosol b: dense flow (3-4 m)
2500 2600 2800 3000 3100 2300 2700 Hotel Club de la Nieve
N
Lifts.shp
#Dmg2000.shp
Avalan2000.shp
aerosol
flow-dry
flow-wet
Simu2000.shp
12Limit of the simulated avalanche Avalanche 2000: aerosol flow-dry flow-wet
ski lift affected pilons ski lift
buildings
500 0 500 Meters Flow characteristics from damages:
# # 12,13, 14 # 14 13 12
Figure 3: Map of the mostly wet avalanche of 30 June 2000. Observations and simulation Furdada, Martinez, Naaim
Fig. 3.Map of the mostly dry avalanche of 30 June 2000. Observa-tions and simulation.
The MN2D dynamics model reproduces very well the ex-tension of the dry avalanche. The avalanche mapped in Fig. 2 was reconstructed by using photographs and considering the damage, so it is possible (and also probable) that the aerosol was a little bit greater than mapped. We think the simulation probably improves the limits of the aerosol where there are no facilities or other references to appreciate the damage and so, to map the limit of the avalanche.
The model does not reproduce the wet avalanche, which is more sensitive to topographic features, well. The reasons could be: (1) The DTM is not good enough due the quality of the original map. (2) The DTM does not include the changes on the topography due to the snow cover (ski resort personnel piled snow building dikes to avoid the avalanches to reach the hotel. They modified the topography strongly and therefore the path of the avalanche). (3) The physics used in this model (viscoplastic model) need to be improved. (4) All previous reasons put together.
The studied avalanches were not catastrophic avalanches. The good simulation obtained for the dry avalanche suggests that the dry extreme avalanche can be simulated in short. The special case of an extreme wet avalanche, more sensitive to the topography and suggestive of heavy snowfalls followed by sharp temperature increase and rain, should be considered carefully, both without modification of the topography and with modification of the topography due to the snow piled by the ski resort. This ski resort decision and actuation must be considered right in order to protect the hotel. If definitive modification were performed and dikes built, they should be surveyed and a new topographic map should be provided to facilitate modelling of extreme avalanches.
following enterprises and institutions: Las Le˜nas Ski resort; ACI 99-18 Generalitat de Catalunya; Secretar´ıa de Ciencia y T´ecnica Universidad Nacional de Cuyo; CUR: 1999SGR00065; Division ETNA-Cemagref. We want also thank the collaboration of C. Tor-res, chief of pistes and G. Chiguay from Las Le˜nas, and T. Moyano from the Servei de Dibuix UB.
References
Barbolini, M., Gruber, U., Keylock, C.J., Naaim, M., and Savi, F.: Application of statistical and hydraulic-continuum dense-snow avalanche models to five real European sites, Cold Reg. Sci. Tech., 31, 133–149, 2000.
Furdada, G., Mart´ınez, H., Leiva, J. C., and Foerster, M.: Reducci´on del riesgo de avalanchas de nieve: el ejemplo de la estaci´on de esqu´ı de Las Le˜nas, Actas XXa Reuni´on Cient´ıfica de Geof´ısica
y Geodesia de la Asociaci´on Argentina de Geof´ısica y Geodesia (AAGG), 264–268, 2000.
Lied, K. and Bakkehoi, S.: Empirical calculations of snow-avalanche run-out distance based on topographic parameters, J. of Glaciol., 26:94, 165–178, 1980.
Mears, A.: Snow-Avalanche hazard analysis for land-use planning and engineering, Colorado Geological Service Colorado, 49, 55, 1992.
Naaim, M.: Mod´elisation num´erique effets hydrodynamiques pro-duit par un glissement solide dans une retenue de barrage, PhD thesis, Joseph Fourier University, Grenoble, 180, 1991. Naaim, M. and Ancey, C.: Dense avalanche model, European
Sum-mer University, Chamonix, Cemagref, 173–181, 1992.