DOI: http://dx.doi.org/10.1590/2446-4740.0664
*e-mail: [email protected]
Received: 17 September 2014 / Accepted: 08 May 2015
Analysis of saliva by Fourier transform infrared spectroscopy for
diagnosis of physiological stress in athletes
Paulo Cesar Caetano Júnior*, Juliana Ferreira Strixino, Leandro Raniero
Abstract Introduction: Saliva is the most promising bioluid to monitor the physiological state of athletes, because this method is not invasive and has low contamination risks. The characterization of saliva by Fourier transform infrared spectroscopy (FT-IR) has been studied as an alternative technique to the standard clinical analysis. However, methodological procedures for saliva analysis are not completely clear, especially in terms of inluence of storage conditions and sample preparations for infrared analysis. Thawed saliva includes a precipitate, which may inluence the infrared spectral analysis. Thus, the purpose of this study was to show the spectral differences of the precipitate, supernatant, and a combo, as well as the best way to classify the physiological state of the athletes by FT-IR. Methods: The saliva collection was performed before, immediately after, and two hours after a handball match. After the storage of samples at –20 ○C, it was possible to identify two phases (precipitate and supernatant) and to determine the biochemical differences between the spectra of each phase, which were distinctly analyzed by the second derivative and deconvolution bands. Results: The precipitate and supernatant results showed characteristic bands, especially in the protein regions. All FT-IR spectra were also statistically classiied by linear discriminant analysis (LDA), using principal component analysis (PCA). The LDA precipitate and supernatant had lower value when compared to combo spectra (Combination of precipitate and supernatant) with 82%, showing that this combination is the best way to discriminate spectra of saliva samples collected before, immediately after, and 2 h after physical effort. Discussion: The results showed that it is possible to differentiate biochemically the two salivary phases, as well as the importance of the homogenization process of saliva samples to classify the physiological status of athletes using FT-IR. Keywords: Infrared spectroscopy, Saliva, Sports.
Introduction
Saliva is mainly composed of water, organic (active cations) and inorganic substances (Anions), proteins, glycoproteins, DNA, and RNA (Chiappin et al., 2007; Humphrey and Williamson, 2001). The production
and composition depends on activity of the autonomic,
sympathetic, and parasympathetic nervous systems,
which may produce different volume, ionic, and protein proiles for each individual (Edgar, 1990).
The potential use of saliva in clinical trials
has motivated many research groups. Studies
have demonstrated great possibilities of saliva to
monitor bodily changes, such as metabolic disorders
(Gonnissen et al., 2012), anemia (Jagannathan et al., 2012), DNA markers (Omelia et al., 2013), doping
control (Thieme, 2012), and especially the physiological
changes in athletes resulting from exercise training (Diaz et al., 2013; Moreira et al., 2013).
Some advantages of saliva compared to blood are the lower risk of contamination and easy
non-invasive collection procedure that permits
patients to collect the sample themselves (Bonne and
Wong, 2012). Its characterization is already done by chromatography, mass spectrometry, and colorimetric
immunoassay (Al-Shehri et al., 2013; Moreira et al., 2013; Novakovic et al., 2013; Salazar et al., 2013).
Fourier-transform infrared spectroscopy (FT-IR)
has also been used to characterize biological samples
as an alternative technique for laboratory tests (Ellis and Goodacre, 2006; Khaskheli et al., 2013). Many
studies demonstrated high sensitivity of FT-IR to analyze the skeletal muscle (Jerônimo et al., 2012),
heart muscle (Cheheltani et al. 2012), and some
biological luids, such as serum (Carvalho et al., 2014), urine (Khaskheli et al., 2013), and saliva
(Khaustova et al., 2010).
The few studies that analyzed saliva by FT-IR have produced promising results with quantitative analysis of biochemical components and provided real-time information without the use of reagents (Khaustova et al., 2010; Perez-Guaita et al., 2012).
This quantiication, using the absorption bands of the vibrational modes of molecular radicals in the infrared
region (4000-700 cm–1), identiied speciic bands for proteins, glucose, urea, secretory immunoglobulin
A (sIgA), cortisol, and phosphate (Khaustova et al., 2009, 2010).
Although there are several studies related to
saliva analysis as a powerful diagnostic tool in sports (Diaz et al., 2013; Moreira et al., 2013), the procedure
for saliva analysis needs to be standardized for FT-IR
measurements. Chiappin et al. (2007) reported that
the storage temperature of saliva depends on the time required before the analysis, ranging from ~4 °C to –80°C, mainly to prevent degradation of some components and bacterial growth. However, saliva-defrosting process exposes a precipitate composed of proteins,
which is only slightly discussed in the literature
(Francis et al., 2000) or it is not mentioned in studies
involving infrared analysis of saliva (Khaustova et al., 2009, 2010; Schultz et al., 1996).
Stress has inluence on proteins levels in the athletes’ saliva (Nater and Rohleder, 2009; Moreira et al., 2013). Thus, the precipitate formed by the defrosting
process could provide important information about
their physiological stress. The saliva sample with
precipitate analyzed by infrared spectroscopy could provide additional information.
Therefore, the purpose of this study was to show the main biochemical differences between the phases of saliva, supernatant, and precipitate, as well as the importance of these phases to better classify the physiological stress in athletes by FT-IR, using LDA and PCA.
Methods
Participants
All subjects participated voluntarily in this study, which was approved by the Research Ethics Committee
of the Universidade do Vale do Paraiba (No. 255 474). The group was composed of 14 professional male handball players (Age: 22 ± 2 years; Height: 184 ± 6 cm; Weight: 87.28 ± 10.11 kg), highly trained with a routine two periods daily, ive days per week.
The exclusion criteria were the use drugs/tobacco,
existence of oral disease, and any type of physical injury. Thus, the saliva sample of one of the athletes
was excluded.
Saliva collection
The saliva collection was performed before, immediately after, and two hours after a simulated handball match, which was composed of two 30 min halves and 5 min interval for recovering and hydration ad libitum (All oficial rules were maintained).
All subjects were informed in advance to abstain from food and caffeine products for at least 2 h prior
to the saliva collection. They were instructed to rinse out their mouths with distilled water and remain
seated with eyes open, head tilted slightly forward, and avoid orofacial movements (Chiappin et al., 2007; Moreira et al., 2013). Saliva samples were collected
in sterilized 2 ml Eppendorf tubes and immediately refrigerated at 5○C, then centrifuged for 30 min at
6500 rpm to remove any food detritus, and stored at –20○C for 5 days. Then the samples were thawed at
room temperature for FT-IR measurements.
Saliva analysis by FT-IR
Defrosted samples were again centrifuged for 5 min at 6500 rpm to separate the precipitate. After this process, 15 µl of supernatant and 15 µl of precipitate of each sample was deposited on a calcium luoride (CaF2) window and dehydrated for 30 min (Eppendorf
Concentrator 5301).
Infrared spectra were collected by a Spectrum
400 spectrophotometer coupled to a microscope
(Perkin-Elmer, Spotlight 400) controlled by a computer using Spotlight 400 Software. Spectra were recorded
in the spectral region 4000 to 750 cm-1, with 32 scans
and a resolution of 4 cm–1. The measurements were
performed along the thin ilm in eight random points, formed on the CaF2 surface. Considering the three
different times of collection (before, after, and 2 h after), a total of 312 spectra were obtained.
Statistical analysis
Anthropometric variables were presented as mean and standard deviation. For spectral analysis, principal
component analysis (PCA), linear discriminant analysis (LDA) methods, and Ward´s algorithm for cluster
analysis were used. PCA analyzes the data variance and reduces the observed variables, which avoids
redundant information by redistributing all variance
into orthogonal components. Thus, PCA was used
for dimensionality reduction, followed by LDA to maximize the component for class separation by linear combination of features that characterize the differences in the samples. Cluster analyses using Ward´s algorithm seek to form groups minimizing the standard deviation of the data of each group (Everitt, 1994; Ward, 1963).
The FT-IR spectra were irst analyzed using the
second derivative and hierarchical clustering using
Results
After thawing, the saliva contained small precipitates that increased the turbidity of the medium. In some
samples, the precipitates were larger, reaching several
millimeters. Centrifuging formed the saliva samples
into two distinct phases, denominated as supernatant and precipitate, as shown in Figure 1.
Figure 1a shows the multivariate statistical
analysis (Principal Component Analysis - PCA) of saliva collected before the handball match from the
covariance matrix, comprising the spectral data in the region 4000-750 cm–1. The separation of data
shown in the scatter plot of the PC1 vs. PC2 is quite clear, which can be explained by differences in the biochemical contents of the phase. The hierarchical
clustering analysis through these PCs, using the Ward
algorithm, evidenced the discrimination of spectra,
dendrogram in Figure 1b.
In order to amplify the spectral variations of
the supernatant and precipitate, we used the second
derivative of FT-IR spectra of the samples from athletes at rest (before match), shown in Figure 2.
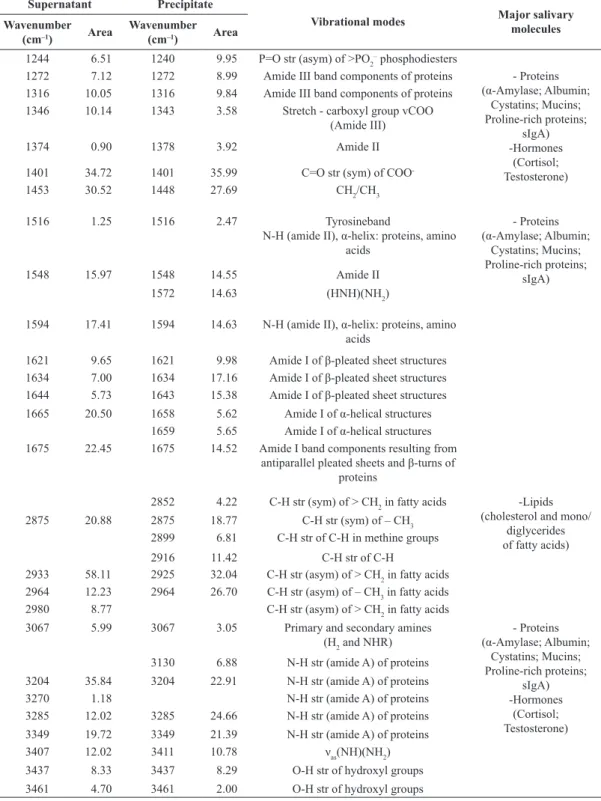
Table 1 gives the vibrational mode assignments
made by second derivative, as well as the results of the
band deconvolution analysis, together with the values
of area, from the FT-IR spectra of the supernatant and precipitate for the saliva samples collected before the
handball match.
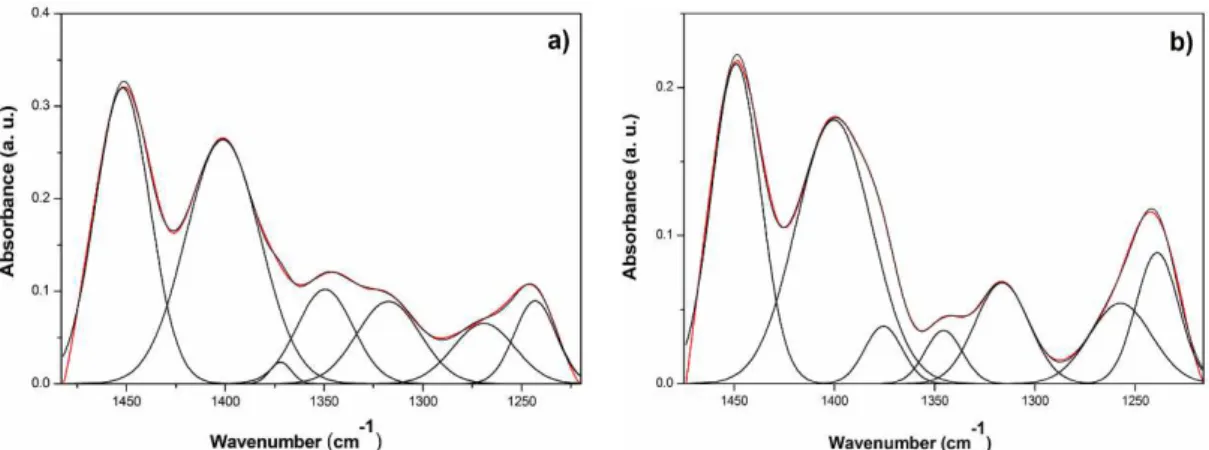
Figure 3 shows the deconvolution of bands in the
region of 1478-1216 cm–1 related mostly to amide III.
In this region, both parts of the saliva showed the same bands, with only the values of the Gaussian
area varying.
In the region 1720-1498 cm–1 shown in Figure 4,
unlike the precipitate, the spectra of supernatant showed
no bands in the regions 1572 and 1659 cm–1. These regions correspond mainly to the vibrational modes
of amide I, α-helix, β-pleated sheets, and δ (HNH) (NH2) (Table 1).
Figure 5 presents the deconvolution of bands in the region 2996-2840 cm–1, which correspond to group -CH3 and >CH2 fatty acids (Table 1). In the spectra of
the precipitate, four bands were found, 2852, 2899,
and 2916 cm–1, which are absent in the spectra of the supernatant, while the band 2980 cm–1 was observed
only in the spectra of the supernatant (Table 1). In the region 3522-3014 cm–1, band 3130 cm–1 was
seen only in the spectra of the precipitate, while the
3270 cm–1 band was found exclusively in the spectra
of the supernatant (Figure 6). This region is assigned to N-H stretching (Amide A) of proteins (Table 1).
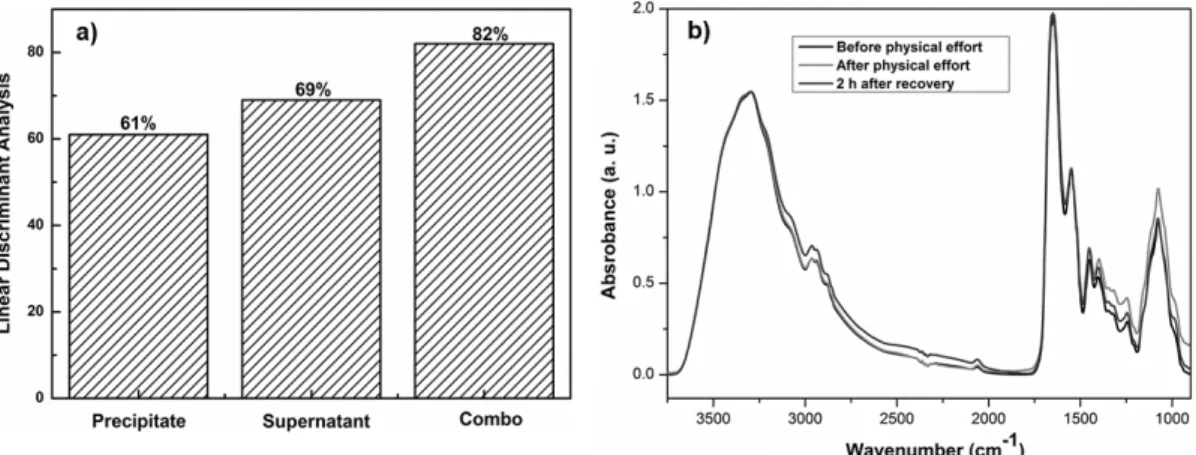
Figure 7a shows the linear discriminant analysis
of average spectra of saliva samples collected before, immediately after, and 2 h after handball match for
each studied phase: supernatant, precipitate and combo
(Precipitate plus supernatant). The irst ive principal components (PCs) were used for this analysis.
For each phase, a total of 39 saliva samples were used, which included 13 samples collected before handball match; 13 samples soon after the match, and 13 samples after 2 h of recovery. The combo had the highest percentage of discrimination with 82%,
Figure 1. Separation of FT-IR spectra of the precipitate and supernatant
of saliva samples collected before handball match: (a) Multivariate statistical analysis (Principal Component Analysis - PCA) and (b) Hierarchical clustering analysis of principal components (PCs).
Figure 2. Second derivative of the average spectra of saliva samples
Table 1. Vibrational modes assignments by second derivative of supernatant and precipitate from saliva samples collected before handball
match (cm–1).
Supernatant Precipitate
Vibrational modes Major salivary
molecules Wavenumber
(cm–1) Area
Wavenumber
(cm–1) Area
1244 6.51 1240 9.95 P=O str (asym) of >PO2
– phosphodiesters
1272 7.12 1272 8.99 Amide III band components of proteins - Proteins (α-Amylase; Albumin;
Cystatins; Mucins; Proline-rich proteins;
sIgA) -Hormones
(Cortisol; Testosterone)
1316 10.05 1316 9.84 Amide III band components of proteins
1346 10.14 1343 3.58 Stretch - carboxyl group vCOO
(Amide III)
1374 0.90 1378 3.92 Amide II
1401 34.72 1401 35.99 C=O str (sym) of COO
-1453 30.52 1448 27.69 CH2/CH3
1516 1.25 1516 2.47 Tyrosineband
N-H (amide II), α-helix: proteins, amino acids
- Proteins (α-Amylase; Albumin;
Cystatins; Mucins; Proline-rich proteins;
sIgA)
1548 15.97 1548 14.55 Amide II
1572 14.63 (HNH)(NH2)
1594 17.41 1594 14.63 N-H (amide II), α-helix: proteins, amino
acids
1621 9.65 1621 9.98 Amide I of β-pleated sheet structures
1634 7.00 1634 17.16 Amide I of β-pleated sheet structures
1644 5.73 1643 15.38 Amide I of β-pleated sheet structures
1665 20.50 1658 5.62 Amide I of α-helical structures
1659 5.65 Amide I of α-helical structures
1675 22.45 1675 14.52 Amide I band components resulting from
antiparallel pleated sheets and β-turns of proteins
2852 4.22 C-H str (sym) of > CH2 in fatty acids -Lipids
(cholesterol and mono/ diglycerides of fatty acids)
2875 20.88 2875 18.77 C-H str (sym) of – CH3
2899 6.81 C-H str of C-H in methine groups
2916 11.42 C-H str of C-H
2933 58.11 2925 32.04 C-H str (asym) of > CH2 in fatty acids
2964 12.23 2964 26.70 C-H str (asym) of – CH3 in fatty acids
2980 8.77 C-H str (asym) of > CH2 in fatty acids
3067 5.99 3067 3.05 Primary and secondary amines
(H2 and NHR)
- Proteins (α-Amylase; Albumin;
Cystatins; Mucins; Proline-rich proteins;
sIgA) -Hormones
(Cortisol; Testosterone) 3130 6.88 N-H str (amide A) of proteins
3204 35.84 3204 22.91 N-H str (amide A) of proteins
3270 1.18 N-H str (amide A) of proteins
3285 12.02 3285 24.66 N-H str (amide A) of proteins
3349 19.72 3349 21.39 N-H str (amide A) of proteins
3407 12.02 3411 10.78 νas(ΝΗ)(ΝΗ2)
3437 8.33 3437 8.29 O-H str of hydroxyl groups
3461 4.70 3461 2.00 O-H str of hydroxyl groups
Str=stretching. νs=symmetric stretching mode. νas=asymmetric stretching mode. Used the following references for vibrational mode assignments (Beekes et al., 2007; Cai and Singh, 2004; Khaustova et al., 2010; Krimm and Bandekar, 1986; Oberg et al., 2004; Stuart, 1997).
followed by the supernatant with 69%, and precipitated with 61%. These results indicate that the combo is the most appropriate way to discriminate spectra of saliva collected before and after physical effort, to
identify levels of physiological stress in athletes.
Thus, Figure 7b shows the average FT-IR spectra of
Discussion
This study aimed at showing the main biochemical
differences between supernatant and precipitate saliva to identify the most effective way to classify levels of physiological stress in athletes.
The precipitate formed after thawing (Figure 1a)
is reported by Francis et al. (2000), which showed the
formation of this phenomenon by thawing and that its quantity varies according with the type of secretion,
where the parotid saliva produced relatively little and submandibular-sublingual saliva considerably more. Figure 3. Deconvolution of the FT-IR spectra of saliva samples collected before handball match in the region 1478-1216 cm–1: (a) Supernatant
and (b) Precipitate.
Figure 4. Deconvolution of FT-IR spectra of saliva samples collected before handball match in the region 1720-1498 cm–1: (a) Supernatant
and (b) Precipitate.
Figure 5. Deconvolution of FT-IR spectra of saliva samples collected before handball match in the region 2996-2840 cm–1: (a) Supernatant
The method for dealing with this phenomenon requires further information because few studies report the formation of precipitate and some of them use methods that may inluence the analysis, for example, removing the precipitate using centrifugation, which can lead to loss of some low molecular-weight proteins.
Among the studies involving infrared analysis of saliva, the precipitate was not mentioned. Khaustova et al. (2009) only report that saliva was
centrifuged and kept at –80°C until analysis. In addition
to this methodology, Khaustova et al. (2010) iltered
the samples after thawing.
Our analysis was made of salivary supernatant and precipitate with FT-IR, with the aim of showing the biochemical differences between them. The results,
using multivariate PCA analysis and hierarchical clustering (Figure 1), found that it is possible to
discriminate the FT-IR spectra of both phases. The lack of information and variation of the degree of precipitation from sample to sample made it dificult
to characterize completely the molecules present in both phases.
This discrimination indicates that there are
biochemical differences between the precipitate and
the supernatant. These results could be correlated by
gel electrophoresis results reported in the study of Francis et al. (2000), which showed that removing the
precipitate by centrifugation process causes a loss of molecular-weight proteins (Approximately 14 kDa) and some higher molecular weight proteins, for example α-amylase, compared to samples mixed vigorously and/or mixed with EDTA (Ethylenediaminetetraacetic acid).
In this regard, it is believed that the supernatant contains organic (67%) and inorganic components (33%), active cations (Na+, K+, Ca2+) and anions
(Cl–, HCO3–); hormones, such as cortisol and testosterone; and proteins, especially those with high
molecular weight, such as α-amylase, mucins, sIgA. In the precipitate, besides the presence of some proteins
Figure 7. (a) Discriminant analysis of the average FT-IR spectra of saliva samples collected, before, immediately after, and 2 h after handball
match for phases: supernatant, precipitate, and combo. For each study phase, a total of 39 saliva samples were used (n=13 before; n=13
immediately after; n=13 after 2 h of recovery); (b) Average FT-IR spectra recorded in 3750-900 cm–1 region of combo for saliva samples
collected before, after, and 2 h after handball match.
Figure 6. Deconvolution of FT-IR spectra of saliva samples collected handball match in the region 3522-3014 cm–1: (a) Supernatant and
of higher molecular weight, other molecules with low
molecular weight, such as the cystatins, histatins, and
histidine, are predominantly present (Chiappin et al., 2007; Francis et al., 2000; Humphrey and Williamson, 2001; Khaustova et al., 2010).
Some biochemical components of saliva have highly speciic bands in the infrared region, including
those considered important biomarkers to evaluate
physical stress (Diaz et al., 2013; Khaustova et al., 2009; Moreira et al., 2013). Khaustova et al. (2010) showed that the regions 1503-1440 cm–1, 1317-1249 cm–1, and 1190-936 cm–1 are strongly correlated with
the levels of total salivary proteins, obtained by traditional techniques. The regions 1567-1526 cm–1 and 1488-1406 cm–1 are correlated to sIgA concentrations, the regions 1943-1526 cm–1, 1391-1249 cm–1, and 1115-973 cm–1 with the cortisol concentrations, and regions 1578-1548 cm–1, 1526-1496 cm–1, and 1444-1305 cm–1 to levels of α-amylase.
This speciicity is due to the individual differences of the biochemical structures of each molecule. Although some authors report the complexity of the spectrum of human saliva due to the absorption of proteins, lipids, carbohydrates, ions, etc. (Schultz et al., 1996),
others say that even among a wide range of molecules, it is possible to identify bands related to the type of protein, especially after spectral preprocessing, using derivative analysis (Khaustova et al., 2010).
The results obtained in this study corroborate this statement, because through deconvolution analysis
of bands, it was possible to identify some unique bands in the spectra of the salivary precipitate.
These bands are related to proteins absorption in the regions 1572, 1659, and 3130 cm–1, assigned
to δ (HNH) (NH2), amide I α-helix structures and δ
(NH), respectively. We also found some bands related
to lipid in 2852 cm–1, CH stretching (symmetric) of CH2, 2899 cm–1 C-H stretching methine group, and 2916 cm–1 CH stretching. The bands 2980 cm–1,
attributed to C-H stretching (asymmetric) of CH2, corresponding to hormones, and 3270 cm–1, attributed
to N-H stretching (Amide A), related to proteins and hormones, are present only in the FT-IR spectra of
supernatant (Table 1).
These results showed that both precipitate and
supernatant have characteristic IR bands, mainly related
to high molecular-weight and low molecular-weight molecules, respectively. Furthermore, even with the
same bands, the values of area of the precipitate differ from the values of the supernatant in the regions of
1478-1216 cm–1, 1720-1498 cm–1, 2996-2840 cm–1, and 3522-1314 cm–1, indicating that some molecules
could be present in both phases, but at different
concentrations.
The discriminant analysis showed that the combo is the most appropriate way to discriminate spectra
of saliva collected before and after physical effort by multivariate statistical analysis, PCA followed by LDA (Figure 7a). These results can be explained by
low or high molecular-weight biomarkers present in the precipitate, which altered in response to exercise
(Francis et al., 2000; Khaustova et al., 2010).
In order to avoid the separations of phases, fresh
saliva could be used. However, the samples must be analyzed promptly due to bacterial growth and
degradation of salivary components (Francis et al., 2000; Hansen et al., 2008; Rohleder and Nater, 2009; Toone et al., 2013). Another alternative is to
improve stability of samples by addition of EDTA or sodium azide (DeCaro, 2008; Fox et al., 1986),
but inluence the FT-IR spectra.
Francis et al. (2000) showed by electrophoresis
that the band pattern of the saliva mixed vigorously is very similar to saliva with EDTA. Thus after thawing, the homogenization of saliva samples by vigorous mixing appears to be more appropriate for FT-IR measurements.
The understanding of saliva IR spectra is very
important because they could be used to avoid excessive training loads, which can compromise
the main regulatory body systems, and consequently their sports performance (Meeusen et al., 2013; Moreira et al., 2013). Laboratory techniques and methods routinely used to analyze stress biomarkers
(Al-Shehri et al., 2013; Moreira et al., 2013;
Novakovic et al., 2013; Salazar et al., 2013) are relatively expensive and laborious, which makes it is impossible to monitor athletes that belong to teams
without inancial support. FT-IR spectroscopy has
some advantages in relation to these laboratories
analysis such as: easy sample preparation for spectral acquisition; fast data acquisition, small quantity of sample required; and nondestructive and sensitive technique (Franck et al., 1998; Khaustova et al., 2010; Petibois et al., 2000).
In conclusion, the results showed that it is possible to differentiate biochemically the two salivary phases (supernatant and precipitate), as well as classify the physiological status of athletes in exercise training by FT-IR, using PCA and LDA.
Acknowledgements
References
Al-Shehri S, Henman M, Charles BG, Cowley D, Shaw PN, Liley H, Tomarchio A, Punyadeera C, Duley JA. Collection and determination of nucleotide metabolites in neonatal and adult saliva by high performance liquid chromatography with tandem mass spectrometry. Journal of Chromatography. B, Analytical Technologies in the Biomedical and Life Sciences. 2013; 931:140-7. http://dx.doi.org/10.1016/j. jchromb.2013.05.001. PMid:23792366.
Beekes M, Lasch P, Naumann D. Analytical applications of Fourier transform-infrared (FT-IR) spectroscopy in microbiology and prion research. Veterinary Microbiology. 2007; 123(4):305-19. http://dx.doi.org/10.1016/j. vetmic.2007.04.010. PMid:17540519.
Bonne NJ, Wong DT. Salivary biomarker development using genomic, proteomic and metabolomic approaches. Genome Medicine. 2012; 4(10):82. http://dx.doi.org/10.1186/gm383. PMid:23114182.
Cai S, Singh BR. A distinct utility of the amide III infrared band for secondary structure estimation of aqueous protein solutions using partial least squares methods. Biochemistry. 2004; 43(9):2541-9. http://dx.doi.org/10.1021/bi030149y. PMid:14992591.
Carvalho CS, Andrade, LEC, Keusseyan SP, Rangel JL, Ferreira-Strixino J, Martin AA, Raniero LJ. Study of advanced rheumatoid arthritis. Brazilian Journal of Biomedical Engineering. 2014; 30 (1) 54-63.
Cheheltani R, Rosano JM, Wang B, Sabri AK, Pleshko N, Kiani MF. Fourier transform infrared spectroscopic imaging of cardiac tissue to detect collagen deposition after myocardial infarction. Journal of Biomedical Optics. 2012; 17(5):056014. http://dx.doi.org/10.1117/1.JBO.17.5.056014. PMid:22612137.
Chiappin S, Antonelli G, Gatti R, De Palo EF. Saliva specimen: a new laboratory tool for diagnostic and basic investigation. Clinica Chimica Acta; International Journal of Clinical Chemistry. 2007; 383(1-2):30-40. http://dx.doi. org/10.1016/j.cca.2007.04.011. PMid:17512510. DeCaro JA. Methodological considerations in the use of salivary alpha-amylase as a stress marker in field research. American Journal of Human Biology: The Official Journal of the Human Biology Council. 2008; 20(5):617-9. http:// dx.doi.org/10.1002/ajhb.20795. PMid:18491409. Diaz MM, Bocanegra OL, Teixeira RR, Soares SS, Espindola FS. Salivary nitric oxide and alpha-amylase as indexes of training intensity and load. International Journal of Sports Medicine. 2013; 34(1):8-13. PMid:22960992.
Edgar WM. Saliva and dental health. Clinical implications of saliva: report of a consensus meeting. British Dental Journal. 1990; 169(3-4):96-8. http://dx.doi.org/10.1038/ sj.bdj.4807284. PMid:2206655.
Ellis DI, Goodacre R. Metabolic fingerprinting in disease diagnosis: biomedical applications of infrared and Raman spectroscopy. Analyst (London). 2006; 131(8):875-85. http:// dx.doi.org/10.1039/b602376m. PMid:17028718.
Everitt BS. Statistical methods for medical investigations. 2nd ed. London: Edward Arnold; 1994.
Fox PC, van der Ven PF, Baum BJ, Mandel ID. Pilocarpine for the treatment of xerostomia associated with salivary gland dysfunction. Oral Surgery, Oral Medicine, and Oral Pathology. 1986; 61(3):243-8. http://dx.doi.org/10.1016/0030-4220(86)90369-5. PMid:3517744.
Francis CA, Hector MP, Proctor GB. Precipitation of specific proteins by freeze-thawing of human saliva. Archives of Oral Biology. 2000; 45(7):601-6. http://dx.doi.org/10.1016/ S0003-9969(00)00026-1. PMid:10785524.
Franck P, Nabet P, Dousset B. Applications of infrared spectroscopy to medical biology. Cell Mol Biol (Noisy-le-grand). 1998; 44(2):273-5. PMid:9593577.
Gonnissen HK, Rutters F, Mazuy C, Martens EA, Adam TC, Westerterp-Plantenga MS. Effect of a phase advance and phase delay of the 24-h cycle on energy metabolism, appetite, and related hormones. The American Journal of Clinical Nutrition. 2012; 96(4):689-97. http://dx.doi. org/10.3945/ajcn.112.037192. PMid:22914550.
Hansen AM, Garde AH, Persson R. Sources of biological and methodological variation in salivary cortisol and their impact on measurement among healthy adults: a review. Scandinavian Journal of Clinical and Laboratory Investigation. 2008; 68(6):448-58. http://dx.doi.org/10.1080/00365510701819127. PMid:18609093.
Humphrey SP, Williamson RT. A review of saliva: normal composition, flow, and function. The Journal of Prosthetic Dentistry. 2001; 85(2):162-9. http://dx.doi.org/10.1067/ mpr.2001.113778. PMid:11208206.
Jagannathan N, Thiruvengadam C, Ramani P, Premkumar P, Natesan A, Sherlin HJ. Salivary ferritin as a predictive marker of iron deficiency anemia in children. The Journal of Clinical Pediatric Dentistry. 2012; 37(1):25-30. http://dx.doi. org/10.17796/jcpd.37.1.ap20543762015370. PMid:23342563. Jerônimo DP, Souza RA, Silva FF, Camargo GL, Miranda HL, Xavier M, Sakane KK, Ribeiro W. Detection of creatine in rat muscle by FTIR spectroscopy. Annals of Biomedical Engineering. 2012; 40(9):2069-77. http://dx.doi.org/10.1007/ s10439-012-0549-9. PMid:22419197.
Khaskheli AR, Sirajuddin, Sherazi ST, Mahesar SA, Kandhro AA, Kalwar NH, Mallah MA. Estimation of ibuprofen in urine and tablet formulations by transmission Fourier transform infrared spectroscopy by partial least square. Spectrochimica Acta. Part A: Molecular and Biomolecular Spectroscopy. 2013; 102:403-7. http://dx.doi.org/10.1016/j. saa.2012.10.021. PMid:23237846.
Khaustova SA, Shkurnikov MU, Grebenyuk ES, Artyushenko VG, Tonevitsky AG. Assessment of biochemical characteristics of the saliva using Fourier transform mid-infrared spectroscopy. Bulletin of Experimental Biology and Medicine. 2009; 148(5):841-4. http://dx.doi.org/10.1007/s10517-010-0831-5. PMid:20396807.
spectroscopy. Analyst (London). 2010; 135(12):3183-92. http://dx.doi.org/10.1039/c0an00529k. PMid:20953513. Krimm S, Bandekar J. Vibrational spectroscopy and conformation of peptides, polypeptides, and proteins. Advances in Protein Chemistry. 1986; 38:181-364. PMid:3541539. Meeusen R, Duclos M, Foster C, Fry A, Gleeson M, Nieman D, Raglin J, Rietjens G, Steinacker J, Urhausen A, European College of Sport Science, American College of Sports Medicine. Prevention, diagnosis, and treatment of the overtraining syndrome: joint consensus statement of the European College of Sport Science and the American College of Sports Medicine. Medicine and Science in Sports and Exercise. 2013; 45(1):186-205. http://dx.doi. org/10.1249/MSS.0b013e318279a10a. PMid:23247672. Moreira A, Freitas CG, Nakamura FY, Drago G, Drago M, Aoki MS. Effect of match importance on salivary cortisol and immunoglobulin A responses in elite young volleyball players. Journal of Strength and Conditioning Research / National Strength & Conditioning Association. 2013; 27(1):202-7. http://dx.doi.org/10.1519/JSC.0b013e31825183d9. PMid:22395269.
Nater UM, Rohleder N. Salivary alpha-amylase as a non-invasive biomarker for the sympathetic nervous system: current state of research. Psychoneuroendocrinology. 2009; 34(4):486-96. http://dx.doi.org/10.1016/j.psyneuen.2009.01.014. PMid:19249160.
Novakovic N, Cakic S, Todorovic T, Raicevic BA, Dozic I, Petrovic V, Perunovic N, Gostovic SS, Sretenovic JK, Colak E. Antioxidative status of saliva before and after non-surgical periodontal treatment. Srpski Arhiv za Celokupno Lekarstvo. 2013; 141(3-4):163-8. http://dx.doi.org/10.2298/ SARH1304163N. PMid:23745337.
Oberg KA, Ruysschaert JM, Goormaghtigh E. The optimization of protein secondary structure determination with infrared and circular dichroism spectra. European Journal of Biochemistry / FEBS. 2004; 271(14):2937-48. http://dx.doi.org/10.1111/j.1432-1033.2004.04220.x. PMid:15233789.
Omelia EJ, Uchimoto ML, Williams G. Quantitative PCR analysis of blood- and saliva-specific microRNA markers following solid-phase DNA extraction. Analytical Biochemistry. 2013; 435(2):120-2. http://dx.doi.org/10.1016/j. ab.2012.12.024. PMid:23333269.
Perez-Guaita D, Ventura-Gayete J, Pérez-Rambla C, Sancho-Andreu M, Garrigues S, de la Guardia M. Protein determination in serum and whole blood by attenuated total reflectance infrared spectroscopy. Analytical and Bioanalytical Chemistry. 2012; 404(3):649-56. http://dx.doi.org/10.1007/ s00216-012-6030-7. PMid:22547354.
Petibois C, Déléris G, Cazorla G. Perspectives in the utilisation of Fourier-transform infrared spectroscopy of serum in sports medicine: health monitoring of athletes and prevention of doping. Sports Medicine (Auckland, N.Z.). 2000; 29(6):387-96. http://dx.doi.org/10.2165/00007256-200029060-00002. PMid:10870865.
Rohleder N, Nater UM. Determinants of salivary alpha-amylase in humans and methodological considerations. Psychoneuroendocrinology. 2009; 34(4):469-85. http:// dx.doi.org/10.1016/j.psyneuen.2008.12.004. PMid:19155141. Salazar MG, Jehmlich N, Murr A, Dhople VM, Holtfreter B, Hammer E, Völker U, Kocher T. Identification of periodontitis associated changes in the proteome of whole human saliva by mass spectrometric analysis. Journal of Clinical Periodontology. 2013; 40(9):825-32. http://dx.doi. org/10.1111/jcpe.12130. PMid:23790309.
Schultz CP, Ahmed MK, Dawes C, Mantsch HH. Thiocyanate levels in human saliva: quantitation by Fourier transform infrared spectroscopy. Analytical Biochemistry. 1996; 240(1):7-12. http://dx.doi.org/10.1006/abio.1996.0323. PMid:8811872.
Stuart B. Biological applications of infrared spectroscopy. Chichester: John Wiley & Sons; 1997.
Thieme D. Potential and limitations of alternative specimens in doping control. Bioanalysis. 2012; 4(13):1613-22. http:// dx.doi.org/10.4155/bio.12.150. PMid:22831477. Toone RJ, Peacock OJ, Smith AA, Thompson D, Drawer S, Cook C, Stokes KA. Measurement of steroid hormones in saliva: Effects of sample storage condition. Scandinavian Journal of Clinical and Laboratory Investigation. 2013; 73(8):615-21. http://dx.doi.org/10.3109/00365513.2013. 835862. PMid:24033227.
Ward JH Jr. Hierarchical grouping to optimize an objective function. Journal of the American Statistical Association. 1963; 58(301):236-44. http://dx.doi.org/10.1080/016214 59.1963.10500845.
Authors
Paulo Cesar Caetano Júnior1*, Juliana Ferreira Strixino1, Leandro Raniero1
1 Laboratório de Nanosensores, Instituto de Pesquisa e Desenvolvimento – IP&D, Universidade do Vale do Paraíba –