*e-mail: [email protected]
Cellular Automata Simulation of Site-saturated and Constant Nucleation Rate
Transformations in Three Dimensions
Paulo Rangel Rios*, Valmir Torres de Oliveira, Luciana de Oliveira Pereira,
Maxwell Ruela Pereira, José Adilson de Castro
Universidade Federal Fluminense,
Escola de Engenharia Industrial Metalúrgica de Volta Redonda,
Av. dos Trabalhadores, 420, 27255-125 Volta Redonda - RJ, Brazil
Received: September 27, 2005; Revised: April 3, 2006
Microstructural evolution in three dimensions of nucleation and growth transformations is simulated by means of cellular automata. Two types of nucleation are considered: site-saturated nucleation and constant nucleation rate. The simulated microstrutural evolution agrees very well with exact analytical expressions. The simulated data also gives very good agreement with expressions derived to describe the evolution of the interfaces between transformed grains.
Keywords:microstructure, kinetics, recrystallization, computer simulation, cellular automata
1. Introduction
Formal kinetics is a powerful technique to model nucleation and growth solid state transformations. In these transformations, a parent phase, α, also called “matrix” or untransformed region”, transforms into a product phase, β, also called “transformed region”. In this approach, nucleation and growth are regarded as purely “opera-tional” concepts meaning that no assumption is made regarding their mechanism but only their geometrical and kinematical characteristics. Recrystallization kinetics in particular has been mainly analyzed with the help of formal kinetics methodology1-4.
This approach has two facets: one experimental another theoreti-cal. The experimental facet specifies the microstrutural descriptors5
that may be experimentally obtained, preferentially from planar sections, such as: volume fraction transformed, VV; interface area be-tween transformed and untransformed regions, SV, and interface area between transformed regions, SVβ. The theoretical facet aims at devel-oping expressions that involve these measurable quantities. Today, one attempts not to rely on three-dimensional quantities that cannot be measured by standard stereological methods but require tedious and time consuming serial sectioning. With the advent of 3DXRD techniques6 experimental determination of three-dimensional
quanti-ties like the number of nuclei per unit of volume, NV, or even nuclei location in space might well become viable on a routine basis.
The basis of formal kinetic modeling is the early work of Johnson-Mehl7, Avrami8-10 and Kolmogorov11 (JMAK), which used only a single
microstructural descriptor, VV. JMAK’s work was subsequently extended by DeHoff12, who proposed the use of an additional microstructural
de-scriptor, SV, and the associated concept of microstructural path. Vander-meer and coworkers13 extended DeHoff’s microstructural path concept
and crystallized it in an all round theoretical treatment covering variable nucleation and growth rates as well as non-spherical regions.
Nevertheless, even general analytical treatments have significant limitations owing to unavoidable simplifying assumptions. For in-stance, Vandermeer et al.13 assume that nuclei are randomly located
in space. However, when one considers, for example, austenite to ferrite transformation, ferrite nucleates at grain boundaries14,15.
Another example is recrystallization, where the deformed state is,
as a rule, highly heterogeneous16 casting some doubt on the
assump-tion that nuclei are randomly located in space. Relaxing this and other assumptions may lead to situations too complex for analytical methods. In this regard, computer simulation of microstructural evolution can be an invaluable tool since it can simulate situations beyond analytical treatment. Compared to other simulation methods, cellular automata17-30 is a convenient choice for phase transformations
in general and recrystallization in particular23.
Computer simulation aims at describing transformation in complex situations for which there is no analytical theory. In order to accomplish this, one must first make sure that the simulation is able to describe accurately the simplest cases for which there are exact mathematical descriptions. Interestingly, this basic or minimum validation of the simulation has been rarely reported in published papers23.
In previous papers28,29, present authors carried out cellular
autom-ata (CA) simulation of phase transformation/recrystallization in two dimensions (2D). Earliest computer simulations of microstructural evolution were usually performed in two dimensions. Even in recent papers some authors have chosen to work in two dimensions probably because the computer cost of three-dimensional (3D) simulations is significantly higher than that of 2D simulations. Although there is a certain interest in the study of two-dimensional transformations, for example, transformations taking place in thin films or thin sheets, the greatest interest lye in three dimensional transformations.
The purpose of this paper is to simulate phase transformations/ recrystallization in 3D by cellular automata (CA). Two basic nuclea-tion types were assumed:
a) site-saturation: all nucleation occurs at the beginning of the transformation; and
b) constant nucleation rate: the number of new nuclei per unit of time per unit of volume is constant.
Simulated microstrutural evolution was compared in detail with predictions of mathematically exact analytical theories28. Moreover,
simulated data was used to test new expressions recently derived by Rios et al.31 to describe the evolution of the interfaces between
2. Description of the Cellular Automata Simulation
Cellular automata simulation used a 3D von Neumann neigh-borhood17. The matrix consisted of a cubic lattice with 304
x
304 x 304 cells. One cell edge was considered to have a unit length and consequently of a single cell had unit volume. Units of all quantities reported here follow from this. The nuclei were randomly dispersed on the matrix. For site-saturated nucleation, the number of nuclei per unit of volume, NV, was equal to 125/3043. For constant
nucleation rate, the nucleation rate per unit of time per unit of volume, I, was equal to 2/3043. This nucleation rate resulted in 141 nuclei per
unit of volume when the transformation reached VV = 1.
The simulation produced a sequence of matrices as a function of time. Time is discrete in CA, it takes integer values starting from t = 0. One time unit corresponds to the interval between two consecu-tive matrix updates17. From the simulated matrices, all the desired
quantities could be extracted. Oliveira30 gives further details of the
present simulation.
3. Growth of a Single Grain
When a single grain grows in isolation, it is possible to find analytical expressions for its growth. The following expressions are specific for the 3D von Neumann neighborhood adopted in this simulation. The time origin, t = 0, corresponds to a volume fraction equal to zero, VV = 0. Therefore, the volume of a single grain, v, and its area, s, at t = 0 are equal to:
v(0) = 0 (1a)
s(0) = 0 (1b)
For t≥ 1 the volume of a single grain as a function of time is:
(2)
This equation is not valid for t = 0. Neglecting the lower order powers of time:
(3)
The area of a single grain, s, for t≥ 1 is:
s(t) = 12t2 – 12t + 6 (4)
Again, neglecting early time behavior:
s(t) ≅12t2 area units (5)
Equations 3 and 5 will be used below in section 4 to represent the growth of a single grain.
The average interface velocity, < G >, can be calculated with the help of Cahn-Hagel32 equation:
(6)
Inserting Equations 3 and 5 gives:
(7)
The units will be omitted from now on.
The average interface velocity is constant. Therefore, for a single grain the simulation was able to produce constant growth rate.
It is worthy mentioning that the volume and the area of a single grain showed time dependencies different from what would be ex-pected from constant velocity growth. In this case it was possible to use only the leading term, with the highest power of time. A similar situation was found in a previous work28 on 2D cellular automata
simulation. It is not easy to say what effect a different choice of neighborhood or a different transition criterion would have on this time dependence. So, CA simulations should check this. This is rarely reported in published papers on this subject17-30.
4. Microstructural Evolution: Volume Fraction,
Interface Area Per Unit of Volume and
Microstructural Path
In this section, the expressions derived in the previous section for single grain evolution were used to obtain expressions contain-ing “global” measurements, that is, average measurements such as volume fraction and interface area per unit of volume. The calculated expressions were compared with the results from the simulation. This section mainly deals with quantities related to the mobile interface: the interface between transformed and untransformed regions. In each case, an analytical expression was derived for site-saturation nucleation and constant nucleation rate. Section 5 will compare simulations results with new expressions derived for the evolution of the interfaces between transformed regions.
Figures 1-3 show the results obtained from the simulation com-pared with the theoretical expressions obtained in this section. One
0 20 40 60 80 100
VV
Time 1.0
0.8
0.6
0.4
0.2
0.0
Site-saturated Simulated Calculated
(a)
0 20 40 60 80 100 120
VV
Time Constant nucleation rate
Simulated Calculated 1.0
0.8
0.6
0.4
0.2
0.0
(b)
cannot directly compare Figures 1a-3a with Figures 1b-3b because the number of nuclei per unit of volume is different in each case. In order to avoid overloading the figures not all simulation points were plotted.
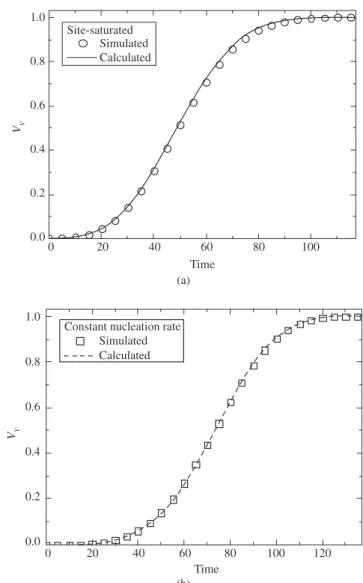
4.1. Volume fraction as a function of time
The extended volume fraction, VVE, is the sum of the volume of all individual grains supposing that they grow without impingement. The subscript “E” is reserved for “extended quantities” defined in a manner similar to the extended volume fraction. Using Equation 3 one obtains:
(8a)
(8b)
where NV is the number of nuclei per unit of volume and I is the nu-cleation rate per unit of volume; Equations 8a and 8b correspond to site-saturated nucleation and constant nucleation rate, respectively.
For randomly located nuclei, the extended volume fraction, VVE, and the real volume fraction, VV, are related by the JMAK expression:
0 20 40 60 80 100
SV
Time 0.06
0.05
0.04
0.03
0.02
0.01
0.00
Site-saturated Simulated Calculated
(a)
0 20 40 60 80 100 120
Sv
Time
Constant nucleation rate Simulated Calculated 0.06
0.05
0.04
0.03
0.02
0.01
0.00
(b)
Figure 2. Interface area between transformed and untransformed region per unit of volume, SV, against time. There is good agreement between theory and simulation: a) site-saturated; and b) constant nucleation rate.
VV = 1 – exp (– VVE) (9) As a result:
(10a)
(10b)
where Equations 10a and 10b correspond to site-saturated nucleation and constant nucleation rate, respectively.
Figures 1a and 1b show a comparison between VV calculated from the analytical solution and obtained from the CA simulation. The agreement is very good.
4.2. Interface area between transformed and untransformed
regions as a function of time and volume fraction
The extended interface area per unit of volume between trans-formed grains and untranstrans-formed regions, SVE, is the sum of the in-terface area of all individual grains supposing that they grow without impingement. Using Equation 5 it can beshown that:
SVE = 12NV t2 (11a)
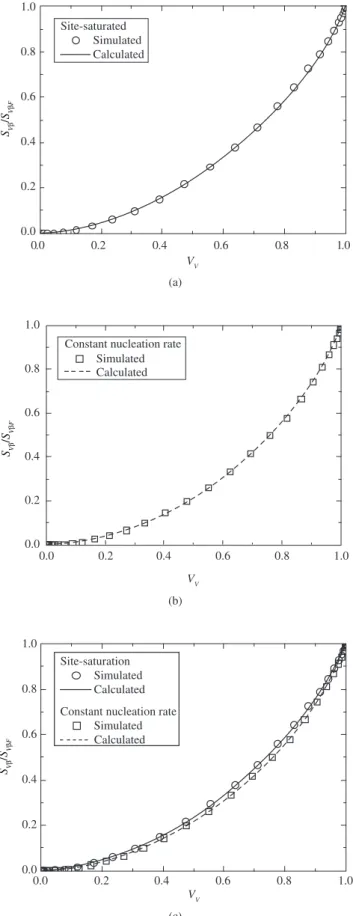
0.0 0.2 0.4 0.6 0.8 1.0
SV
V
V
Site-saturated Simulated Calculated 0.06
0.05
0.04
0.03
0.02
0.01
0.00
0.0 0.2 0.4 0.6 0.8 1.0
SV
V
V
Constant nucleation rate Simulated Calculatad 0.06
0.05
0.04
0.03
0.02
0.01
0.00
(a) (b)
Figure 3. Microstructural path: area of the interface between transformed and untransformed region per unit of volume, SV, against volume fraction, VV. There
SVE = 4It3 (11b)
where Equations 11a and 11b correspond to site-saturated nucleation and constant nucleation rate, respectively.
The extended interface area and real interface area, SV, are related by the DeHoff’s12 expression:
SV = (1 – VV) SVE (12)
Equation 12 together with Equations 1a and 1b give:
(13a)
(13b)
where Equation 13a and 13b correspond to site-saturated nucleation and constant nucleation rate, respectively.
Figures 2a and 2b show a comparison between the SV, calculated from the analytical solution, Equations 13a-b, and obtained from the CA simulation. The agreement is very good.
In three dimensions the microstructural path can be seen as a curve on the (VV, SV) plane. From Equations 8a,b and 11a,b one can find a relationship between SVE and VVE:
(14a)
(14b)
where Equation 14a and 14b correspond to site-saturated nucleation and constant nucleation rate, respectively. From Equations 9, 12 and Equations 14 one can obtain SV as a function of volume fraction transformed:
(15a)
(15b)
where Equation 15a and 15b correspond to site-saturated nucleation and constant nucleation rate, respectively.
Figures 3a and 3b show a comparison between the values cal-culated using the theoretical expression for the microstructural path obtained above and those obtained from the simulation. The agree-ment is very good.
The average grain boundary velocity is given by32:
(16)
The grain boundary velocity calculated from the simulated values was 0.34 + 0.01, very close to the theoretical prediction for both site-saturated nucleation and constant nucleation rate. This means that the interface velocity in real space is the same as that in extended space, as expected.
In summary CA simulation showed very good agreement with exact mathematical expressions.
5. Comparison of the Simulation with New
Analytical Expressions for the Impinged Interface
Area Per Unit of Volume, Total Interface Area Per
Unit of Volume and the Contiguity
There are two kinds of interface during an heterogeneous phase transformation: mobile and immobile. The mobile interface is the interface between the transformed region and the untransformed matrix. This interface migrates and its migration determines the
transformation progress. The immobile interface is a consequence of impingement of transformed grains. The transformed grain size is a function of the interface area between transformed grains when the transformation reaches VV = 1.
Traditionally, experimental and theoretical studies focus on the mobile interface. This could be seen in the previous section where all equations involved only SV. However, the amount of interface be-tween transformed grains, SVβ, is an important quantity and contains valuable information on transformation evolution. CA simulation is able to provide accurate data on these interfaces and so gives a good basis for comparison with analytical models. Combining SVβ with SV two useful quantities may be defined. One is the total interface area per unit of volume, SVT:
SVT = SV + 2SVβ (17)
Another important quantity, derived from SVβ with SV is the conti-guity parameter, Cβ. The contiguity is the ratio of immobile interface area to the total interface area and is quite sensitive to deviations of nuclei location from randomness, as recently shown by Vandermeer and Jensen5,33; see also Rios et al.29. It can be defined as5:
(18)
Recently Rios et al.31 have derived analytical expressions for
SVβ as a function of volume fraction transformed for time depend-ent nucleation rate and time dependdepend-ent velocity. They followed up the earlier work by Meijring34, Gokhale35,36 and more recently an
elegant mathematical derivation by Tong et al.37. All these authors
solved this problem for spherical growth. Rios et al.31 derivation has
the advantage of being mathematically simpler and not restricted to spherical growing regions. The disadvantage of their method is that, as will be shown below, they do not obtain an explicit expression for SVβF, the value of SVβ for a fully transformed matrix. Their expressions can be used to obtain analytical expressions for SVT and Cβ. Rios et al.31 derivation is repeated here for convenience. The starting point
of their derivation was DeHoff’s relationship between the extended and the real interface area, Equation 12, rewritten below in a slightly different way:
SV (VV, SVE) = SVE (1 – VV) (19) One can consider that a small change in SV, δSV, can be seen as a sum of changes in each variable, δVV and δSVE:
(20)
Or
δSV = (1 – VV) δSVE – (SVE) δVV (21) The above has two terms:
a) The first is always positive, it corresponds to the increase in SV when the interface length increases δSE in extended space, at a constant VV, corrected for impingement by the factor (1 – VV); and
b) The second term, - SVEδVV, is negative because SVE and δVV are always positive. It corresponds to the decrease in SV, when the area fraction increases for a constant SVE, this decrease corre-sponds to a “loss” in SV due to the “creation” of new impinged interface. Two extended interfaces meet to make one impinged interface, SVβ, so:
(22)
(23)
It is more convenient to write Equation 23 in terms of extended quantities with the help of a relationship obtained from Equation 9:
dVV = exp(– VVE)dVVE (24) where VVE, the extended volume fraction, is the sum of the volume of all growing grains divided by the total volume assuming that the growing grains do not impinge. Equation 23 then becomes:
(25)
In order to integrate Equation 25 it is necessary to know the rela-tionship between SVE and VVE which is supposed to be of the form13:
SVE = C(VVE)q (26)
Resulting in:
(27)
This integral can be written in terms of the incomplete Gamma function, Γ:
(28)
The factor α can be found by taking the limit VVE →∞. For VVE →∞, VV → 1, the specimen is fully transformed and SVβ tends to a constant value SVβF:
( )
C q
S 1 2V F
a C
=
+
b (29)
Inserting Equation 29 into 26:
(30)
where SVβF is the amount of interface area between transformed re-gions when the transformation has reached VV = 1. Using the definition of contiguity, Equation 18:
( ) ( ) , ( ) , ln ln ln C C V
V S q
q V S q q V 1 1
1 2 1
1 1 1 1 2 1 1 1 1 1 V V q V F V V F V C C C C = -- + - + + -+ + -b b b J L K K K J L K K K c
d d c
c d N P O O O N P O O O mn mn mn (31)
For the cases considered here, C and q can be found from the relationships between SVE and VVE given by Equations 14a-b:
a) site-saturation: q = 2/3 and C = 3(36NV)1/3; and
b) constant nucleation rate: q = 3/4 and C = 4(27I)1/4.
More general expressions for C and q can be found in Rios et al.31.
Equations 30 and 31 can be written as a function of time with the help of Equations 10a and b. The total interface area per unit of volume, SVT, can be found by means of Equations 15a,b and Equa-tions 30 and Equation 17.
Figures 4-7 show the comparison of the values calculated by means of Equations 17, 30 and 31 and those obtained from the simulation. The agreement is very good. For SVβ and SVT, Figures 4-7, the normal-ized quantities SVβ/SVβF and SVT/(2SVβF) were plotted. In order to avoid overloading the figures not all simulation points were plotted.
0 20 40 60 80 100
SVB
/
SVB
F Time Site-saturated Simulated Calculated 1.0 0.8 0.6 0.4 0.2 0.0 (a)
0 20 40 60 80 100 120
Time Constant nucleation rate
Simulated Calculated 1.0 0.8 0.6 0.4 0.2 0.0 SV B /
SVB
F
(b)
Figure 4. Area of the interface between transformed and transformed region per unit of volume, SVβ/SVβF, against time. There is good agreement between theory and simulation: a) site-saturated; and b) constant nucleation rate.
An interesting aspect of the present comparison is that the growing regions were not spherical in this simulation. This shows that Rios et al.31 expression applies when the shape of the growing regions is not
spherical34-36.
Figures 5c and 7c show that the normalized quantities SVβ/SVβF and Cβ are practically the same for both nucleation types. Randomness in nuclei distribution might have an underlying effect that is stronger than the details of the kinetics31.
It is important to mention that no adjustable parameters were used in this work. Only exact analytical solutions were compared with the simulations. The good agreement between theory and simula-tion shows that CA is able to reproduce situasimula-tions for which there are mathematically exact solutions. This good agreement suggests that CA may be applied to complex situations for which there are no analytical solutions.
6. Summary and Conclusions
0.0 0.2 0.4 0.6 0.8 1.0 V
V
Site-saturated Simulated Calculated
SVB
/
SV
B
F
1.0
0.8
0.6
0.4
0.2
0.0
(a)
0.0 0.2 0.4 0.6 0.8 1.0
V
V
Constant nucleation rate Simulated Calculated
SV
B
/
SVB
F
1.0
0.8
0.6
0.4
0.2
0.0
(b)
0.0 0.2 0.4 0.6 0.8 1.0
V
V
Site-saturation Simulated Calculated
Constant nucleation rate Simulated
Calculated
SVB
/
SVB
F
1.0
0.8
0.6
0.4
0.2
0.0
(c)
Figure 5. Area of the interface between transformed and transformed region per unit of volume, SVβ/SVβF, against volume fraction. There is good agreement
between theory and simulation: a) site-saturated; b) constant nucleation rate; and c) Figures 5a and 5b plotted together; SVβ/SVβF as a function of volume
fraction is practically the same for both nucleation types.
0 20 40 60 80 100
Time Site-saturated
Simulated Calculated
SVT
/
SVTF 1.0
0.8
0.6
0.4
0.2
0.0
(a)
0 20 40 60 80 100 120
Time Constant nucleation rate
Simulated Calculated 1.0
0.8
0.6
0.4
0.2
0.0 SVT
/
SVTF
(b)
Figure 6. Total interface area per unit of volume, SVT/(2SVβF) against time. There is good agreement between theory and simulation: a) site-saturated; and b) constant nucleation rate.
Nonetheless, its results are general and may be applied to any nuclea-tion and growth transformanuclea-tion.
Present results show that CA is able to reproduce the site-saturated nucleation and constant nucleation rate kinetics for which there are exact solutions. This good agreement suggests that CA may be used with some confidence in more complex situations for which there are no theoretical results.
CA simulation showed to be useful to test expressions developed by Rios et al.31 for the evolution of area per unit of volume of the
interface between the transformed regions. The good agreement observed is a reconfirmation of the validity of these new expressions in the situations examined here.
Acknowledgments
0.0 0.2 0.4 0.6 0.8 1.0
CB
V
V
Site-saturated Simulated Calculated 1.0
0.8
0.6
0.4
0.2
0.0
(a)
0.0 0.2 0.4 0.6 0.8 1.0
CB
V
V
Constant nucleation rate Simulated Calculated 1.0
0.8
0.6
0.4
0.2
0.0
(b)
0.0 0.2 0.4 0.6 0.8 1.0
CB
V
V
Site-saturation Simulated Calculated
Constant nucleation rate Simulated Calculated 1.0
0.8
0.6
0.4
0.2
0.0
(c)
Figure 7. Contiguity, Cβ, against volume fraction. There is good agreement between theory and simulation: a) site-saturated nucleation; b) constant nu-cleation rate; and c) Figures 7a and 7b plotted together; Cβ as a function of volume fraction is practically the same for both nucleation types.
References
1. Vandermeer RA, Jensen DJ. Microstructural path and temperature de-pendence of recrystallization in commercial aluminum. Acta Materialia. 2001; 49(11):2083-2094.
2. Rios PR, Padilha AF. Microstructural path of recrystallization in a commercial Al-Mn-Fe-Si (AA3003) alloy. Materials Research. 2003; 6(4):605-613.
3. Rios PR, Padilha AF. Comment on “Microstructural path and tempera-ture dependence of recrystallization in commercial aluminum”. Scripta Materialia. 2003; 48(11):1561-1564.
4. Rios PR, Siciliano Jr F, Sandim HRZ, Plaut RL, Padilha AF. Nucleation and growth during recrystallization. Materials Research. 2005; 8(3)225-238.
5. Vandermeer RA. Microstructural descriptors and the effects of nuclei clustering on recrystallization path kinetics. Acta Materialia. 2005; 53(5):1449-1457.
6. Lauridsen EM, Poulsen HF, Nielsen SF, Jensen DJ. Recrystallization kinetics of individual bulk grains in 90% cold-rolled aluminum. Acta Materialia. 2003; 51(15):4423-4435.
7. Johnson WA, Mehl RF. Reaction kinetics in processes of nucleation and growth. Transactions AIME. 1939; 135:416-441.
8. Avrami MJ. Kinetics of phase change I general theory. The Journal of Chemical Physics. 1939; 7(12):1103-1112.
9. Avrami MJ. Kinetics of phase change II transformation-time relations for random distribution of nuclei. The Journal of Chemical Physics. 1940; 8(2):214-224.
10. Avrami MJ. Kinetics of phase change III granulation, phase change, and microstructure kinetics of phase change. The Journal of Chemical Phys-ics. 1941; 9(2):177-184.
11. Kolmogorov NA. The statistics of crystal growth in metals. Isvestiia Academii Nauk SSSR - Seriia Matematicheskaia. 1937; 1:333-359.
12. DeHoff RT. In: Hansen N, Jensen DJ, Leffers T, Ralph B, editors. Anneal-ing Processes—Recovery, Recrystallization and Grain Growth. Proceed-ings of the 7th Conference of Risø National Laboratory; 1986, Roskilde:
Denmark. Roskilde: Risø National Laboratory; 1986. p. 35-52.
13. Vandermeer RA, Masumura RA, Rath B. Microstructural paths of shape-preserved nucleation and growth transformations. Acta Metallurgica et Materialia. 1991; 39(3):383-389.
14. Cahn JW. The kinetics of grain boundary nucleated reactions. Acta Metal-lurgica. 1956; 4(9):449-459.
15. Vandermeer RA, Masumura RA. The microstructural path of grain bound-ary nucleated phase transformations. Acta Metallurgica et Materialia. 1992; 40(4):877-886.
16. Sandim HRZ, Martins JP, Padilha AF. Orientation effects during grain subdivision and subsequent annealing in coarse-grained tantalum. Scripta Materialia. 2001; 45(6):733-738.
17. Hesselbarth HW, Göbel IR. Simulation of recrystallization by cellular automata. Acta Metallurgica et Materialia. 1991; 39(9):2135-2143.
18. Pezzee CF, Dunand DC. The impingement effect of an inert, immobile 2nd
phase on the recrystallization of a matrix. Acta Metallurgica et Materialia. 1994; 42(5):1509-1524.
19. Sessa V, Fanfoni M, Tomellini M. Validity of Avrami’s kinetics for ran-dom and nonranran-dom distributions of germs. Physical Review B. 1996; 54(2):836-841.
20. Goetz RL, Seetharaman V. Static recrystallization kinetics with homo-geneous and heterohomo-geneous nucleation using a cellular automata model. Metallurgical and Materials Transactions A-Physical Metallurgy and Materials Science. 1998; 29(9):2307-2321.
21. Marx V, Reher FR, Gottstein G. Simulation of primary recrystallization using a modified three-dimensional cellular automaton. Acta Materialia. 1999; 47(4):1219-1230.
23. Raabe D. Cellular automata in materials science with particular reference to recrystallization simulation. Annual Review Materials Research. 2002; 32:53-76.
24. Zhang L, Zhang CB, Wang YM, Wang SQ, Ye HQ A cellular automaton investigation of the transformation from austenite to ferrite during con-tinuous cooling. Acta Materialia. 2003; 51(18):5519-5527.
25. Goetz RL. Particle stimulated nucleation during dynamic recrystallization using a cellular automata model. Scripta Materialia. 2005; 52(9):851-856.
26. Rios PR, Carvalho JJS, Salazar TC, Paula FVL, Castro JA. Cellular automata simulation of the effect of nuclei distribution on the recrystal-lization kinetics. Materials Science Forum. 2004; 467-470: 659-664. 27. Oliveira JCPT. Simulação do efeito da distribuição dos núcleos na cinética
e no caminho microestrutural da recristalização pelo método do autômato celular [unpublished M. Sc. thesis]. Volta Redonda: Universidade Federal Fluminense; 2004.
28. Rios PR, Oliveira JCPT, Oliveira VT, Castro JA. Comparison of analyti-cal models with cellular automata simulation of recrystallization in two dimensions. Materials Research. 2005; 8(3):341-345.
29. Rios PR, Oliveira JCPT, Oliveira VT, Castro JA. Microstructural descriptors and cellular automata simulation of the effects of non-random nuclei location on recrystallization in two dimensions. Materials Research. 2006; 9(2).
30. Oliveira VT. Desenvolvimento do Código Computacional para a Simu-lação da Recrystallização em 3D pelo Método do Autômato Celular.
[unpublished M. Sc. thesis]. Volta Redonda: Universidade Federal Flu-minense; 2005.
31. Rios PR, Godiksen R, Schmidt S, Jensen DJ, Vandermeer RA. Ana-lytical expression for the evolution of interfacial area density between transformed grains during nucleation and growth transformation. Scripta Materialia. 2006; 54(8):1509-1513.
32. Cahn JW, Hagel W. Theory of the Pearlite Reaction. In: Zackay ZD, Aaaronson HI, editors. Decomposition of austenite by Diffusional Proc-esses. New York: Interscience; 1960.
33. Vandermeer RA, Jensen DJ. Effects of nuclei clustering on recrystalliza-tion kinetics. Materials Science Forum. 2004; 467-470:193-196.
34. Meijering JL. Interface area, edge length, and number of vertices in crystal aggregates with random nucleation. Philips Research Reports. 1953; 8(4):270-290.
35. Gokhale AM. Calculation of Product Phase Grain Boundary Area During Solid State Transformations. Metallurgical Transactions A - Physical Metallurgy and Materials Science. 1988; 19A(9):2123-2131.
36. Gokhale AM. Calculation of Product Phase Grain Edge Length and Quadruple Points Per Unit Volume During Solid State Transformations. Metallurgical Transactions A - Physical Metallurgy and Materials Sci-ence. 1989; 20A(3):349-355.