CLIMATIC RISK FOR POTATO LATE BLIGHT IN THE
ANDES REGION OF VENEZUELA
Beatriz Ibet Lozada Garcia1; Paulo Cesar Sentelhas2*; Luciano Roberto Tapia3; Gerd Sparovek4
1
Instituto Nacional de Investigaciones Agrícolas (INIA), Bramón, Táchira - Venezuela.
2
USP/ESALQ - Depto. de Ciências Exatas, C.P. 09 - 13418-900 - Piracicaba, SP - Brasil.
3
USP/CIAGRI - C.P. 09 - 13418-900 - Piracicaba, SP - Brasil.
4
USP/ESALQ - Depto. de Ciência do Solo. *Corresponding author <pcsentel@esalq.usp.br>
ABSTRACT: Potato is an important crop for Venezuelan agriculture. However, its production is highly affected by late blight (Phytophtora infestans), since weather is commonly favorable for this disease.
The aim of this study was to determine the sowing dates of low climatic risk for potato late blight in the Andes region of Venezuela, with an agrometeorological disease model and geographical information system (GIS) tools. The disease model used in this study was developed by Hyre (1954) which requires daily rainfall and temperature data which were obtained from 106 weather stations, located at the States of Mérida, Táchira, and Trujillo, for a period of 31 years. Hyre’s model was applied for all stations obtainig the following variables: number of disease favorable days (DFD); number of periods with ten consecutive favorable days, named disease occurrence (O); and number of sprays required for disease control (S). These variables were used to calculate the Maximum Risk Index (MRI) and the Probable Risk Index (PRI). The interpolation of these indexes was used to generate maps of climatic risk for each sowing date. MRI and PRI maps showed that the highest climatic risk for potato late blight occurrence was during the rainy season, from May to July, decreasing during dry and mid seasons. However, high disease risk variability was observed for all seasons. The maps generated by coupling an agrometeorological disease model and GIS also show that in great part of potato areas of Andes region the number of sprays could be reduced, but more investigations about that must be carried out.
Key words: Phytophtora infestans, Hyre’s model, temperature, rainfall
RISCO CLIMÁTICO PARA A OCORRÊNCIA DE REQUEIMA DA
BATATA NA REGIÃO ANDINA DA VENEZUELA
RESUMO: A batata é uma importante cultura para a agricultura venezuelana. Entretanto, sua produção é altamente afetada pela ocorrência da requeima (Phytophtora infestans), já que as condições climáticas
são normalmente favoráveis para essa doença. O objetivo deste estudo foi determinar as datas de semeadura com os menores riscos climáticos para a ocorrência da requeima na região andina da Venezuela, considerando o uso de um modelo agrometeorológico de previsão da doença e um sistema de informação geográfica (GIS). O modelo de estimativa da doença utilizado foi o desenvolvido por Hyre (1954), o qual requer dados diários de chuva e temperatura. Esses dados foram obtidos de 106 estações meteorológicas, situadas nos estados de Mérida, Táchira e Trujillo, para períodos de 31 anos. O modelo de Hyre foi aplicado para todas as estações, obtendo-se as seguintes variáveis: número de dias favoráveis à doença (DFD); número de períodos com dez dias favoráveis consecutivos, denominado de ocorrência (O); e número de pulverizações requeridas para o controle da doença (S). Essas variáveis foram utilizadas para calcular o Índice de Máximo Risco (MRI) e o Índice de Risco Provável (PRI). A interpolação desses índices foi usada para gerar mapas de risco climático para cada época de semeadura. Os mapas de MRI e PRI mostraram que os maiores riscos para a proliferação da requeima da batata ocorre na estação chuvosa, de maio a julho, decrescendo durante as estações seca e de transição. Entretanto, alta variabilidade do risco para a doença foi observada em todas as épocas de semeadura. Os mapas gerados pela combinação do modelo agrometeorológico de previsão da doença e GIS também mostraram que em boa parte das áreas produtoras de batata na região andina da Venezuela a redução do número de pulverizações pode ser possível, no entanto há necessidade de novas pesquisas para se comprovar isso.
INTRODUCTION
Potato (Solanum tuberosum L.) is one of the main crops of the Andes region of Venezuela, which is composed by the states of Táchira, Mérida, and Trujillo. The altitude of the areas where the potato crop is grown in this region is between 400 and 3,000 meters above sea level, where average temperatures range from 10 to 20ºC and annual rainfalls from 1,000 to 1,800 mm. However, according to Escalante & Farrera (2004), these climatic conditions are also very favorable for potato late blight (causal agent Phytophtora infestans (Mont) de Bary), which is the main limitation for local potato production, causing losses up to 100% in some years (Garcia & Garcia, 2004).
Control of potato late blight is done in several ways, combining cultural practices with regular fun-gicides application during the growing season (Garrett & Dendy, 2001; Taylor et al., 2003; Lozada Garcia, 2005; Kirk et al., 2005). Even considering cultural practices as very important for potato production, chemical control is essential for this crop (Hijmans et al., 2000). A typical fungicide application schedule used by growers in Andes region of Venezuela is a 7-day spray interval, very similar as for other regions around the world. The excessive use of fungicides for potato production makes control very expensive and may cause environmental contamination, so more economi-cal and environmentally sound control measures are needed (Kirk et al., 2005).
Several strategies have been developed and ap-plied to reduce the amount of fungicide sprays for po-tato late blight control. Some of them are based on the combination of plant resistance, reduced rates and fre-quencies of fungicides applications (Kankwatsa et al., 2003; Kirk et al., 2005) and others on decision support systems (DSS), also known as disease warning systems, which take into account available information about crop, pathogen, fungicides, and mainly weather (historic and forecast) to determine when to spray.
The objective of the present study was to de-termine the sowing dates of low late blight risk for the potato crop in the Andes region of Venezuela, by the use of a GIS-linked weather-based disease model, to provide subsidies for planning rational disease control in the different growing seasons.
MATERIAL AND METHODS
Location and weather data
The region of this study comprises the states of Táchira, Mérida, and Trujillo, in the Andes region of Venezuela (Figure 1), with altitudes ranging from 0
to 5,000 meters. Because of the high variation of alti-tude, the climates of this region are diverse, including tropical savanna (Aw), tropical wet (Af), humid sub-tropical (Cf), subsub-tropical steppe (BS), and highland (H), according to Koeppen climate classification. Our study was based on daily weather data from 106 stations, belonging to Ministry of Environment and Natural Re-sources (MARN) of Venezuela, distributed in the three different states of the Andes region for a period of 31 years, from 1967 to 1997.
As few of the weather stations in this regions were able to provide a complete daily temperature dataset, climatological maximum and minimum daily temperatures were estimated by the regression method proposed by Lozada Garcia (2005), using the relation-ship among temperature and geographical coordinates (altitude, longitude and latitude), as follows:
T = a + b Altitude + c Longitude + d Latitude
where T is temperature (ºC) and a,b,c andd are the empirical coefficients of the multiple linear regression, determined with data from 17 weather stations in the Andes region.
Missing data observed in the rainfall series of the 106 stations (17% of the total days) were filled in using the Closest Station method, based in a cluster analysis approach, proposed by Lozada Garcia et al. (2006).
Disease forecast model
Considering the limitations of weather data in the Andes region of Venezuela, the disease model used
in this study was that one developed by Hyre (1954), which is the simplest among the available models. This model has been extensively evaluated and implemented by growers in the northeastern United States (Califor-nia PestCast, 2007). Hyre (1954)´s model is just based on daily rainfall and maximum and minimum tempera-tures. It forecasts the outbreak of potato late blight 7-14 days after the occurrence of ten consecutive late blight favorable days. Days are considered late blight favorable when the 5-day average temperature (T5d) is below 25.5ºC and the total rainfall for the last 10 days (R10d) is 30 mm or greater. Under these condi-tions fungicide spray is recommended. Days with minimum temperatures below 7.2ºC are considered unfavorable.
Based on results presented by Fry et al. (1983), who considered 18-21ºC as the optimum temperature range for potato late blight occurrence, and Garcia (2001) and Escalante & Farrera (2004), who observed late blight occurrence under temperatures lower than 25ºC in Venezuela, an adjustment was made in the tem-perature threshold of Hyre´s model, considering days as favorable when T5d was below 22ºC. In addition to the procedure presented above, the following condi-tions were considered: pathogen was always present in the crop areas; there were no late blight resistant cultivars that meet commercial standards in Andes re-gion of Venezuela; and each growing season ended when 1,500 DD (base temperature = 2ºC) had been accumulated or 140 days after emergence was reached. Data analysis
The weather data obtained from 106 weather stations at Andes region, for a period of 31 years, were used to run Hyre´s model for late blight occurrence on potato crop in a daily scale, according to the grow-ing season of each place. This analysis, based on tem-perature and rainfall thresholds presented previously, resulted in the following variables: number of disease favorable days (DFD); number of periods with ten con-secutive favorable days, named disease occurrence (O); and number of sprays required for disease control (S), discounting the period of five days when the chemi-cal control was effective after each spray. These vari-ables were used to calculate the Maximum Risk In-dex (MRI, %), obtained by the relationship between S and the maximum possible number of sprays, con-sidering a 7-day interval, and the Probable Risk Index (PRI), which is the probable number of fungicide sprays, considering empirical probabilities of 25, 50, and 75%. These fixed probabilities represent the chance of a given number of sprays to occur, like PRI = 7 at 75% shows that 7 sprays are required for 75 of 100 years.
Maps of potato late blight MRI and PRI were obtained for 20 sowing dates (two per month), from 1stJanuary to 15th October, which were grouped into three sowing seasons, as commonly adopted by growers of this region: from January to April (dry season); from May to July (rainy season); and from August to September (mid season). The interpolation of the disease risk indexes for each sowing season was done by geostatistics, using the ordinary Kriging method, according to the following steps: i) Assess-ment of the trend and the stationarity of both vari-ables; ii) Establishment of experimental variograms with the software Variowin 2.2 – Vario2D (Pannatier, 1996); iii) Adjustment of experimental variograms to theoretical models with the software Variowin 2.2 – Model (Pannatier, 1996); iv) Interpolation of both variables with the software TNTmips 6.7 (MicroImages, Inc.).
MRI and PRI data were submitted to an explor-atory analysis to evaluate the shape of data distribution. A normal distribution was obtained for both. No trend was observed, confirming the hypothesis of stationary. The values of MRI and PRI for all growing seasons were also evaluated by variograms, using a spherical model, which showed that these variables were spatially auto-correlated, with a range of 50 to 60 km (Table 1). For MRI, the risks were categorized in four levels: low risk, when MRI ranged from 0 to 25%; medium risk, when MRI ranged from 25.1 to 50%; high risk, when MRI ranged from 50.1 to 75%; and very high risk, when MRI ranged from 75.1 to 100%.
RESULTS
Even considering the importance of the av-erage information for a first approach of the poten-tial of potato late blight occurrence in Andes regions of Venezuela, this was not enough to characterize the potentialities of specific areas, since there is a high spatial variability of climatic conditions inside the studied states, especially because of the variation of altitude (from 0 to 5,000 m). Figure 3 shows the vari-ability of average DFD, O and S for each one of the 106 weather stations, taking into account an average of all simulated sowing dates. DFD ranged from one to more than 50 days in all states (Figure 3a), while O ranged from less than one to more than five (Fig-ure 3b). The same variability was observed for S, which represents better the late blight risk (Figure 3c). In this case, the maximum average number of sprays predicted by Hyre's model was more than four, which was more frequent in Mérida State and less frequent in Trujillo.
Maximum risk index
The maps of MRI generated for each grow-ing season are presented in Figure 4. For the dry sea-son, which includes the sowing dates from January to April, MRI stayed around 25-30% in the majority of the areas where potato crop is cultivated in the three states, showing a low risk for late blight. In some few areas, however, MRI ranged from 50 to 60%, representing a high risk. In general, MRI index shows the disease risk by the relationship be-tween the number of sprays required and the num-ber of sprays applied by a conventional control system (each seven days). In another way, this in-dex also shows the percentage that can be avoided in relation to conventional control. During the dry season when the climate is less favorable for late Figure 2 - Average weather conditions, from 1967 to 1996,
represented by five-day average temperature (T5d) and total rainfall for the last ten days (R10d), for the states of Táchira (a), Mérida (b), and Trujillo (c), Venezuela. The horizontal lines are the thresholds (limits) considered by Hyre’s model.
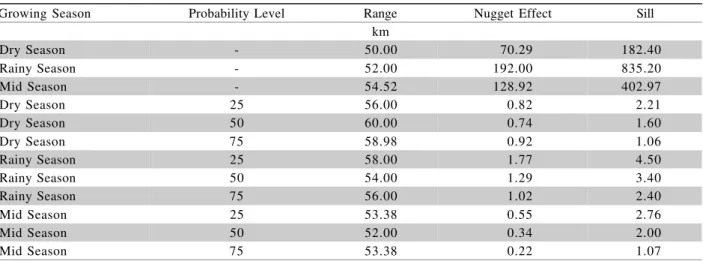
Table 1 - Range, nugget effect, and sill for the spherical variogram model for maximum risk index (MRI) and probable risk index (PRI) for potato late blight in the states of Táchira, Mérida e Trujillo, in the Andes region of Venezuela.
Growing Season Probability Level Range Nugget Effect Sill
km
Dry Season - 50.00 70.29 182.40
Rainy Season - 52.00 192.00 835.20
Mid Season - 54.52 128.92 402.97
Dry Season 25 56.00 0.82 2.21
Dry Season 50 60.00 0.74 1.60
Dry Season 75 58.98 0.92 1.06
Rainy Season 25 58.00 1.77 4.50
Rainy Season 50 54.00 1.29 3.40
Rainy Season 75 56.00 1.02 2.40
Mid Season 25 53.38 0.55 2.76
Mid Season 50 52.00 0.34 2.00
Mid Season 75 53.38 0.22 1.07
0 5 10 15 20 25 30
1 21 41 61 81 101 121 141 161 181 201 221 241 261 281 301 321 341 361
T 5d ( o C) 0 10 20 30 40 50 60 70
T5d Temp limit
R10d Rainfall limit
a 0 5 10 15 20 25 30
1 21 41 61 81 101 121 141 161 181 201 221 241 261 281 301 321 341 361
T 5d ( o C) 0 10 20 30 40 50 60 70 b R 10d (mm) 0 5 10 15 20 25 30
1 21 41 61 81 101 121 141 161 181 201 221 241 261 281 301 321 341 361
Day of the year
blight, sprays are necessary to control the disease but with 40 to 70% less applications than normally done by growers.
During the rainy season, from May to July, the risk for late blight increased since temperature and rainfall were within the limits required for disease development. During this season, MRI reached 100% in some places, but in the main potato production areas it ranged from 20 to 80%. The most critical areas for late blight oc-currence were in great part of Táchira state, south of Trujillo, and south and center of Merida state.
MRI decreased for the mid season, but still presenting medium to high risk (40-70%) in some parts of Táchira state. In Mérida and Trujillo states MRI reached no more than 50% in some areas, which rep-resents a medium risk for potato late blight. On aver-age, for the majority of production areas of the Andes region, MRI during mid season was no greater than 30%, what shows the high potential of a weather-based disease warning system to help growers to re-duce the number of sprays to control potato late blight. In an overall perspective, dry and mid seasons are the best ones to grow potatoes in the Andes re-gion of Venezuela, especially when sowing was per-formed from January to March (dry season) or in Oc-tober (mid season). On the other hand, the worst pe-riod for potato sowing was from beginning of April to beginning of August, when rainfall amount was criti-cal for late blight development.
Probable risk index
Another way to evaluate potato late blight risk was by considering the probability of its occurrence, rep-resented by the number of sprays required in function of the weather conditions for each growing season and place. For that, the probable risk indexes for 25, 50 and 75% of probability were determined (Figures 5, 6, 7). Figure 3 - Average values of: a) number of disease favorable days
(DFD); b) number of periods with ten consecutive favorable days, named occurrence (O); and c) number of sprays required for disease control (S), for each one of the weather stations, in Andes region of Venezuela.
0 10 20 30 40 50 60 70 80 90
2113 2129 2144 2151 2167 2186 2195 3023 3035 3052 3074 3089 3108 3115 3135 3161 3195 4014 4027 4050 4059 4082 4091 8052 8057 8072 9006
DFD
a
0 1 2 3 4 5 6 7
2113 2129 2144 2151 2167 2186 2195 3023 3035 3052 3074 3089 3108 3115 3135 3161 3195 4014 4027 4050 4059 4082 4091 8052 8057 8072 9006
O
b
0 1 2 3 4 5
2113 2129 2144 2151 2167 2186 2195 3023 3035 3052 3074 3089 3108 3115 3135 3161 3195 4014 4027 4050 4059 4082 4091 8052 8057 8072 9006
Weather Station
S
c
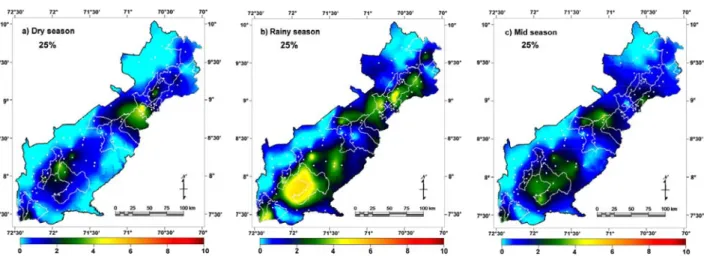
Figure 5 - Maps of probable risk index (PRI), at 25% of probability, for potato late blight in Andes region, Venezuela, for dry, rainy, and mid seasons.
Figure 6 - Maps of probable risk index (PRI), at 50% of probability, for potato late blight in Andes region, Venezuela, for dry, rainy, and mid seasons.
At 25% of probability (Figure 5), the PRI val-ues for dry and mid seasons were no greater than three sprays in the majority of the potato growing areas. How-ever, during the rainy season, PRI increased mainly in Táchira state, achieving five sprays. This was also ob-served at few areas in the south of Trujillo. Considering now the probability of 50% (Figure 6), PRI increased proportionally for all growing seasons, especially dur-ing the rainy one, when more than six sprays were re-quired for many areas in Táchira. Finally, at 75% of probability (Figure 7), PRI ranged from one to five sprays in the dry season, achieving six or seven sprays in few areas at the north of Táchira and Mérida. In the rainy season, all the production areas required between three and seven sprays, while during mid season the re-quirement for late blight control was of three to five sprays.
DISCUSSION
The use of a GIS-linked weather-based disease model is an important contribution of geophytopathology to crop planning and rational control of diseases (Weltzien, 1972). In the present case, this procedure allowed obtaining reliable maps of potato late blight risk for Andes region of Venezuela. According to these maps, the disease risk varied among production areas in the same state, and among states and growing seasons. The state with the highest risk for potato late blight was Táchira, especially during the rainy season, when MRI can achieve 100% in some places. These results agree with those obtained by Hijmans et al. (2000), who con-sidered, in an average global level, all the Andes region of Venezuela as of medium risk for potato late blight, usingSimcast and Blitecastmodels. However, more de-tails about late blight occurrence was observed in our study, since we identified disease risk variability in this region, what was not presented by Hijmans et al. (2000). As fungicides are often used in excess and in high doses in the potato productions areas of Andes re-gion, MRI values also showed that the number of sprays to control potato late blight in Andes region of Venezu-ela could be reduced when a weather-based disease model was used. Nazareno et al. (1999); Costa et al. (2002), and Taylor et al. (2003) have been presenting the valuable contribution of these systems for rational-izing potato late blight control. The possible reduction in the number of sprays, based on the Hyre´s model, was more evident during dry and mid seasons and less during the rainy season. However, even during the rainy season fungicide applications could be reduced in rela-tion to convenrela-tional control in the majority of potato ar-eas. Reduction in the number of fungicides applications may be possible in seasons when meteorological
con-ditions do not favor the disease for long periods of time (Taylor et al., 2003). Even considering the importance of this kind of information for establishing disease risk maps, these results are basically theoretical and must be considered with caution till Hyre´s model and maps presented in our study could be validated for field con-ditions of Andes region of Venezuela.
The probable number of sprays, represented by PRI maps, is also important information for grow-ers and governmental agencies. This is a useful infor-mation for crop planning and optimal disease control in an integrated disease management, since it indicates the probable number of sprays required for control-ling late blight in a given region, contributing to ratio-nalize fungicide use in potatoes. In our study, PRI ranged from one to five sprays in the dry season, achieving six or seven sprays in few areas at the north of Táchira and Mérida. In the rainy season, all the pro-duction areas required between three and seven sprays, while during mid season the requirement for late blight control was of three to five sprays. In all seasons, the number of sprays is much less than the conventional control, in which more than 15 sprays are commonly applied (International Potato Center, 2007). As already mentioned, these findings are just a theoretical approach that must be considered with caution. However, they provide a starting point for field experimentation, lead-ing to more accurate results.
CONCLUSIONS
The highest climatic risk for potato late blight occurrence in the Andes region of Venezuela is during the rainy season, from May to July, decreasing during dry and mid seasons. However, high disease risk vari-ability was observed for all seasons. In Táchira and Trujillo states disease risk was greater than in Mérida State. The maps generated by coupling an agrometeorological disease model and GIS showed to be a useful tool for crop planning and optimal disease management. Also, these maps showed that in great part of potato areas in Andes region would be possible to reduce the number of sprays, contributing to rational-ize fungicide use, leading to less food and environment contamination, reduction of production costs, and safe conditions for field workers. Even considering the im-portance of the findings here presented, the results ob-tained are basically theoretical and must be considered with caution till their validation under field conditions.
REFERENCES
INTERNATIONAL POTATO CENTER. Potato: an opportunity for disease control. 2007. Available at: http://www.cipotato.org/ potato/pests_diseases/late_blight/ Accessed 12 Feb. 2007. COSTA, R.V.; ZAMBOLIM, L.; VALE, F.X.R.; MIZUBUTI, E.S.G.
Previsão da requeima da batateira. Fitopatolologia Brasileira, v.27, p.349-354, 2002.
ESCALANTE, O.M.; FARRERA, P.R. Epidemiologia del Tizón Tardio (Phytophthora infestans Mont de Bray) de la papa en zonas productoras del Estado Táchira, Venezuela.Bioagro, v.16, p.47-54, 2004.
FRY, W.E.; APPLE, A.E.; BRUHN, J.A. Evaluation of potato late blight forescasts modified to incorporate host resistence and fungicide weathering. Phytopathology, v.73, p.1054-1059, 1983.
GARCIA, R. La candelilla de la papa (Phytophthora infestans) en Venezuela. Perfil del país. Estado actual del manejo integrado del Tizón Tárdio (MIP-Tizón) en países Andinos. In: GILB LATIN AMERICA WORKSHOP, 1., Cochabamba, 2001.
Proceedings. Cochabamba: GILB, 2001. p.41-45.
GARCIA, R.; GARCÍA, A. Evaluación de estrategías para el control químico del Tizón Tárdio de la papa en dos localidades del Estado Mérida, Venezuela.Bioagro, v.16, p.77-83, 2004.
GARRET, K.A.; DENDY, S.P. Cultural practices in potato late blight management. In: GILB LATIN AMERICA WORKSHOP, 1., Cochabamba, 2001. Proceedings. Cochabamba: GILB, 2001. p.107-113.
HIJMANS, R.J.; FORBES, G.A.; WALKER, T.S. Estimating the global severity of potato Late Blight with a GIS-Linked Disease forecaster. Plant Pathology, v.49, p.697-705, 2000. HYRE, R.A. Progress in forecasting late blight of potato and
tomato. Plant Disease Reporter, v.38, p.245-253, 1954. KANKWATSA, P.; HAKIZA, J.J.; OLANYA, M.;
KIDENAMARIAM, H.M.; ADIPALA, E. Efficacy of different fungicide spray schedules for controlo f potato late blight in southwestern Uganda. Crop Protection, v.22, p.545-552, 2003.
KIRK, W.W.; ABU-EL SAMEN, F.M.; MUHINYUZA, J.B.; HAMMERCHMIDT, R.; DOUCHES, D.S.; THILL, C.A.; GROZA, H.; THOMPSON, A.L. Evaluation of potato late blight management utilizing host plant resistance and reduced rates and frequencies of fungicide applications. Crop Protection, v.24, p.961-970, 2005.
LOZADA GARCIA, B.I. Risco climático de ocorrência da requeima da batata na região do Andes, Venezuela. Piracicaba: USP/ ESALQ, 2005. 132p. (Doutorado).
LOZADA GARCIA, B.I.; SENTELHAS, P.C.; TAPIA, L.; SPAROVEK, G. Filling in missing rainfall data in the Andes region of Venezuela, based on a cluster analysis approach.
Revista Brasileira de Agrometeorologia, v.14, p.120-126, 2006.
NAZARENO, N.R.X.; SCOTTI, C.A.; MAFIOLETTI, R.L.; BOSCHETTO, N. Controle da requeima da batata através do monitoramento de variáveis climáticas. Fitopatologia Brasileira, v.24, p.170-174, 1999.
PANNATIER, Y. Variowin:software for spatial data analysis in 2D. New York: Springer, 1996. 91p.
TAYLOR, M.C.; HARDWICK, N.V.; BRADSHAW, N.J.; HALL, A.M. Relative performance of five forecasting schemes for potato late blight (Phytophtora infestans) I. Accuracy of infection warnings and reduction of unnecessary, theoretical, fungicide application. Crop Protection, v.22, p.275-283, 2003. WELTZIEN, H.C. Geophytopathology. Annual Reviews, v.10,
p.277-298, 1972.