1s
https://doi.org/10.11606/S1518-8787.2017051007145 Supplement PNAUM-Services
Original Article Rev Saude Publica. 2017;51 Suppl 2:21s
Patient satisfaction with pharmaceutical
services in Brazilian primary health care
Orlando Mario SoeiroI, Noêmia Urruth Leão TavaresII, José Miguel do Nascimento JúniorIII, AugustoAfonso Guerra JuniorIV, Ediná Alves CostaV, Francisco de Assis AcurcioIV, Ione Aquemi GuibuVI, Juliana
ÁlvaresIV, Margô Gomes de Oliveira KarnikowskiVII, Silvana Nair LeiteVIII, Karen Sarmento CostaIX,X,XI
I Faculdade de Ciências Farmacêuticas.Pontifícia Universidade Católica de Campinas. Campinas, SP, Brasil II Departamento de Farmácia. Faculdade de Ciências da Saúde.Universidade de Brasília. Brasília, DF, Brasil III Prefeitura Municipal de Florianópolis. Florianópolis, SC, Brasil
IV Departamento de Farmácia Social. Faculdade de Farmácia. Universidade Federal de Minas Gerais. Belo Horizonte, MG, Brasil
V Instituto de Saúde Coletiva. Universidade Federal da Bahia. Salvador, BA, Brasil
VI Departamento de Saúde Coletiva. Faculdade de Ciências Médicas da Santa Casa de São Paulo. São Paulo, SP, Brasil VII Faculdade de Ceilândia. Universidade de Brasília. Brasília, DF, Brasil
VIII Departamento de Ciências Farmacêuticas. Universidade Federal de Santa Catarina. Florianópolis, SC, Brasil IX Núcleo de Estudos de Políticas Públicas. Universidade Estadual de Campinas. Campinas, SP, Brasil X Programa de Pós-Graduação em Saúde Coletiva. Departamento de Saúde Coletiva. Faculdade de Ciências
Médicas. Universidade Estadual de Campinas. Campinas, SP, Brasil
XI Programa de Pós-Graduação em Epidemiologia. Faculdade de Medicina. Universidade Federal do Rio Grande do Sul. Porto Alegre, RS, Brasil
ABSTRACT
OBJECTIVE: To evaluate patient satisfaction with pharmaceutical services in Brazilian primary health care.
METHODS: his is a cross-sectional, exploratory, and evaluative study on a representative sample from the ive Brazilian geopolitical regions resulting from the Pesquisa Nacional sobre Acesso, Utilização e Promoção do Uso Racional de Medicamentos – Serviços, 2015 (PNAUM – National Survey on Access, Use and Promotion of Rational Use of Medicines – Services, 2015). he outcome was the patient’s satisfaction, obtained using the item response theory. Associations were tested using Pearson’s Chi-square test with sociodemographic and health variables, and multiple logistic regression analyses were carried out. he Hosmer-Lemeshow test was used to verify the adequacy of the inal model. Logistic regression results were presented as odds ratio. RESULTS: The overall percentage of patients satisfied with these services was 58.4% (95%CI 54.4-62.3). The “opportunity/convenience” aspect had the lowest satisfaction percentage (49.5%; 95%CI 46.4-52.6) and “interpersonal aspects,” the highest percentage (90.5%; 95%CI 88.9-91.8), signiicantly higher than other aspects. Sex, age group, limitations due to disease, and self-perception of health remained associated in the inal multiple logistic model regarding general satisfaction.
CONCLUSIONS: Most of the interviewed users were satisied with pharmaceutical services in Brazilian cities, and the satisfaction with the customer’s service was determinant in the patient’s overall satisfaction.
DESCRIPTORS: Patient Satisfaction. Pharmaceutical Services. Primary Health Care. Health Services Research. Uniied Health System.
Correspondence:
Orlando Mario Soeiro Pontifícia Universidade Católica de Campinas
Av. John Boyd Dunlop, s/n Jardim Ipaussurama
13034-685 Campinas, SP, Brasil E-mail: [email protected]
Received: Jul 04, 2016
Approved: Feb 14, 2017
How to cite: Soeiro OM, Tavares NUL, Nascimento Júnior JM, Guerra Junior AA, Costa EA, Acurcio FA, et al. Patient satisfaction with pharmaceutical services in Brazilian primary health care. Rev Saude Publica. 2017;51 Suppl 2:21s.
Copyright: This is an open-access article distributed under the terms of the Creative Commons Attribution License, which permits unrestricted use, distribution, and reproduction in any medium, provided that the original author and source are credited.
2s
Patient satisfaction with pharmaceutical services Soeiro OM et al.
https://doi.org/10.11606/S1518-8787.2017051007145
INTRODUCTION
he evaluation of policies and programs is essential in public health, because it contributes to the eforts towards a healthier society and avoids wasting resources with ineicient programs9,24.
However, when evaluating the efects of a health policy in the services performance and in the general health status of a population, it is necessary to appreciate the synergy between the determinants associated with the health policy, the health services (structures, human resources, and processes), and the state of health and needs of a population9,10,19,25.
Since the creation of the Brazilian Unified Health System (SUS), in 1990, different initiatives toward health evaluation have been developed. At first, surveys were intended to evaluate health services and facilities, and they were almost exclusively developed within universities. Later, the same rationalizing policies that valued planning in healthcare became concerned with the issue of evaluation. In the 1980s, through an integrated scheduling and budgeting and the first state and municipal health plans, the Ações Integradas de Saúde (AIS – Integrated Health Actions) and the Sistemas Unificados e Descentralizados de Saúde (SUDS – Unified and Decentralized Health Systems) also took into account the planning and evaluation16.
In the 1990s, the achievement of the institutionalization of community participation in planning and evaluation processes and the strengthening of social regulation within SUS were important factors to the development of evaluation studies, which assume patients are able to evaluate, intervene, and change the system, according to their own needs12,23.
Despite emphasis given by the new health policies to social regulation in Brazil, listening to the user has not been a common practice in health care. In order for this organizational principle of SUS may be implemented in the everyday activities of health services, along with doctrinal principles of universality, integrality, and equity, the development of researches to analyze, evaluate, and interpret the demands and needs of patients who use these services becomes relevant. To listen to and welcome patients are also ways of ensuring the right to health and citizenship17.
Evaluation of health care in public and private institutions is one of the management tools to constantly improve the quality of service provided. It is an intentional, technical, and political process, but also a social and ethical responsibility. The concern with the quality of the professional-patient relationship becomes a means to an end9 and an end
in itself.
Polysemy in health evaluations is a phenomenon reproduced by many authors in this area. Just as the term “evaluation” has a broad range of meanings, “patient satisfaction” also presents terminological diiculties. Patient satisfaction, according to Linder-Pelz, consists of evaluating diferent aspects of health care, assigned positively and individually by the patient15.
Silva and Formigli20 airm that patient satisfaction is based on “a subjective understanding
the individual has on the care received”. herefore, the degree of satisfaction or dissatisfaction with the health service may refer to the relationship with the health care professional, but also to aspects of service infrastructure (equipment and medicines), amenities (ventilation and comfort), and their representations in the health-disease process20.
Studies showed that satisfied patients usually adhere to the treatment prescribed, provide important information to the health care provider, and continue using health services. It is also mentioned that satisfied patients are more likely to have better a quality of life1,4,6,26-28. In this context, patient satisfaction is considered a goal to be achieved by
3s
Patient satisfaction with pharmaceutical services Soeiro OM et al.
https://doi.org/10.11606/S1518-8787.2017051007145 he Pesquisa Nacional sobre Acesso, Utilização e Promoção do Uso Racional de Medicamentos – Serviços (PNAUM – National Survey on Access, Use and Promotion of Rational Use of Medicines – Services) aimed at characterizing the coordination of pharmaceutical services in the primary health care of SUS, to promote the access and rational use of medicines, as well as to identify and discuss the factors that afect the consolidation of pharmaceutical services in the cities.
his study is part of PNAUM – Services, and aims at evaluating the patient satisfaction with pharmaceutical services in the primary health care of Brazilian cities.
METHODS
PNAUM is a cross-sectional, exploratory, and evaluative study, consisting of a survey on a representative sample of primary health care services of cities from the Brazilian regions. Several study populations were included in the sampling plan, with samples stratiied by Brazilian regions, which comprise the study domains2.
In-person interviews were conducted with patients, doctors and professionals responsible for supplying medicines in SUS primary health care services. In addition, conditions of the pharmaceutical services facilities were observed and telephone interviews to professionals responsible for pharmaceutical services in the cities were conducted. Data was collected between July and December 2014.
PNAUM – Services methodology, as well as the sampling process, are described in detail by Álvares et al.2 he tool has been tested previously and questions from the Long-Form Patient
Satisfaction Questionnaire (PSQ-III), adapted for pharmaceutical services, were used as a reference to create the questions on patient satisfaction13.
Analysis of patient satisfaction in its different aspects was carried out considering the total sample of 8,803 patients, interviewed during data collection. The tool was used by previously trained interviewers and the sampling process was carried out based on the medical consultation schedule of SUS units, per day of the week. Names were listed in alphabetical order and interviews made according to alphabetical order. After this stage, the first patient to be interviewed was identified during a medical consultation of any of the doctors, and the respondent would be the last patient, among those who were already in the unit.
To create the analysis of satisfaction the following aspects of access to medicines were considered: availability (AVAIL), opportunity/convenience (OP/CO), and adequacy. Adequacy aspect was assessed in the following sub-aspects: technical quality of dispensation (QDISP), technical quality of the medicine (QMED), ambiance (AMB), and interpersonal aspects (IA)11.
he dependent variable of the study was patient satisfaction, obtained using the item response theory (IRT)3, considering the variable-answers of six of the evaluated aspects
in patient satisfaction: opportunity/convenience, availability, ambiance, interpersonal aspects, quality of medicines, and quality of dispensation. Questions used for each aspect, as well as their categorization are described in Box. Answers 1 indicated satisfaction and answers 0 indicated dissatisfaction.
he satisfaction rate for the outcome was created, transformed into a scale of 0 to 1, in which values closer to 0 indicated higher dissatisfaction and closer to 1 indicated higher satisfaction. For the variable answer of the analysis, the transformed rate was categorized as less than 0.50 (unhappy) and greater than or equal to 0.50 (satisied). Data analysis was performed using the software SPSS® version 22, considering a complex sample design1. Descriptive analysis
4s
Patient satisfaction with pharmaceutical services Soeiro OM et al.
https://doi.org/10.11606/S1518-8787.2017051007145 Box. Questions considered in the analysis of patient satisfaction with pharmaceutical services in the primary health care, according to aspects and sub-aspects, and categorization for the item response theory model. National Survey on Access, Use and Promotion of Rational Use of Medicines – Services, 2015.
Questions Categorization
Opportunity Aspect
Is this place far from your house? Assume value 1 for the answer “no” and 0 for the answers “yes” and “more or less”.
Arrive at the Health Care Unit “Very easy” and “Easy” received code 1; the answers “neither easy/nor difficult,” “difficult,” and “very difficult” received code 0.
Opening hours of this health care unit “Very good” and “good” received code 1; the answers “neither bad/nor good,” “bad” and “very bad” received code 0.
How long do you usually wait to obtain the medicines in public pharmacies of SUS?
The answers “do not wait” and “a little” received code 1 and the answer “a long time” received 0.
Availability Aspect
Where did you get this medicine the last time?
The answers “Pharmacy of the SUS,” “Popular Pharmacy Program,” or “Church or Union” received code 1 (these answers would be related to
an easier access to medicine, promoting satisfaction) and the answer “Commercial Pharmacy” received code 0.
Did you have any problems to get the medicine the last time? indicated that the patient had problems to get the medicine received code The answers “did not have problems” received code 1 and the answers that 0.
Did you stop taking the medicine for any reasons in the past seven days?
“No” had value 1 and “yes,” value 0. In the case of patients who have taken more than one medicine, if there was a medicine they stopped taking, the
answer would be 0. In the past three months, how often did you get the medicines you
needed in public pharmacies of SUS?
The answers “always” and “repeatedly” received code 1; the answers “sometimes,” “rarely,” and “never” received code 0. Did you have problems remembering to take the medicine?
The answer “no” received code 1 and the answer “yes,” code 0. Did you have problems with the medicines for taking many pills per day?
Did you have problems with the medicines for being hard to obtain? Did you have problems with the medicines because it is hard to read the packaging?
Did you have problems with the medicines because it is hard to adapt their use with your working routines?
Did you have problems with the medicines because there are different medicines with the same shape and colors?
Quality of dispensation sub-aspect
When you obtain the medicines in the public pharmacies of SUS, do the public employees who deliver the medicines give you information about
their use? The answer “yes” received code 1; the answers “sometimes” and “no,” code 0.
Do you understand the information given by employees who deliver the
medicines in the public pharmacies of SUS? The answers “always” and “repeatedly” received code 1; the answers “sometimes,” “rarely,” and “never” received code 0. Is the pharmacist or another employee from the public pharmacy of SUS
available when you need to ask questions about the medicines?
Quality of medicines sub-aspect
The answer “well” received code 1; the answers “regular” and “does not work well” received code 0. In the case of patients who have taken more than one medicine, if there was a medicine they thought was working neither good nor
badly or was not working well, the answer would be 0.
In your opinion, is this medicine causing you any health problems? who have taken more than one medicine, if there was a medicine that caused The answer “no” received code 1 and “yes,” code 0. In the case of patients them any health problems, the answer would be 0.
For you, the effects of medicines obtained in public pharmacies of SUS
compared to the effects of medicines bought in commercial pharmacies are: “The same” and “better” received code 1 and “worse,” code 0. When you obtain medicines in public pharmacies of SUS, do you
receive information on how to store them at home? The answers “always” and “repeatedly” received code “sometimes,” “rarely,” and “never” received code 1; the answers 0. Ambiance Sub-aspect
How do you evaluate the wall signs to find the public pharmacy of SUS? “Very easy” and “easy” received code difficult,” “difficult,” and “very difficult” received code 1, the answers “neither easy/nor 0.
How do you evaluate the cleanliness of the public pharmacy of SUS? The answers “very good” and “good” received code “neither bad/nor good,” “bad,” and “very bad” received code 1 and the answers 0. How do you evaluate the comfort in the public pharmacy of SUS? The answers “very good” and “good” received code 1 and the answers
“neither bad/nor good,” “bad,” and “very bad” received code 0. How do evaluate the service of the public pharmacy of SUS?
Interpersonal aspects sub-aspect
Is the personnel of the public pharmacy of SUS respectful and polite?
The answers “always” and “frequently” received code 1, and the answers “sometimes,” “rarely,” and “never” received code 0.
Do you consider that the service provided at the pharmacy of SUS respects your privacy?
How do you evaluate the service of the public pharmacy of SUS? The answers “very good” and “good” received code “neither bad/nor good,” “bad,” and “very bad” received code 1, and the answers 0. SUS: Brazilian Unified Health System
5s
Patient satisfaction with pharmaceutical services Soeiro OM et al.
https://doi.org/10.11606/S1518-8787.2017051007145 he resulting assotiations were tested and categorized through the Pearson’s Chi-square test, with the following independent variables: sex, age range, marital status, skin color, education, economic classiication according to the Associação Brasileira de Empresas de Pesquisa (ABEP – Brazilian Association of Research Enterprisesa), region of residence, having health insurance, patient of SUS, number of hospitalizations in the past 12 months, number of emergency services required in the past 12 months, self-perception of health, number of chronic diseases, limitations due to diseases, pain and discomfort, anxiety and depression, and number of medicines used.
Variables with p<0.2 were included in the multiple logistic model, in which only those with p < 0.05 remained. Logistic regression results were displayed as odds ratio with their respective 95%CI. he Hosmer-Lemeshow test was used to assess the adequacy of the inal model.
PNAUM was approved by the National Research Ethics Committee of the National Health Council, under Opinion no. 398,131/2013. All participants signed the informed consent form.
RESULTS
he overall percentage of patients who were satisied with the pharmaceutical services in primary health care was 58.4% (95%CI 54.4–62.3). When analyzing patient satisfaction in each aspect evaluated, we observed the lowest percentage of satisfaction for the opportunity/convenience aspect (49.5%; 95%CI 46.4–52.6) and the highest for interpersonal aspects (90.5%; 95%CI 88.9–91.8), signiicantly higher than other aspects. We also observed similar satisfaction rates for opportunity/convenience, availability, and ambiance. he satisfaction rate for the quality of medicines and the quality of dispensation presented similar satisfaction rates (Box).
Regarding the variables concerning opportunity, patients reported higher satisfaction with the units’ opening hours (85.7%) and with waiting time to obtain their medicines (95%). Regarding availability, most patients (65.1%) said they did not have problems the last time they obtained their medicines and 67% obtained the medicines they needed in the Popular Pharmacy Program of SUS during the past three months (Figure).
a Associação Brasileira de Empresas de Pesquisa. Critério de classificação econômica Brasil: alterações na aplicação do Critério Brasil, válida a partir de 01/01/2014. São Paulo: ABEP; 2014 [cited 2016 Mar 1]. Available from: www.abep.org/ Servicos/Download.aspx?id=01
OP/CO: opportunity/convenience; AVAIL: availability; AMB: ambiance; IA: interpersonal aspects; QMED: quality of medicines; QDISP: quality of dispensation; OVERALL: overall satisfaction
Figure. Proportion of patients satisfied with pharmaceutical services in primary health care according to the aspects and sub-aspects. National Survey on Access, Use and Promotion of Rational Use of Medicines – Services, 2015.
Aspects
%
100
90
80
70
60
50
40
6s
Patient satisfaction with pharmaceutical services
Soeiro OM et al.
https://doi.org/10.11606/S1518-8787.2017051007145
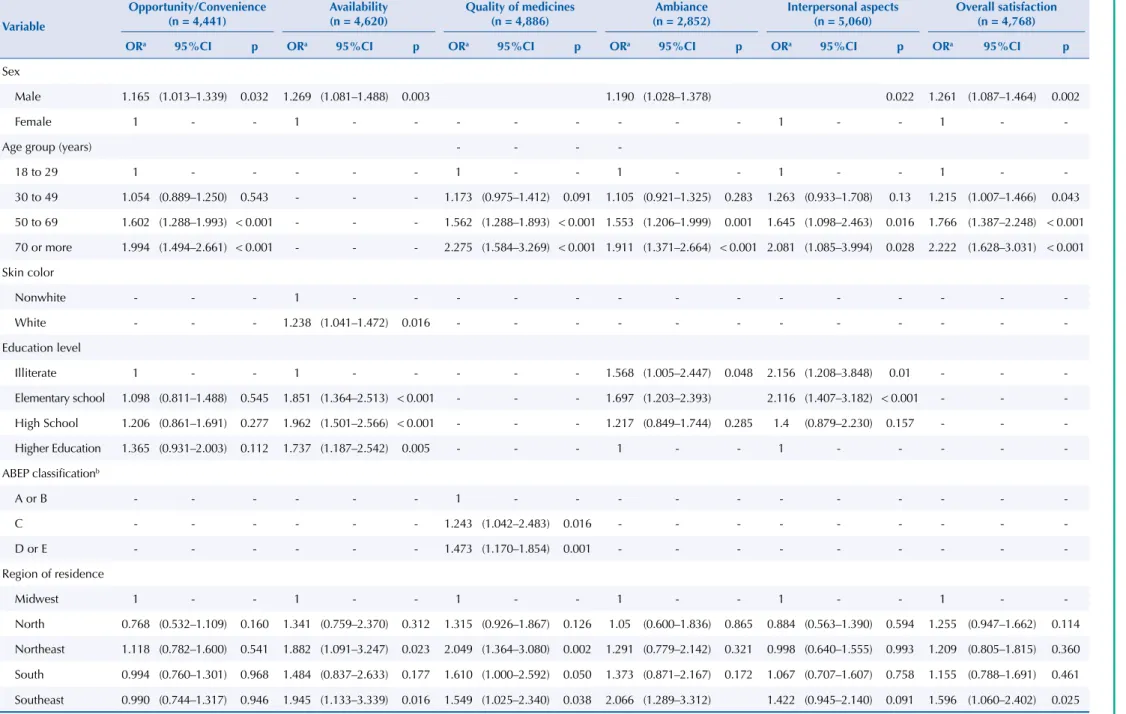
Table 1. Multiple logistic model of patient satisfaction with pharmaceutical services in the primary health care regarding the aspects, sub-aspects, and overall satisfaction, according to
sociodemographic characteristics. National Survey on Access, Use and Promotion of Rational Use of Medicines – Services, 2015.
Variable
Opportunity/Convenience (n = 4,441)
Availability (n = 4,620)
Quality of medicines (n = 4,886)
Ambiance (n = 2,852)
Interpersonal aspects (n = 5,060)
Overall satisfaction (n = 4,768)
ORa 95%CI p ORa 95%CI p ORa 95%CI p ORa 95%CI p ORa 95%CI p ORa 95%CI p
Sex
Male 1.165 (1.013–1.339) 0.032 1.269 (1.081–1.488) 0.003 1.190 (1.028–1.378) 0.022 1.261 (1.087–1.464) 0.002
Female 1 - - 1 - - - 1 - - 1 -
-Age group (years) - - -
-18 to 29 1 - - - 1 - - 1 - - 1 - - 1 -
-30 to 49 1.054 (0.889–1.250) 0.543 - - - 1.173 (0.975–1.412) 0.091 1.105 (0.921–1.325) 0.283 1.263 (0.933–1.708) 0.13 1.215 (1.007–1.466) 0.043
50 to 69 1.602 (1.288–1.993) < 0.001 - - - 1.562 (1.288–1.893) < 0.001 1.553 (1.206–1.999) 0.001 1.645 (1.098–2.463) 0.016 1.766 (1.387–2.248) < 0.001
70 or more 1.994 (1.494–2.661) < 0.001 - - - 2.275 (1.584–3.269) < 0.001 1.911 (1.371–2.664) < 0.001 2.081 (1.085–3.994) 0.028 2.222 (1.628–3.031) < 0.001
Skin color
Nonwhite - - - 1 - - -
-White - - - 1.238 (1.041–1.472) 0.016 - - -
-Education level
Illiterate 1 - - 1 - - - 1.568 (1.005–2.447) 0.048 2.156 (1.208–3.848) 0.01 - -
-Elementary school 1.098 (0.811–1.488) 0.545 1.851 (1.364–2.513) < 0.001 - - - 1.697 (1.203–2.393) 2.116 (1.407–3.182) < 0.001 - -
-High School 1.206 (0.861–1.691) 0.277 1.962 (1.501–2.566) < 0.001 - - - 1.217 (0.849–1.744) 0.285 1.4 (0.879–2.230) 0.157 - -
-Higher Education 1.365 (0.931–2.003) 0.112 1.737 (1.187–2.542) 0.005 - - - 1 - - 1 - - - -
-ABEP classificationb
A or B - - - 1 - - -
-C - - - 1.243 (1.042–2.483) 0.016 - - -
-D or E - - - 1.473 (1.170–1.854) 0.001 - - -
-Region of residence
Midwest 1 - - 1 - - 1 - - 1 - - 1 - - 1 -
-North 0.768 (0.532–1.109) 0.160 1.341 (0.759–2.370) 0.312 1.315 (0.926–1.867) 0.126 1.05 (0.600–1.836) 0.865 0.884 (0.563–1.390) 0.594 1.255 (0.947–1.662) 0.114
Northeast 1.118 (0.782–1.600) 0.541 1.882 (1.091–3.247) 0.023 2.049 (1.364–3.080) 0.002 1.291 (0.779–2.142) 0.321 0.998 (0.640–1.555) 0.993 1.209 (0.805–1.815) 0.360
South 0.994 (0.760–1.301) 0.968 1.484 (0.837–2.633) 0.177 1.610 (1.000–2.592) 0.050 1.373 (0.871–2.167) 0.172 1.067 (0.707–1.607) 0.758 1.155 (0.788–1.691) 0.461
Southeast 0.990 (0.744–1.317) 0.946 1.945 (1.133–3.339) 0.016 1.549 (1.025–2.340) 0.038 2.066 (1.289–3.312) 1.422 (0.945–2.140) 0.091 1.596 (1.060–2.402) 0.025
a Significant variables at the 5% level after adjusted analysis.
b Brazil Economic Classification Criteria – Brazilian Market Research Association – ABEP 2013 – www.abep.org
7s
Patient satisfaction with pharmaceutical services
Soeiro OM et al.
https://doi.org/10.11606/S1518-8787.2017051007145
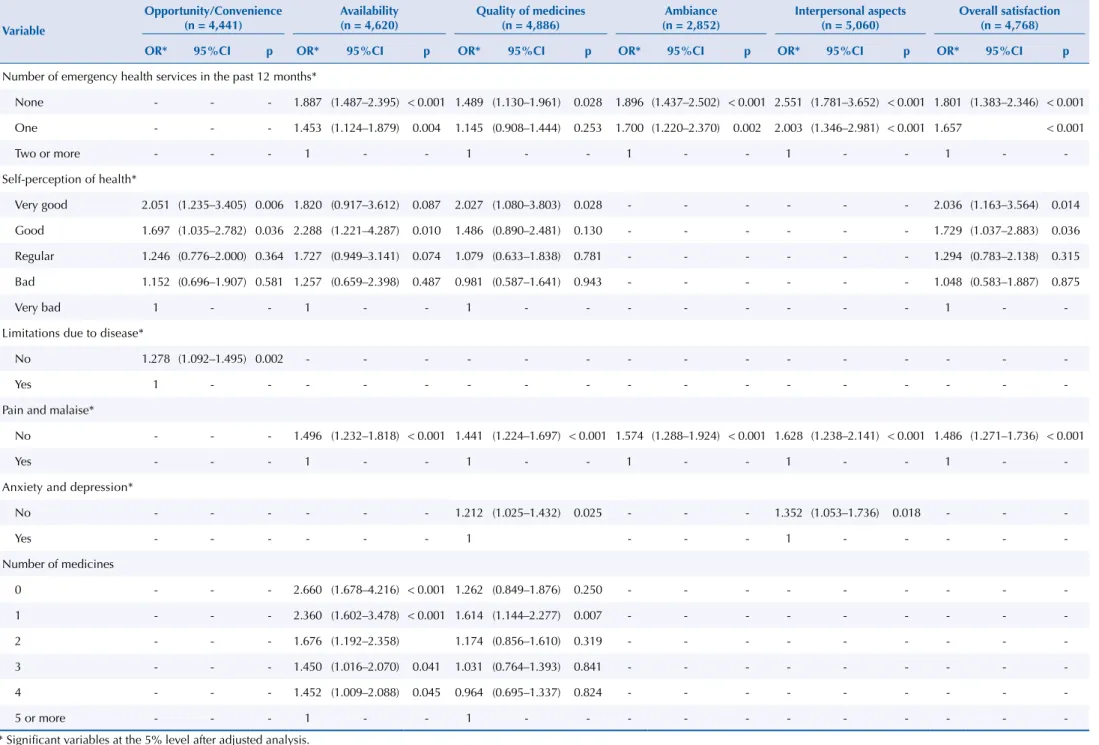
Table 2. Multiple logistic model of patient satisfaction with pharmaceutical services in the primary health care regarding the aspects, sub-aspects, and overall satisfaction, according to health
and service use characteristics. PNAUM – Services, Brazil 2015.
Variable
Opportunity/Convenience (n = 4,441)
Availability (n = 4,620)
Quality of medicines (n = 4,886)
Ambiance (n = 2,852)
Interpersonal aspects (n = 5,060)
Overall satisfaction (n = 4,768)
OR* 95%CI p OR* 95%CI p OR* 95%CI p OR* 95%CI p OR* 95%CI p OR* 95%CI p
Number of emergency health services in the past 12 months*
None - - - 1.887 (1.487–2.395) < 0.001 1.489 (1.130–1.961) 0.028 1.896 (1.437–2.502) < 0.001 2.551 (1.781–3.652) < 0.001 1.801 (1.383–2.346) < 0.001
One - - - 1.453 (1.124–1.879) 0.004 1.145 (0.908–1.444) 0.253 1.700 (1.220–2.370) 0.002 2.003 (1.346–2.981) < 0.001 1.657 < 0.001
Two or more - - - 1 - - 1 - - 1 - - 1 - - 1 -
-Self-perception of health*
Very good 2.051 (1.235–3.405) 0.006 1.820 (0.917–3.612) 0.087 2.027 (1.080–3.803) 0.028 - - - 2.036 (1.163–3.564) 0.014
Good 1.697 (1.035–2.782) 0.036 2.288 (1.221–4.287) 0.010 1.486 (0.890–2.481) 0.130 - - - 1.729 (1.037–2.883) 0.036
Regular 1.246 (0.776–2.000) 0.364 1.727 (0.949–3.141) 0.074 1.079 (0.633–1.838) 0.781 - - - 1.294 (0.783–2.138) 0.315
Bad 1.152 (0.696–1.907) 0.581 1.257 (0.659–2.398) 0.487 0.981 (0.587–1.641) 0.943 - - - 1.048 (0.583–1.887) 0.875
Very bad 1 - - 1 - - 1 - - - 1 -
-Limitations due to disease*
No 1.278 (1.092–1.495) 0.002 - - -
-Yes 1 - - -
-Pain and malaise*
No - - - 1.496 (1.232–1.818) < 0.001 1.441 (1.224–1.697) < 0.001 1.574 (1.288–1.924) < 0.001 1.628 (1.238–2.141) < 0.001 1.486 (1.271–1.736) < 0.001
Yes - - - 1 - - 1 - - 1 - - 1 - - 1 -
-Anxiety and depression*
No - - - 1.212 (1.025–1.432) 0.025 - - - 1.352 (1.053–1.736) 0.018 - -
-Yes - - - 1 - - - 1 - - - -
-Number of medicines
0 - - - 2.660 (1.678–4.216) < 0.001 1.262 (0.849–1.876) 0.250 - - -
-1 - - - 2.360 (1.602–3.478) < 0.001 1.614 (1.144–2.277) 0.007 - - -
-2 - - - 1.676 (1.192–2.358) 1.174 (0.856–1.610) 0.319 - - -
-3 - - - 1.450 (1.016–2.070) 0.041 1.031 (0.764–1.393) 0.841 - - -
-4 - - - 1.452 (1.009–2.088) 0.045 0.964 (0.695–1.337) 0.824 - - -
-5 or more - - - 1 - - 1 - - -
8s
Patient satisfaction with pharmaceutical services Soeiro OM et al.
https://doi.org/10.11606/S1518-8787.2017051007145 Regarding ambiance, patients evaluated hygiene (90.9%) and comfort (74.2%) as satisfactory. Regarding the quality of medicines, the vast majority (87%) evaluated that the medicine was properly working for their disease and considered the medicines obtained in pharmacies of the SUS equal to or better than medicines bought at other pharmacies (93.2%).
As for dispensation, 78.7% of patients reported that they received information about the use of medicines and 94.8% said they understood the information. As for interpersonal aspects, patients have evaluated the service (90.5%) and the respectful and polite service (93.1%) as satisfactory (data not presented in table).
Regarding overall patient satisfaction, only the variables sex, age range, limitation due to diseases, and self-perception of health remained in the inal multiple logistic model.
The following aspects were significantly associated with the highest overall patient satisfaction: being a male; being 30 years old or more, compared to the 18–29 age group; living in the Southeast region, compared to residents of the Midwest region; considering his own health very good or good, compared to those who consider it very bad; needing a maximum of one emergency service in the past 12 months, compared to those who needed two or more; and not feeling pain and malaise (Tables 1 and 2).
In the sub-aspect of technical quality of dispensation, it was not possible to obtain a multiple model, because despite variables signiicance, there was not a combination that would generate a proper adjustment. hus, the evaluation of satisfaction in this sub-aspect was carried out using only a bivariate analysis and signiicantly associated with sex, marital status, skin color, education, patient of SUS, number of medical consultations in the past 12 months, and anxiety and depression (data not presented in table).
DISCUSSION
Most interviewed patients were satisied with pharmaceutical services in primary health care in the cities. Satisfaction with the service was a relevant factor in the overall patient satisfaction.
Literature shows that interpersonal quality of care is a determinant factor for patient satisfaction5. Opportunity/convenience had the smallest satisfaction level, which suggests
the necessity of rethinking the structure where the services are provided. his will contribute even more to increase satisfaction with ambiance and with items regarding patient safety.
Studies showed an association between continuous care and patient satisfaction7,18. he degree
of satisfaction found may be explained by the structure of SUS, which promotes continuous care, especially to patients with chronic conditions, such as hypertension and diabetes. he degree of satisfaction of most patients for pharmaceutical services in primary health care suggests that implemented phamaceutical policies have made possible the creation of a capillary service network at a local sphere to ofer these services to the population who attend the SUS. According to analysis carried out by IRT, a methodological strategy that considered each item particularly without revealing total scores, the conclusions do not depend exclusively on the questionnaire, but on each item. IRT enables a new proposal for statistical analysis centered on each item, a perspective that transcends the limitations of classical theory, in which the model for scale construction is based directly on the result obtained from the tool as a whole3.
9s
Patient satisfaction with pharmaceutical services Soeiro OM et al.
https://doi.org/10.11606/S1518-8787.2017051007145 Regarding sex, most respondents are female, which alludes to the belief that self-care and care for others are values associated with femininity, linked to the lower labor force participation rate of women in our society14. However, satisfaction is strongly associated with men, which
is consistent with the literature that shows services receiving more criticism from women, who are thus good informants for surveys11.
Patients 30 years or older are more satisied with pharmaceutical services, which corroborates the indings in the literature according to which older age groups have less expectations in relation to services12.
Regarding the region of the Country, we observed that patients from the Southeast region were more satisied with pharmaceutical services than patients from other regions. Such data suggests that in more developed regions, such as the Southeast and South regions, the primary health network would be more organized, as well as provides a better ofer of health services and, in this case, pharmaceutical services8.
As expected, the patient’s current state of health may potentially afect the degree of patient satisfaction with health services and, in the case of this study, pharmaceutical services, not only by the severity of case, but also by physical, psychological, social, or mental limitations due to disease12.
his can help to explain how patient satisfaction is associated with those who received up to one emergency service, compared to those who received two or more. Likewise, in health self-perception, patient satisfaction is associated with those who consider their health very good and good, compared to those who consider their health regular, bad, or very bad. Regarding the state of health, it is associated with patient satisfaction, among those who do not feel pain and discomfort to the detriment of those who feel it.
In summary, satisfaction with services is not itself a measure of health care quality. It may be, however, indirectly associated with quality, since it can inluence the search for determined kinds of services, which afect the state of health21.
herefore, for a better understanding of the results, it is necessary to identify and analyze associated factors, not considered in this survey, e.g., sociodemographic, behavioral and cultural diferences that afect patient satisfaction5,9.
In this sense, the patient satisfaction survey brings health services and the community closer, because it increases awareness about these patients’ needs23.
Another limitation of this study is related to the scarcity of publications about the evaluation and satisfaction with pharmaceutical services in the SUS, which made it diicult to establish comparisons among the results obtained.
Patient satisfaction with pharmaceutical services in primary health care was satisfactory. Diferences found among evaluated dimensions, however, show gaps in the quality of services ofered. In Brazil, the assessment of pharmaceutical services is in its early stages, which shows the necessity of making PNAUM the baseline to evaluate whether pharmaceutical services meet the patient’s needs. It is expected that the results obtained would foster actions directed to the development of pharmaceutical services in the country.
REFERENCES
1. Aharony L, Strasser S. Patient satisfaction: what we know about and what we still need to
explore. Med Care Rev. 1993;50(1):49-79.
2. Álvares J, Alves MCGP, Escuder MML, Almeida AM, Izidoro JB, Guerra Junior AA, et al. Pesquisa Nacional sobre Acesso, Utilização e Promoção do Uso Racional de Medicamentos: métodos.
10s
Patient satisfaction with pharmaceutical services Soeiro OM et al.
https://doi.org/10.11606/S1518-8787.2017051007145
3. Araujo EAC, Andrade DF, Bortolotti SLV. Teoria de Resposta ao Item. Rev Esc Enferm USP.
2009;43 Nº Espec:1000-8. https://doi.org/10.1590/S0080-62342009000500003
4. Baron-Epel O, Dushenat M, Friedman N. Evaluation of the consumer model: relationship between patient’s expectations, perception and satisfaction with care. Int J Qual Health Care. 2001;13(4):317-23. https://doi.org/10.1093/intqhc/13.4.317
5. Batbaatar E, Dorjdagva J, Luvsannyam A, Savino MM, Amenta P. Determinants of patient satisfaction: a systematic review. Perspect Public Health. 2016 Mar 22. https://doi.org/10.1177/1757913916634136
6. Bernhart MH, Wiadnyana IGP, Wihardjo H, Pohan I. Patient satisfaction in developing countries.
Soc Sci Med. 1999;48(8):989-96. https://doi.org/10.1016/S0277-9536(98)00376-1
7. Cabana MD, Jee SH. Does continuity of care improve patient outcomes? J Fam Pract. 2004 [cited
2017 Feb 21];53(12):974- 80. Available from: http://www.hpm.org/Downloads/Bellagio/Articles/ Continuity/Cabana_MD_-_2004_-_Does_continuity_of_care_improve_patient_outcomes.pdf 8. Costa KS, Francisco PMSB, Barros MBA. Utilização e fontes de obtenção de medicamentos:
um estudo de base populacional no Município de Campinas, São Paulo, Brasil. Cad Saude
Publica. 2016;32(1):e00067814. https://doi.org/10.1590/0102-311X00067814
9. Dias OV, Ramos LH, Costa SM. Avaliação da qualidade dos serviços de saúde na perspectiva
da satisfação dos usuários. Rev Pro-Univer SUS. 2010 [cited 2017 Feb 21];1(1):11-26.
Available from: http://www.uss.br/pages/revistas/revistaprouniversus/artigos/2-Avaliacao-da-qualidade-servicos.pdf
10. Donabedian A. The effectiveness of quality assurance. Int J Qual Health Care. 1996;8(4):401-7.
https://doi.org/10.1093/intqhc/8.4.401
11. Esher A, Santos EM, Magarinos-Torres R, Azeredo TB. Construindo Critérios de Julgamento em Avaliação: especialistas e satisfação dos usuários com a dispensação do tratamento do HIV/Aids.
Cienc Saude Coletiva. 2012;17(1):203-14. https://doi.org/10.1590/S1413-81232012000100022
12. Esperidião MA, Trad LAB. Avaliação de satisfação de usuários:
considerações teórico-conceituais. Cad Saude Publica. 2006;22(6):1267-76.
https://doi.org/10.1590/S0102-311X2006000600016
13. Fracolli LA, Gomes MFP, Nabão FRZ, Santos MS, Cappellini VK, Almeida ACC. Primary health care assessment tools: a literature review and metasynthesis. Cienc Saude Coletiva. 2014;19(12):4851-60. https://doi.org/10.1590/1413-812320141912.00572014
14. Kitamura ES, Bastos RR, Palma PV, Leite ICG. Avaliação da satisfação dos usuários dos Centros de Especialidades Odontológicas da macrorregião Sudeste de Minas Gerais, 2013.
Epidemiol Serv Saude. 2016;25(1):137-48. https://doi.org/10.5123/s1679-49742016000100014
15. Linder-Pelz S. Toward a theory of patient satisfaction. Soc Sci Med. 1982;16(5):577-82. https://doi.org/10.1016/0277-9536(82)90311-2
16. Paim JS. Avaliação em saúde: uma prática em construção no Brasil. In: Hartz ZMA, Silva LMV, organizadoras. Avaliação em saúde: dos modelos teóricos à prática de programas e sistemas de saúde. Salvador: EDUFBA; Rio de Janeiro: Fiocruz; 2005. p.9-10.
17. Pereira MJB. Avaliação das características organizacionais e de desempenho das unidades de atenção básica em saúde do distrito oeste do município de Ribeirão Preto [tese]. Ribeirão Preto: Escola de Enfermagem de Ribeirão Preto da Universidade de São Paulo; 2008.
18. Saultz JW, Albedaiwi W. Interpersonal continuity of care and patient satisfaction: a critical
review. Ann Fam Med. 2004;2(5):445-51. https://doi.org/10.1370/afm.91
19. Shaw M, Tunstall H, Smith GD. Seeing social position: visualizing class in life and death.
Int J Epidemiol. 2003;32(3):332-5. https://doi.org/10.1093/ije/dyg176
20. Silva LMV, Formigli VLA. Avaliação em saúde: limites e perspectivas. Cad Saude Publica.
1994;10(1):80-91. https://doi.org/10.1590/S0102-311X1994000100009
21. Starfield B. Atenção primária: equilíbrio entre necessidades de saúde, serviços e tecnologia. Brasília (DF): UNESCO, Ministério da Saúde; 2002.
22. Tahan-Santos E. Estratégia Saúde da Família: satisfação de usuários [dissertation].
Ribeirão Preto: Faculdade de Filosofia, Ciências e Letras de Ribeirão Preto da Universidade de São Paulo; 2011.
23. Trad LAB, Bastos ACS, Santana EM, Nunes MO. Estudo etnográfico da satisfação do usuário
do Programa de Saúde da Família (PSF) na Bahia. Cienc Saude Coletiva. 2002;7(3):581-9.
11s
Patient satisfaction with pharmaceutical services Soeiro OM et al.
https://doi.org/10.11606/S1518-8787.2017051007145
24. Vaitsman J, Andrade GRB. Satisfação e responsividade: formas de medir a qualidade
e a humanização da assistência à saúde. Cienc Saude Coletiva. 2005;10(3):599-613.
http://dx.doi.org/10.1590/S1413-81232005000300017
25. Viacava F, Almeida C, Caetano R, Fausto M, Macinko J, Martins M, et al. Uma metodologia
de avaliação do desempenho do sistema de saúde brasileiro. Cienc Saude Coletiva.
2004;9(3):711-24. https://doi.org/10.1590/S1413-81232004000300021 26. Ware JE, Snyder MK, Wright WR, Davies AR. Defining and measuring patient
satisfaction with medical care. Eval Program Plann. 1983;6(3-4):247-63.
https://doi.org/10.1016/0149-7189(83)90005-8
27. Weiss GL. Patient satisfaction with primary medical care: evaluation of
sociodemographic and predispositional factor. Med Care. 1988;26(4):383-92.
https://doi.org/10.1097/00005650-198804000-00007
28. Zastowny TR, Roghmann KJ, Cafferata GL. Patient satisfaction and the use of health services:
explorations in causality. Med Care. 1989 [cited 2017 Feb 21]; 27(7):705-23. Available from:
http://www.jstor.org/stable/3765275
Funding: Department for Pharmaceutical Services and Strategic Health Supplies and Department of Science and Technology of the Secretariat of Science, Technology and Strategic Supplies of the Brazilian Ministry of Health (SCTIE/MS – Process 25000.111834/2, Decentralization of FNS Resources).
Authors’ Contribution: Conception, analysis, and interpretation of results and critical review of the content: OMS, KSC, NULT. All authors participated in the writing, approved the inal version of the manuscript, and declare to be responsible for all aspects of the study, ensuring its accuracy and completeness.
Acknowledgements: To the Departments of Science and Technology (DECIT) and of Pharmaceutical Services (DAF) of the Secretariat of Science, Technology, and Strategic Supplies (SCTIE) of the Brazilian Ministry of Health
(MS), for funding and technical support in the execution of the National Survey on Access, Use and Promotion
of Rational Use of Medicines.