Correspondence:
Marina Guimarães Lima Departamento de Farmácia Social Faculdade de Farmácia,
Universidade Federal de Minas Gerais Av. Pres. Antônio Carlos, 6627 – Pampulha 31270-901
Belo Horizonte, MG, Brasil Email: [email protected]
Received: Apr 30, 2016
Approved: Jan 30, 2017
How to cite: Lima MG, Álvares J, Guerra Junior AA, Costa EA, Guibu IA, Soeiro OM, et al. Indicators related to the rational use of medicines and its associated factors. Rev Saude Publica. 2017;51 Suppl 2:23s
Copyright: This is an open-access article distributed under the terms of the Creative Commons Attribution License, which permits unrestricted use, distribution, and reproduction in any medium, provided that the original author and source are credited.
http://www.rsp.fsp.usp.br/
Indicators related to the rational use of
medicines and its associated factors
Marina Guimarães LimaI, Juliana Álvares I, Augusto Afonso Guerra JuniorI,
Ediná Alves CostaII, Ione Aquemi GuibuIII, Orlando Mario SoeiroIV, Silvana Nair LeiteV,
Margô Gomes de Oliveira KarnikowskiVI, Karen Sarmento CostaVII,VIII,IX, Francisco de Assis AcurcioI
I Departamento de Farmácia Social. Faculdade de Farmácia. Universidade Federal de Minas Gerais.
Belo Horizonte, MG, Brasil
II Instituto de Saúde Coletiva. Universidade Federal da Bahia. Salvador, BA, Brasil
III Departamento de Saúde Coletiva. Faculdade de Ciências Médicas. Santa Casa de São Paulo. São Paulo, SP, Brasil IV Faculdade de Ciências Farmacêuticas.Pontifícia Universidade Católica de Campinas. Campinas, SP, Brasil V Departamento de Ciências Farmacêuticas. Universidade Federal de Santa Catarina. Florianópolis, SC, Brasil VI Faculdade de Ceilândia. Universidade de Brasília. Brasília, DF, Brasil
VII Núcleo de Estudos de Políticas Públicas. Universidade Estadual de Campinas. Campinas, SP, Brasil VIII Programa de Pós-Graduação em Saúde Coletiva. Departamento de Saúde Coletiva. Faculdade de Ciências
Médicas. Universidade Estadual de Campinas. Campinas, SP, Brasil
IX Programa de Pós-Graduação em Epidemiologia. Faculdade de Medicina. Universidade Federal do Rio Grande do Sul.
Porto Alegre, RS, Brasil
ABSTRACT
OBJECTIVE: To evaluate indicators related to the rational use of medicines and its associated factors in Basic Health Units.
METHOD: his is a cross-sectional study carried out in a representative sample of Brazilian
cities included in the Pesquisa Nacional sobre Acesso, Utilização e Promoção do Uso Racional de Medicamentos – Serviços, 2015 (PNAUM – National Survey on Access, Use and Promotion of Rational Use of Medicines – Services, 2015). he data were collected by interviews with users, medicine dispensing professionals, and prescribers; and described by prescription, dispensing, and health services indicators. We analyzed the association between human resources characteristics of pharmaceutical services and dispensing indicators.
RESULTS: At national level, the average number of medicines prescribed was 2.4. Among the users, 5.8% had antibiotic prescription, 74.8% received guidance on how to use the medicines at the pharmacy and, for 45.1% of users, all prescribed medicines were from the national list of essential medicines. All the indicators presented statistically signiicant diferences between the regions of Brazil. he dispensing professionals that reported the presence of a pharmacist in the unit with a working load of 40 hours or more per week presented 1.82 more chance of transmitting information on the way of using the medicines in the dispensing process.
CONCLUSION: he analysis of prescription, dispensing, and health services indicators in the basic health units showed an unsatisfactory proportion of essential medicines prescription and limitations in the correct identiication of the medicine, orientation to the patients on medicines, and availability of therapeutic protocols in the health services.
INTRODUCTION
Rational use of medicines requires users to use the appropriate medicine for their clinical condition in doses that meet their individual health needs, during an appropriate period and at the lowest cost to themselves and the community20.
he non-rational use of medicines may have a negative impact on population health, including avoidable adverse events and microbial resistance24. Adverse medicine events
are estimated to account for 3.5% of hospital admissions6. According to one study, the occurrence of these events resulted in health services expenditure of about $ 21 million per 100,000 adult population11
.
he evaluation of the activities of Pharmaceutical Services (PS) is fundamental to promote the access and rational use of medicines. To assist in the PS evaluation, the World Health Organization (WHO) has developed indicators that can be used reproducibly so that methods are reliable and comparable across diferent studies and locations15. According to a document
published in 2007, PS monitoring and evaluation can be performed at three levels. Level I concerns aspects of structure and organization process of the pharmaceutical industry. Level II targets the results of the national drug policy and is measured in public and private services and in households, in addition to the domains of access, quality, and rational use of medicines. he evaluation is conducted by a survey based on visits to state and municipal pharmacy supply centers; to public health units that perform ambulatory care and dispensing of medicines; and to private pharmacies of retail trade, being adaptable to the type of study that will be conducted. Level III details speciic aspects of the organization of the pharmaceutical sector23
.
According to a systematic review involving 900 studies conducted in 104 countries, the analysis of indicators on the rational use of medicines indicated that the inappropriate use of pharmaceuticals remains a public health problem12. his review included studies performed
in public primary health care services. A similar scenario was observed in a multicenter study conducted in Brazil in 2004, which observed 40.1% of antibiotic prescriptions, 6.9% of injectable medicines, and 78.3% of medicines present in the list of essential medicines9,16.
To evaluate the rational use of medicines in Brazil, current data are needed, from a representative sample of the Brazilian population that uses Unidades Básicas de Saúde
(UBS – Basic Health Units).
he Pesquisa Nacional sobre Acesso, Utilização e Promoção do Uso Racional de Medicamentos – Serviços (PNAUM – National Survey on Access, Use and Promotion of Rational Use of
Medicines – Services) aimed to characterize the organization of pharmaceutical services in the primary care of the Brazilian Uniied Health System (SUS) – to promote the access and rational use of medicines –, as well as to identify and discuss the factors that interfere in the consolidation of pharmaceutical services in the cities.
his study integrates PNAUM – Services and aims to evaluate indicators related to the
rational use of medicines in the UBS and its associated factors.
METHODS
his study is part of PNAUM – Services, a cross-sectional, exploratory, evaluative study, composed of a survey of information in a representative sample of cities, primary health care services, users, physicians, and professionals responsible for dispensing of medicines in the ive regions of Brazil. he sampling plan considered the several study populations and estimated the various sample sizes for each of these populations1. he sample size was estimated by algebraic
expressiona. he sample sizes adopted in each region were 120 municipalities, 300 health services, and 1,800 users. he sample was stratiied in capitals (26 and the Federal District); biggest cities (0.5% biggest cities in the region, totaling 27) and smallest cities (546 cities chosen by lot). From these 120 selected municipalities, 60 were selected by region, totaling 300 in the a The sample was estimated
by the algebraic expression
n
0 = .deff
P(1-p)
(d/z)2 , where:
country, in which the health services were chosen by lot. Health posts, health centers or UBS, and mixed units were included in the lot, according to the Cadastro Nacional de Estabelecimentos de Saúde (CNES – National Register of Health Establishments).
Face-to-face interviews were conducted with users, physicians, and those responsible for dispensing of medicines in the primary health care services, as well as telephone interviews with those responsible for pharmaceutical services in the cities, using a structured questionnaire speciic to each category. he observation of the facilities of pharmaceutical services and availability of medicines were veriied by observation script. A manual and a glossary of technical terms were developed for each research instrument. After the training of the interviewers, a pretest was carried out, involving cities with diferent population sizes, aiming to validate and improve the instruments. he data were collected from July 2014 to May 2015.
PNAUM considered as dispensers the professionals responsible for delivering the medicines to users, who may be pharmacists, nurses, nursing assistants, pharmacy assistants, or other professional category.
he data were described by prescription, dispensing, and health services indicators, outlined for the study. he list of indicators and the criteria for their calculation were based on those recommended by the WHO to evaluate the rational use of medicines23, with adaptations and
propositions carried out by the researchers (Table 1). he option of using indicators based on those recommended by WHO was performed to allow the comparison of PNAUM results with those obtained by national and international studies.
Table 1. List of prescription, dispensing, and health services indicators related to the rational use of medicines. National Survey on Access, Use and Promotion of Rational Use of Medicines – Services, 2015.
Indicator Criteria for Calculation
Prescription
Average number of prescription medicines We considered the number of medicines used by users who had at least one medicine prescribed by a doctor or dentist for the calculation of the average.
Proportion of users with antibiotic prescription
We considered the number of users who used at least one antibiotic as numerator and the number of users who used at least one medicine prescribed by a doctor or dentist
as denominator. We considered as antibiotics the bacteriostatic and bactericidal antibacterial medicines, in systemic and topical use presentations. We considered the following categories in the Anatomical-Therapeutic-Chemical classification level
(ATC): D06A-Antibiotics for topical use, D06BA-Sulfonamides, D06C-Antibiotics and chemotherapeutics combinations, J01-Antibacterials for systemic use, and
J04-Antimycobacterials.
Proportion of users with injectable prescription
The numerator was the number of users who used at least one injectable medicine and the denominator was the number of users who used at least one medicine prescribed
by a doctor or dentist.
Proportion of users with all prescribed medicines present in the national list of essential medicines
The numerator was the number of users with all prescribed medicines present in the National List of Essential Medicines of 2013, in force during the period of data collection.
The denominator was the number of medicines prescribed by a doctor or dentist. Dispensing
Percentage of professionals dispensing medicines identified with name and dose
We considered the number of professionals who reported dispensing medicines identified with name and dose as numerator and the number of professionals that act in dispensing
medicines and who answered the questionnaire item on this topic as denominator.
Proportion of users who received guidance on medicines at the pharmacy
We considered the number of users who reported receiving guidelines on medicines at the pharmacy as numerator and the number of users who had at least one medicine
prescribed by a doctor or dentist as denominator. Health services
Availability of relevant therapeutic protocols in the medical offices, reported by physicians
We considered the number of doctors who reported the presence of relevant therapeutic protocols in the health units as numerator and the number of doctors
interviewed as denominator.
Availability of a copy of the local or national list of essential medicines, reported by the dispenser
We considered the number of dispensing professionals who reported the availability of a copy of the local or national list of essential medicines in the unit as numerator and
A descriptive analysis of the variables used in the study was performed. he indicators were described according to regions of Brazil. he comparison of the indicators between the regions was done with Chi-square test for the categorical variables and with ANOVA for the continuous ones. We analyzed the association between human resources characteristics of pharmaceutical services and indicators of dispensing related to the rational use of medicines by logistic regression, with calculation of the odds ratio (OR). We considered a 5% statistical signiicance level and 95.0% conidence interval. SPSS version 22.0 was used for statistical analyses.
Participants signed an informed consent form. PNAUM – Services was approved by the National Research Ethics Committee of the National Health Council, by Opinion no. 398.131/2013.
RESULTS
PNAUM – Services interviewed 8,803 users, 1,585 doctors, and 1,139 professionals responsible for the dispensing of medicines in the UBS of the ive regions of Brazil. Among the users, 6,010 (68.3%) used at least one medicine prescribed by a physician or dentist and 4,890 (55.5%) had at least one chronic disease. he proportion of medicines present in the Relação Nacional de Medicamentos Essenciais (Rename – National List of Essential Medicines) was
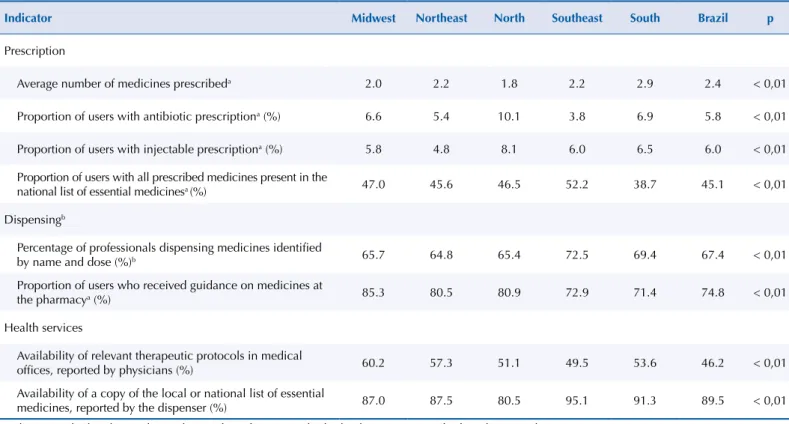
55.2%. Table 2 shows the values of prescription, dispensing, and health services indicators related to the rational use of medicines. All indicators presented statistically signiicant diferences between the regions. he average number of medicines prescribed in Brazil (2.4) was higher than the average value in the North (1.8), Midwest (2.0), and Northeast (2.2), but lower than in the South (2.9). he lowest proportion of users with antibiotic prescription was in the Southeast (3.8%) and the highest in the North (10.1%). he percentage of users who received guidance on medicines ranged from 71.4% in the South to 85.3% in the Midwest. he availability of a copy of Rename was reported by 80.5% of dispensing professionals in the North region and by 95.1% in the Southeast.
Table 2. Prescription, dispensing, and health services indicators related to the rational use of medicines according to the Region of Brazil. National Survey on Access, Use and Promotion of Rational Use of Medicines – Services, 2015.
Indicator Midwest Northeast North Southeast South Brazil p
Prescription
Average number of medicines prescribeda 2.0 2.2 1.8 2.2 2.9 2.4 < 0,01
Proportion of users with antibiotic prescriptiona (%) 6.6 5.4 10.1 3.8 6.9 5.8 < 0,01
Proportion of users with injectable prescriptiona (%) 5.8 4.8 8.1 6.0 6.5 6.0 < 0,01
Proportion of users with all prescribed medicines present in the
national list of essential medicinesa (%) 47.0 45.6 46.5 52.2 38.7 45.1 < 0,01
Dispensingb
Percentage of professionals dispensing medicines identified
by name and dose (%)b 65.7 64.8 65.4 72.5 69.4 67.4 < 0,01
Proportion of users who received guidance on medicines at
the pharmacya (%) 85.3 80.5 80.9 72.9 71.4 74.8 < 0,01
Health services
Availability of relevant therapeutic protocols in medical
offices, reported by physicians (%) 60.2 57.3 51.1 49.5 53.6 46.2 < 0,01
Availability of a copy of the local or national list of essential
medicines, reported by the dispenser (%) 87.0 87.5 80.5 95.1 91.3 89.5 < 0,01
a Indicators calculated considering the number of patients who had at least one prescribed medicine as denominator (N = 6010) b Calculated based on the professionals who answered the question
he proportion of professionals who reported always transmitting information on how to use the medicines at the time of delivery of the pharmaceutical product was 90.9%. he dispensing professionals who participated in PS training in the two years prior to the interview had 1.49 more chance of dispensing medicines identiied with name and dose (OR = 1.49, 95%CI, 1.36-1.62, p=0.00) and were less likely to provide guidance on how to use the products (OR = 0.86, 95%CI 0.77-0.96, p=0.01). he dispensing professionals whose units have full-time pharmacist were 1.82 times more likely to provide guidelines on the use of medicines (OR = 1.82, 95%CI 1.11-2.99, p=0.02). We observed no statistically signiicant association between dispenser performance in units with full-time pharmacist and dispensing of medicines identiied with name and dose (OR = 1.17, 95%CI 0.67-2.03, p=0.58).
DISCUSSION
he analysis of prescription, dispensing, and health services indicators in the UBS pointed to aspects that should be considered in the consolidation of the Política Nacional de Assistência Farmacêutica (PNAF – National Policy of Pharmaceutical Services) to promote the rational
use of medicines in primary health care.
he mean number of prescribed medicines observed in this study (2.4) was similar to that found by a multicenter study conducted in Brazil in 20049 (2.3) and was higher than the range
of values considered standard for the indicator (less than 2)7,22. A systematic review of studies
conducted in Africa identiied an average prescription of medicines of 3.114. In Brazil, this
indicator presented signiicant regional variations, with 2.2 in the Northeast and 2.9 in the South, a situation that may be related to socioeconomic diferences between regions. his result is in line with another cross-sectional study conducted in a sample of adult and older adult users of UBS, in which the prevalence of access to medicines for continuous use was higher in the South region than in the Northeast17. he authors attributed the diference to
a higher proportion of users belonging to higher socioeconomic levels in the South17.
he analysis of the frequency of antibiotic prescriptions is performed to assess their overuse23,
which leads to microbial resistance in the population13. In this study, the proportion of patients
with antibiotic prescriptions was 5.8%, lower than the average values of 37% for Latin America12
and 46.8% for Africa13 observed in systematic reviews12,14.he value of this indicator was also lower
than the established standard (less than 30%)7,22, suggesting that the proportion of antibiotic
prescriptions is satisfactory in the UBS user population. In 2011, control of the dispensing of antimicrobial medicines was encouraged by the publication of RDC no. 20/2011 of the National Sanitary Surveillance Agency, which now requires retention of prescription in establishments dispensing products of this therapeutic class. Although the legislation regulates especially the dispensing process, we can assume that it has inluenced the behavior of prescribers to increase caution regarding the prescription of antibiotics. However, this hypothesis and other possible factors associated with the use of antibiotics should be evaluated in a study outlined for this purpose. We observed regional variations in the proportion of antibiotic prescriptions, which was highest in the North region. his situation may have occurred because of the epidemiological proile of the region, with lower prevalence of chronic diseases compared to others with more favorable socioeconomic conditions, such as South and Southeast3.
A systematic review of international studies showed a frequency of injectable medicines prescriptions of about 20%12.In this study, injectable medicines were prescribed to 6.0%
of users, a value similar to the proportion observed by a Brazilian study carried out in three diferent states9. Because of the risk of complications for incorrect administration
of parenteral medicines, the prescription of injectable products has been restricted to procedures performed in the UBS itself and to medicines that are not available in the oral form in pharmaceutical market, such as insulin.
safety, quality, and cost22. In this study, the proportion of medicines present in Rename was
55.2%, lower than that observed in Latin America (71.4%)12, Africa (88.0%)14, and in another
Brazilian study9 (78.3%) carried out in 2004. he standard considered ideal for this indicator
is 100%7, so that the proportion found by PNAUM – Services was unsatisfactory.
We observed that, for 45.1% of users, all prescribed medicines were included in Rename. According to a study carried out in a region of China, the doctor’s knowledge about medicines was associated with a higher prescription of essential medicines19. Researches on factors associated with the
prescription of essential medicines in the Brazilian context are needed to subsidize policies of permanent education for prescribing professionals in SUS. Despite the importance of adopting the relation of essential medicines for the rational prescription of medicines, the limitations of Rename should be emphasized. A Brazilian research related Rename’s medicines to studies of the Global Burden of Disease in Brazil10. According to an analysis done for Rename’s 2012 edition,
some causes of disability-adjusted life years (DALY) have not been fully addressed by the medicines on the list, such as oral conditions, cancer, and psychiatric diseases10.
he identiication of medicines with name and dose at the time of dispensing was reported by 67.4% of dispensing professionals. A Brazilian study pointed out that 95.2% of the medicines ofered by SUS had data related to name, concentration, manufacturer, batch, and expiration period9. A study carried out in the primary health care of Botswana found that 74% of medicines
dispensed at health posts were identiied by name4. To ensure that the required amount of
tablets is provided for the treatment of patients in the UBS, the blisters are cut, which leads to problems in medicine identiication. he absence of identiication of the pharmaceutical products in the primary packaging observed in this study can lead to medication errors, such as the use of expired medicines or exchange for another product by the user5.
he dispensing of medicines involves patient orientations that contribute to the rational use of medicines, such as how to use them, time of treatment, major adverse reactions, and interactions with medicines and food13. he transmission of medicine guidelines is
fundamental for the adherence to treatment and success of pharmacological therapy21. In
our study, 74.8% of users reported having received information at the pharmacy on how to use the medicines, a proportion lower than that of a study conducted in a Brazilian city (92.5%)18. he professionals who reported the presence of a full-time pharmacist in the
UBS had a greater chance of transmitting information to users. Dispensing professionals at Brazilian UBS may be pharmacists or assistants supervised by pharmacists or nurses. he presence and performance of the pharmacist in a weekly workload of 40 hours helps this professional so that he can guide or train assistants for the guidance on medicines.
he comparison of our results with others is diicult because of the diferences in the adopted methodology: PNAUM questioned whether dispensers always delivered the medicines identiied with name and dose to the patients. Dispensers who had PS training were more likely to dispense the medicines identiied by name and dose, showing the importance of continuous health education actions for professionals involved in dispensing pharmaceuticals. In a contradictory way, professionals who participated in training were less likely to give guidance on how to use the medicines. his contradiction suggests that the training may have mainly addressed administrative procedures of dispensing as a matter of priority, but insuiciently the clinical aspects, such as patient orientation. However, this hypothesis must be tested by studies evaluating educational activities on the rational use of medicines regarding content, employed methods, and impact.
he availability of a Rename was of 89.5%, similar to that found by a research carried out in health facilities in Saudi Arabia (90%)8 and lower than that observed by a study done in Pakistan (100%)2.
protocols in the medical oices. his indicator was not evaluated in recent studies of the literature, but a Brazilian study conducted in 2004 indicated the availability of protocols for the treatment of tuberculosis in 43.3% of health units9.
Among the limitations of the study, we highlight that the data on the accomplishment of medicines identiication and orientation to the users in the dispensing process were collected by the professionals’ report and not by direct observation. he methodology used to estimate the indicators in PNAUM – Services difered in some situations from that used in other studies, which made it diicult to compare the results. Despite the limitations, our study presented an unprecedented panorama in the literature on the rational use of medicines in a representative sample of the UBS user population in Brazil.
hus, we observed an unsatisfactory proportion of prescription of essential medicines and limitations in the correct identiication of the medicine, guidance to patients on medicines, and availability of therapeutic protocols in the health services. he statistically signiicant diference in the values of the indicators between the regions of Brazil suggests that regional speciicities should be considered in the formulation of policies aimed at increasing the rationality of the use of pharmaceuticals. he unsatisfactory proportion of prescription of essential medicines in the UBS points out the need for training SUS prescribers on the rational use of medicines. Regarding the dispensing process, educational activities for professionals of primary health care units and their supervision by full-time pharmacists may help users to use the right medicine for their clinical condition and have access to guidelines on their pharmacological treatment. Measures that qualify health, prescription, and dispensing services are needed to promote the rational use of medicines, which is one of the main goals of PNAF.
REFERENCES
1. Álvares J, Alves MCGP, Escuder MML, Almeida AM, Izidoro JB, Guerra Junior AA, et al. Pesquisa Nacional sobre Acesso, Utilização e Promoção do Uso Racional de Medicamentos: métodos. Rev Saude Publica. 2017;51 Supl 2:4s. https://doi.org/10.11606/S1518-8787.2017051007027 2. Atif M, Sarwar MR, Azeem M, Naz M, Amir S, Nazir K. Assessment of core drug use indicators
using WHO/INRUD methodology at primary healthcare centers in Bahawalpur, Pakistan.
BMC Health Serv Res. 2016;16(1):684. https://doi.org/10.1186/s12913-016-1932-2
3. Barros MBA, Francisco PMSB, Zanchetta LM, César CLG. Tendências das desigualdades sociais e demográficas na prevalência de doenças crônicas no Brasil, PNAD: 2003- 2008.
Cienc Saude Coletiva. 2011;16(9):3755-68. https://doi.org/10.1590/S1413-81232011001000012 4. Boonstra E, Lindbaek M, Ngome E, Tshukudu K, Fugelli P. Labelling and patient knowledge
of dispensed drugs as quality indicators in primary care in Botswana. Qual Saf Health Care. 2003;12(3):168-75. https://doi.org/10.1136/qhc.12.3.168
5. Borja-Oliveira CR. Organizadores e cortadores de comprimidos: riscos e restrições ao uso.
Rev Saude Publica. 2013;47(1):123-7. https://doi.org/10.1590/S0034-89102013000100016 6. Bouvy JC, De Bruin ML, Koopmanschap MA. Epidemiology of adverse drug reactions
in Europe: a review of recent observational studies. Drug Saf. 2015;38(5):437-53. https://doi.org/10.1007/s40264-015-0281-0
7. Dumoulin J, Kaddar M, Velásquez G. Guide to drug financing mechanisms. Geneva: World Health Organization; 1998 [cited 2017 Feb 9]. Available from: http://apps.who.int/ medicinedocs/en/d/Jh2928e/.
8. El Mahalli AA, Akl OA, Al-Dawood SF, Al-Nehab AA, Al-Kubaish HA, Al-Saeed S, et al. WHO/INRUD patient care and facility-specific drug use indicators at primary health care centres in Eastern province, Saudi Arabia. East Mediterr Health J. 2012 [cited 2017 Feb 9];18(11):1086-90. Available from: http://applications.emro.who.int/emhj/v18/11/EMHJ_2012_18_11_1086_1090.pdf?ua=1 9. Emmerick ICM, Luiza VL, Pepe VLE. Pharmaceutical services evaluation in Brazil:
broadening the results of a WHO methodology. Cienc Saude Coletiva. 2009;14(4):1297-306. https://doi.org/10.1590/S1413-81232009000400036
11. Gyllensten H, Hakkarainen KM, Hagg S, Carlsten A, Petzold M, Rehnberg C, et al. Economic impact of adverse drug events: a retrospective population-based cohort study of 4970 adults.
PLoS One. 2014;9(3):e92061. https://doi.org/10.1371/journal.pone.0092061
12. Holloway KA, Ivanovska V, Wagner AK, Vialle-Valentin C, Ross-Degnan D. Have we improved use of medicines in developing and transitional countries and do we know how to? Two decades of evidence. Trop Med Int Health. 2013;18(6):656-64. https://doi.org/10.1111/tmi.12123 13. Management Sciences for Health. MDS-3: managing access to medicines and health
technologies. Arlington,VA: Management Sciences for Health; 2012 [cited 2017 Feb 9]. Available from: http://apps.who.int/medicinedocs/documents/s19577en/s19577en.pdf
14. Ofori-Asenso R, Brhlikova P, Pollock AM. Prescribing indicators at primary health care centers within the WHO African region: a systematic analysis (1995-2015). BMC Public Health.
2016;16:724. https://doi.org/10.1186/s12889-016-3428-8
15. Organización Mundial de la Salud; Red Internacional para el Uso Racional de los
Medicamentos. Como investigar el uso de medicamentos en los servicios de salud: indicadores seleccionados del uso de medicamentos. Ginebra: OMS; 1993 [cited 2017 Feb 9]. Available from: http://apps.who.int/medicinedocs/es/p/printable.html
16. Organização Pan-Americana da Saúde. Avaliação da Assistência Farmacêutica no Brasil: estrutura, processos e resultados. Brasília (DF): OPAS, Ministério da Saúde; 2005 [cited 2017 Feb 9]. (Série Técnica Medicamentos e Outros Insumos Essenciais para a Saúde, 3). Available from: http://bvsms. saude.gov.br/bvs/publicacoes/avaliacao_assistencia_farmaceutica_estrutura_resultados.pdf 17. Paniz VMV, Fassa AG, Facchini LA, Bertoldi AD, Piccini RX, Tomasi E, et al. Acesso a
medicamentos de uso contínuo em adultos e idosos nas regiões Sul e Nordeste do Brasil.
Cad Saude Publica. 2008;24(2):267-80. https://doi.org/10.1590/S0102-311X2008000200005 18. Prevedello P, Busato MA. Analysis of the pharmaceutical assistance cycle in
Romelândia, Santa Catarina, Brazil. Braz J Pharm Sci. 2014;50(1):155-63.
https://doi.org/10.1590/S1984-82502011000100016
19. Wang H, Li N, Zhu H, Xu S, Lu H, Feng Z. Prescription pattern and its influencing factors in Chinese county hospitals: a retrospective cross-sectional sudy. PLoS One. 2013;8(5):e63225.
https://doi.org/10.1371/journal.pone.006322
20. World Health Organization. The rational use of drugs: report of the Conference of Experts Nairobi, 25-29 November 1985. Geneva: WHO; 1987 [cited 2017 Feb 9]. Available from: http:// apps.who.int/medicinedocs/documents/s17054e/s17054e.pdf
21. World Health Organization. Promoting rational use of medicines: core componentes. Geneva: WHO; 2002 [cited 2017 Feb 9]. (WHO Policy Perspectives on Medicines, 5). Available from: http://archives.who.int/tbs/rational/h3011e.pdf
22. World Health Organization, Department of Technical Cooperation for Essential Drugs and Traditional Medicine; WHO Boston Collaborating Center on Pharmaceutical Policy. Using indicators to measure country pharmaceutical situations: fact book on WHO Level I and Level II monitoring indicators. Geneva: WHO, Harvard Medical School, Harvard Pilgrim Health Care; 2006 [cited 2017 Feb 11]. Available from: http://www.who.int/medicines/publications/WHOTCM2006.2A.pdf
23. World Health Organization. WHO operational package for assessing, monitoring and evaluating country pharmaceutical situations: guide for coordinators and data collectors. Geneva: WHO; 2007 [cited 2017 Feb 9]. Available from: http://apps.who.int/medicinedocs/documents/s14877e/ s14877e.pdf
24. World Health Organization. The world medicines situation 2011: medicines prices, availability and affordability. 3.ed. Geneva: WHO; 2011 [cited 2017 Feb 9]. Available from: http://www. who.int/medicines/areas/policy/world_medicines_situation/WMS_ch6_wPricing_v6.pdf
Funding: Department for Pharmaceutical Services and Strategic Health Supplies and Department of Science and Technology of the Secretariat of Science, Technology and Strategic Supplies of the Brazilian Ministry of Health (SCTIE/MS – Process 25000.111834/2, Decentralization of FNS Resources).
Authors’ Contributions: JA, AAGJ, EAC, IAG, OMS, SNL, MGOK, and FAA contributed substantially to the design and planning of the study. MGL and JA elaborated or reviewed the manuscript. JA, AAGJ, and FAA approved the inal version to be published. All authors declare to be responsible for all aspects of the study, ensuring its accuracy and completeness.