ACPD
9, 9117–9150, 2009Vertical distribution of sub-micron aerosol chemical
composition
W. T. Morgan et al.
Title Page
Abstract Introduction
Conclusions References
Tables Figures
◭ ◮
◭ ◮
Back Close
Full Screen / Esc
Printer-friendly Version
Interactive Discussion
Atmos. Chem. Phys. Discuss., 9, 9117–9150, 2009 www.atmos-chem-phys-discuss.net/9/9117/2009/ © Author(s) 2009. This work is distributed under the Creative Commons Attribution 3.0 License.
Atmospheric Chemistry and Physics Discussions
This discussion paper is/has been under review for the journalAtmospheric Chemistry
and Physics (ACP). Please refer to the corresponding final paper inACPif available.
Vertical distribution of sub-micron
aerosol chemical composition from
North-Western Europe and the North-East
Atlantic
W. T. Morgan1, J. D. Allan1,2, K. N. Bower1, G. Capes1, J. Crosier1,2, P. I. Williams1,2, and H. Coe1
1
Centre for Atmospheric Science, University of Manchester, Manchester, UK
2
ACPD
9, 9117–9150, 2009Vertical distribution of sub-micron aerosol chemical
composition
W. T. Morgan et al.
Title Page
Abstract Introduction
Conclusions References
Tables Figures
◭ ◮
◭ ◮
Back Close
Full Screen / Esc
Printer-friendly Version
Interactive Discussion
Abstract
A synthesis of UK based airborne in-situ measurements of aerosol properties repre-senting air masses from North-West Europe and the North-East Atlantic is presented. The major focus of the study is the vertical distribution of sub-micron aerosol chemical composition. Vertical profiles are derived from a Quadrupole Aerosol Mass
Spectrom-5
eter (Q-AMS). Background sub-micron aerosol vertical profiles are identified and are primarily composed of organic matter and sulphate aerosol. Such background con-ditions occurred predominantly during periods associated with long-range air mass transport across the Atlantic. These instances may serve as useful model input of aerosol to Western Europe. Increased mass concentration episodes are coincident
10
with European outflow and periods of stagnant/recirculating air masses. Such periods are characterised by significantly enhanced concentrations of nitrate aerosol relative to
those of organic matter and sulphate. Periods of enhanced ground level PM2.5loadings
are coincident with instances of high nitrate mass fractions measured on-board the air-craft, indicating that nitrate is a significant contributor to regional pollution episodes.
15
The vertical structure of the sulphate and organic aerosol profiles were shown to be primarily driven by large-scale dynamical processes. The vertical distribution of nitrate is likely determined by both dynamic and thermodynamic processes, with chemical partitioning of gas phase precursors to the particle phase occurring at lower
tempera-tures at the top of the boundary layer. Such effects have profound implications for the
20
aerosol’s lifetime and subsequent impacts, highlighting the requirement for accurate representation of the aerosol vertical distribution.
1 Introduction
Uncertainty surrounding the impact of atmospheric aerosol is a major barrier to ac-curate prediction of future anthropogenically induced climate change (Forster et al.,
25
ACPD
9, 9117–9150, 2009Vertical distribution of sub-micron aerosol chemical
composition
W. T. Morgan et al.
Title Page
Abstract Introduction
Conclusions References
Tables Figures
◭ ◮
◭ ◮
Back Close
Full Screen / Esc
Printer-friendly Version
Interactive Discussion
known to significantly alter the Earth’s radiative equilibrium on regional to global scales (e.g. Haywood and Boucher, 2000). The direct and indirect aerosol radiative forcing strongly depends upon aerosol properties as a function of height (e.g. Forster et al., 2007). The chemical composition of the aerosol is one such property. Global aerosol models require direct representation of aerosol chemical composition (e.g. Textor et al.,
5
2006). The AeroCom exercise (Kinne et al., 2006; Schulz et al., 2006; Textor et al.,
2006) established significant differences between participating models in terms of
ver-tical aerosol dispersion (Textor et al., 2006). This variance contributes significantly to uncertainties in estimates of aerosol lifetimes in the atmosphere, which in turn impacts
their climate effect. Ground based measurements of aerosol composition are
numer-10
ous, facilitating model comparisons at the surface. However, in-situ vertical profiles of aerosol chemical speciation are sparse. Consequently, there is a need for high-quality measurement data of aerosol properties as a function of altitude.
Traditional methods for aerosol composition measurements, such as filter based techniques, are incapable of providing highly time resolved vertical profiles. Novel
on-15
line techniques are required to accurately measure the vertical distribution of aerosol composition. Examples of such instruments are the Particle-Into-Liquid Sampler (PILS, Weber et al., 2001) and the Aerodyne Aerosol Mass Spectrometer (AMS, Jayne et al., 2000; Canagaratna et al., 2007). Both have demonstrated the capability to quantita-tively measure aerosol composition from airborne platforms (Bahreini et al., 2003; Lee
20
et al., 2003; Orsini et al., 2003; Crosier et al., 2007).
Dynamical processes control the advection of aerosol and their precursors to the sampling region. This has been shown to modify the concentration and relative dis-tribution of chemical species of sub-micron aerosol in the planetary boundary layer (e.g. Bahreini et al., 2003; Schneider et al., 2006; Crosier et al., 2007). A
compli-25
cating factor regarding the aerosol vertical distribution is the role of chemical, rather
than large-scale dynamical effects. Ammonium nitrate formation close to the top of the
ACPD
9, 9117–9150, 2009Vertical distribution of sub-micron aerosol chemical
composition
W. T. Morgan et al.
Title Page
Abstract Introduction
Conclusions References
Tables Figures
◭ ◮
◭ ◮
Back Close
Full Screen / Esc
Printer-friendly Version
Interactive Discussion
is strongly dependent upon temperature and relative humidity (Stelson and Seinfeld, 1982; Mozurkewich, 1993). The partitioning is biased towards the particle phase at lower temperatures and high relative humidity.
Characterisation of aerosol processes and properties on regional scales is paramount in order to assess regional air quality and to predict future changes in
at-5
mospheric variables, such as temperature and precipitation. Atmospheric processes over the UK provide a useful test case, as aerosol properties are expected to be signif-icantly modulated by the dominant meteorological synoptic situation. As a result, the UK is representative of a much wider region encompassing North-Western Europe and the North-East Atlantic. Abdalmogith and Harrison (2005) found significant variations
10
in sulphate and nitrate at two ground based locations in the UK due to differing air mass
histories. Higher concentrations were associated with south-easterly and easterly back trajectories originating from continental Europe. Coe et al. (2006) showed that, during marine conditions, background input of sulphate and organic aerosol into Western
Eu-rope were between 0.5 and 1.0µg sm−3. Thus variability in mass concentrations and
15
the relative fraction of chemical species is well established.
This paper presents measurements of aerosol properties in the UK region from the UK Facility for Airborne Atmospheric Measurements (FAAM) BAe-146 research air-craft. The vertical distribution of aerosol chemical composition is the major focus of the study. The influence of air mass history upon the aerosol mass concentration and
20
ACPD
9, 9117–9150, 2009Vertical distribution of sub-micron aerosol chemical
composition
W. T. Morgan et al.
Title Page
Abstract Introduction
Conclusions References
Tables Figures
◭ ◮
◭ ◮
Back Close
Full Screen / Esc
Printer-friendly Version
Interactive Discussion
2 Methodology
2.1 Sampling platform and instrumentation
The FAAM BAe-146 research aircraft has a typical range of over 3000 km and a height
ceiling of over 10.5 km. The aircraft’s science speed is approximately 100 m s−1.
Pro-file ascents and descents are made at approximately 150 m per minute below 1 km and
5
at 300 m per minute above 1 km. The aircraft houses a suite of instruments capable of resolving aerosol properties. Only instruments used in this analysis are discussed further. Number size distributions are measured via a wing-mounted Particle Measure-ment Systems (PMS) Passive Cavity Aerosol Spectrometer Probe 100X (PCASP, Liu et al., 1992; Strapp et al., 1992). The instrument optically counts particles between 0.1–
10
3µm diameter across 15 channels. Particle number concentrations greater than 3 nm
were measured by a TSI Inc. Ultrafine Condensation Particle Counter (CPC, Model 3025A). Furthermore, the facility provides aircraft position information and measure-ments of standard atmospheric variables, such as temperature and relative humidity.
Measurements made by the Aerodyne Quadrupole Aerosol Mass Spectrometer
(Q-15
AMS) will be the major focus of this study. The Q-AMS has demonstrated the capability to quantitatively measure the size-resolved chemical composition of non-refractory par-ticulate matter of widely varying volatility (Jayne et al., 2000; Allan et al., 2003; Jimenez et al., 2003). Furthermore, it is capable of providing such quantitative measurements
with high time resolution in a range of environments from different platforms, such
20
as aircraft. Standard operating practises are followed for ambient sampling (Jimenez et al., 2003), data quantification (Allan et al., 2003) and mass spectrum deconvolution (Allan et al., 2004). Recent laboratory evidence (Matthew et al., 2008) indicates that
the AMS collection efficiency is significantly modulated by particle phase. Here a
col-lection efficiency correction is applied following the principle developed by Crosier et al.
25
(2007), which takes into account the nitrate content of the sampled aerosol.
ACPD
9, 9117–9150, 2009Vertical distribution of sub-micron aerosol chemical
composition
W. T. Morgan et al.
Title Page
Abstract Introduction
Conclusions References
Tables Figures
◭ ◮
◭ ◮
Back Close
Full Screen / Esc
Printer-friendly Version
Interactive Discussion
to a Rosemount inlet (Foltescu et al., 1995) via approximately 0.7 m of stainless steel tubing. Samples were introduced at ambient pressure and sub-micron particle losses are considered negligible for the operating altitudes considered by this study (Zhang et al., 2002). The aerosol sample introduced to the Q-AMS is considered dry. This is
due to the coupled effect of the aircraft cabin temperature exceeding ambient
temper-5
atures and additional ram heating due to the decelerating sample airflow. As the flow is controlled by a critical orifice, increases in altitude cause decreases in the standard flow rate into the instrument. This results in an increase in the species specific detec-tion limits of the Q-AMS. Mass concentradetec-tion values are reported as micrograms per standard cubic metre i.e. at a temperature of 273.15 K and pressure of 1013.25 hPa.
10
Q-AMS data points are reported as 30 s time intervals.
The Q-AMS comprises three fundamental sections: the particle beam generation re-gion; the aerodynamic sizing region and the particle composition region. The particle
beam generation comprises a 130µm critical orifice, which controls the flow rate into
the instrument. An aerodynamic lens system (Liu et al., 1995a,b) is used to collimate
15
the sampled air into a narrow particle beam with 100% transmission for 40–700 nm vacuum aerodynamic diameter (DeCarlo et al., 2004) particles. However, at reduced
pressure, the transmission efficiency through the lens may be shifted towards smaller
particle sizes. Upon exiting the lens system, the gas undergoes a supersonic ex-pansion and the particle’s velocity increases as a function of its vacuum aerodynamic
20
diameter. The particle’s size may thus be inferred via measurement of its flight time through the length of the vacuum chamber. Particles then impact upon a resistively
heated surface at a temperature of approximately 550◦C where they undergo flash
va-porisation. The resultant gas is then ionized via 70 eV electrons emitted by a Tungsten filament. A quadrupole mass spectrometer then classifies the sample ions according
25
to a specific mass-to-charge (m/z) ratio. An electron multiplier detects the resultant
ACPD
9, 9117–9150, 2009Vertical distribution of sub-micron aerosol chemical
composition
W. T. Morgan et al.
Title Page
Abstract Introduction
Conclusions References
Tables Figures
◭ ◮
◭ ◮
Back Close
Full Screen / Esc
Printer-friendly Version
Interactive Discussion
used to determine the detection limit of the instrument intermittently from the standard error of the signal fluctuating about zero.
2.2 Location of measurements
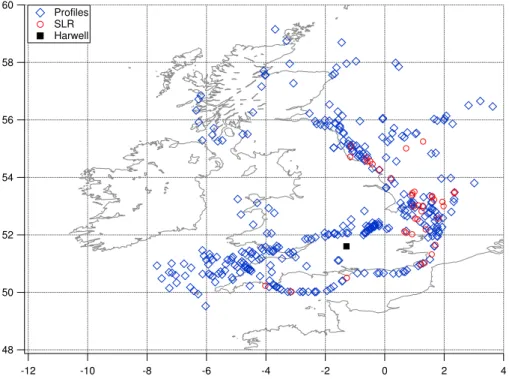
The present analysis uses data from 41 flights based in the UK region. The period covered is from 5 April 2005 to 27 September 2006. The full dataset for both the
Q-5
AMS data and flight parameters is available from the British Atmospheric Data Centre (BADC, http://badc.nerc.ac.uk). The flights are drawn from several projects associated with aerosol and cloud studies. A total of 339 profiles were identified from these flights. Low-level (defined as those below 2.5 km) Straight Level Runs (SLRs) were also iden-tified. Size distributions from the PCASP were available on 82 SLRs. The location of
10
these profiles and SLRs are summarised in Fig. 1. Predominantly, the measurements
presented are located over marine areas due to air traffic restrictions placed upon the
aircraft. Profiles and SLRs were grouped into “sectors” encompassing a 2◦ by 2◦
lat-itude/longitude grid based on their median longitude and latitude point. The sectors
were assigned on a grid from 48–60◦N and between 8◦W and 4◦E.
15
2.3 Back trajectory cluster analysis
Three dimensional air mass back trajectories were derived from European Centre for Medium-Range Weather Forecasts (ECMWF) wind fields. The start points of the tra-jectories of each profile were defined from the latitude and longitude coordinates of the centre of the sector associated with that profile. The initialisation start time was chosen
20
as 12:00 UTC as this time corresponded most closely to the airborne operations in all cases. Trajectories were established for the previous three days at 6 hourly intervals. Three vertical levels were chosen; 950 hPa, 750 hPa and 500 hPa. A total of 159 back trajectories were generated. The latitude and longitude coordinates were converted to km north and km east, respectively (assuming a spherical Earth), whilst the pressure
25
ACPD
9, 9117–9150, 2009Vertical distribution of sub-micron aerosol chemical
composition
W. T. Morgan et al.
Title Page
Abstract Introduction
Conclusions References
Tables Figures
◭ ◮
◭ ◮
Back Close
Full Screen / Esc
Printer-friendly Version
Interactive Discussion
Back trajectories were processed using a custom made cluster analysis routine, based on the method described in Cape et al. (2000). An average linkage method was used to compute the squared distance between each trajectory at individual time steps using Eq. (1):
d(xi, xj)=X
k n
(xki−xkj)2+(yki −ykj)2+(pki −pkj)2o (1)
5
wherexki,yki,pki are coordinates of trajectoryxi at each time pointk. The average
distance between two trajectories,xi andxj, are calculated. At the start of the
analy-sis, each trajectory is assigned to its own cluster. All possible pairs are evaluated with the two clusters with the smallest average distance between their members joining. An iterative process is employed until all trajectories reside in one cluster. The “optimum”
10
number of clusters may then be selected. The procedure seeks to minimize within clus-ter variance and maximize between clusclus-ter variance (Cape et al., 2000). This method has been shown to be the most appropriate means of classifying meteorological data (Kalkstein et al., 1987).
The number of clusters to retain for analysis is subjective (Kalkstein et al., 1987).
15
Several indicators may be used in order to select an appropriate number of clusters,
N. One such indicator is the coefficient of determination, R2, which is defined as the
proportion of the variance explained by the current number of clusters at each iteration step:
R2=1−X
N
(within cluster variance)
(variance of all trajectories) (2)
20
where the first sharp decrease can be used as a subjective indicator of the number of clusters to retain (Kalkstein et al., 1987). The Root Mean Square (RMS) distance between clusters may also be used, where an increase signifies that two dissimilar clusters have been joined (Cape et al., 2000). Similarly to Cape et al. (2000), an indication of the number of major clusters is defined based on the number of clusters
ACPD
9, 9117–9150, 2009Vertical distribution of sub-micron aerosol chemical
composition
W. T. Morgan et al.
Title Page
Abstract Introduction
Conclusions References
Tables Figures
◭ ◮
◭ ◮
Back Close
Full Screen / Esc
Printer-friendly Version
Interactive Discussion
containing more than 3% of the total number of trajectories. Figure 2 displays the change in these measures as a function of the number of clusters for the trajectories
initialized at 750 hPa. A comparison between R2 and RMS indicates that the initial
number of clusters to retain is 12 based on a “step” in both statistics. The number of clusters was reduced to 5 after examination of the trajectories and average 850 hPa
5
geopotential height fields for each of the 12 clusters. The clustering routine was also run for the 950 hPa and 500 hPa pressure levels to ensure vertical consistency, which resulted in a similar solution. Furthermore, the 750 hPa solution was found to be similar when the analysis was performed on five day back trajectories. Consequently, the subsequent discussion and analysis will be based upon the three day back trajectories
10
initialized at 750 hPa.
The five cluster solution derived from the back trajectory analysis is summarised in Table 1 and Fig. 3. To facilitate interpretation of the cluster solutions, average geopotential height fields were generated from ECMWF operational analysis data. These are included along with the full back trajectory solutions for each cluster in
15
the supplementary material section: http://www.atmos-chem-phys-discuss.net/9/9117/ 2009/acpd-9-9117-2009-supplement.pdf. Cluster 1 encompasses three initial clus-ters, which were dominated by westerly, south-westerly and north-westerly trajecto-ries. Thus this cluster was prescribed as the Atlantic cluster. The associated synoptic conditions are representative of westerly flow into the UK region and Northern Europe,
20
consistent with the clusters mean back trajectory. Cluster 2 comprised two clusters made of easterly back trajectories from Northern to Central Europe. The geopotential height field shows a relatively weak anticyclonic pressure system over the UK with out-flow from Northern Europe. Cluster 3 comprised air masses originating from Spain and France. The synoptic situation is characterised by high pressure over Southern/Central
25
Europe and over the Central Atlantic. A low pressure system is situated offthe west
trajec-ACPD
9, 9117–9150, 2009Vertical distribution of sub-micron aerosol chemical
composition
W. T. Morgan et al.
Title Page
Abstract Introduction
Conclusions References
Tables Figures
◭ ◮
◭ ◮
Back Close
Full Screen / Esc
Printer-friendly Version
Interactive Discussion
tories, which were assigned to cluster 1. The geopotential height field is consistent with the interpretation from the back trajectories. Cluster 5 comprises back trajectories centred on the UK representing a relatively stagnant air mass. This is in agreement with the geopotential height field that displays a ridge of high pressure situated over the UK. Cluster 3 is distinct from the other clusters in terms of its vertical displacement
5
as it is the only cluster which ascends during its transit to the UK region.
3 UK aerosol chemical composition profiles
3.1 Full dataset characterisation
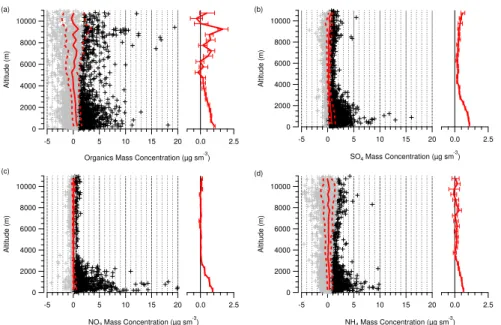
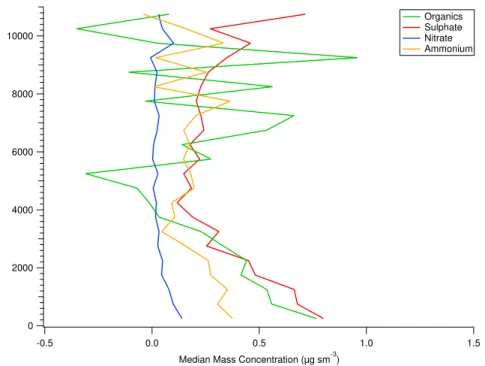
Summary statistics and individual data points of aerosol chemical composition mea-sured by the Q-AMS for the full profile dataset are presented in Figs. 4 and 5. The black
10
raw data points are those which fall above the 2σ profile for each individual species,
where 2σ is defined as two times the standard error for a 30 s average data point.
These are calculated for 500 m altitude bins when the detected signal by the Q-AMS is close to zero. In particular, resolving low mass concentrations for organics and
ammo-nium is difficult due to the signal-to-noise constraints of the Q-AMS. The variability and
15
indication of the number of points within an altitude bin is represented by calculating the variability about the mean value in each bin. This is defined as the Mean Absolute
Error (MAE) divided by the square root of the number of points,n, in an altitude bin.
MAE is defined as:
MAE= 1
n n X
i=1
|ǫi| (3)
20
whereǫi is the absolute difference between the mean bin value and the raw data value.
The profiles are categorised by a relatively small Inter Quartile Range (IQR, defined as
the difference between the 75th and 25th percentile) with sulphate and organics having
ACPD
9, 9117–9150, 2009Vertical distribution of sub-micron aerosol chemical
composition
W. T. Morgan et al.
Title Page
Abstract Introduction
Conclusions References
Tables Figures
◭ ◮
◭ ◮
Back Close
Full Screen / Esc
Printer-friendly Version
Interactive Discussion
concentration levels. The higher concentrations above the 75th percentile are likely as-sociated with pollution plumes. Nitrate mass concentrations are generally much lower than organics and sulphate with the peak concentration for the 75th percentile being
less than 1.0µg sm−3. However, when nitrate is enhanced, it is a major constituent
of the sub-micron mass detected by the AMS. Ammonium is broadly similar to the
5
sulphate and nitrate profiles due to its association with those species in the form of ammonium sulphate and ammonium nitrate, respectively.
Above 4000 m, data coverage is much more limited and the mass of aerosol is sig-nificantly decreased. Sulphate and nitrate mass concentrations are low with little vari-ability. In contrast, organic mass is characterised by low or negative mass
concentra-10
tions, punctuated by significantly enhanced concentrations above the 2σ profile. The
25th percentile for both the organics and ammonium are negative above 4000 m. The
organic mass median profile is relatively low (less than 1.0µg sm−3), whilst the 75th
percentile profile above approximately 7000 m is higher than the corresponding profile in the boundary layer. The error about the mean in each bin is significantly enhanced
15
compared with those below 4000 m. This suggests large variability coupled with po-tentially low statistical significance above this level. Above approximately 5000 m, the variability and lower number of data points results in the error about the mean being more than two times greater than values in the boundary layer. The variability in the values for nitrate and sulphate are much lower due to improved SNR for these species
20
at higher altitudes compared with organic mass. In order to establish how representa-tive such data is, the counting error is determined based on the binned total number concentration profile from the CPC. For data below 9500 m, the counting error is sub-stantially less (typically less than 5%) than the standard deviation in each bin. Above 9500 m, the counting error is between 10–20% of the standard deviation in each bin.
25
ACPD
9, 9117–9150, 2009Vertical distribution of sub-micron aerosol chemical
composition
W. T. Morgan et al.
Title Page
Abstract Introduction
Conclusions References
Tables Figures
◭ ◮
◭ ◮
Back Close
Full Screen / Esc
Printer-friendly Version
Interactive Discussion
3.2 Aerosol properties as a function of air mass history
The clusters identified in Sect. 2.3 present an opportunity to compare aerosol
proper-ties in differing air masses. The Atlantic cluster represents a largely clean air mass
entering the UK region. The cluster is representative of the input of aerosol to Western Europe during such conditions. When sampling in coastal areas downwind of the UK,
5
such an air mass will also be associated with pollution originating from the UK itself. The easterly cluster is characteristic of pollution transport from Northern/Central Eu-rope. Some additional input from the UK region may also occur depending upon the location of the sampling. The stagnant air mass cluster will be examined also. The southerly and northerly clusters are under-sampled relative to the other clusters. Thus
10
these are omitted from the subsequent analysis which will focus on the three dominant transport patterns.
Figure 6 indicates that aerosol concentrations are enhanced for the easterly cluster compared with the Atlantic cluster. This is particularly evident in the case of nitrate, which is very low for the Atlantic cluster, whereas for the easterly condition it is a
sub-15
stantial component of the sub-micron mass. This is consistent with European pollution outflow leading to an enhancement in the mass concentration of nitrate. Sulphate and organic concentrations are also enhanced due to the large availability of sources in continental Europe. Concentrations for the stagnant condition are increased relative to the Atlantic case. This is consistent with the general build-up of pollution during a
20
stagnant air mass episode.
Generally, the organics and sulphate profiles do not exhibit strong gradients within
the boundary layer itself. Nitrate displays strong coupling with NOx close to the
sur-face (not shown), decreasing to close to zero between 1000–1500 m. Such features are primarily a result of the advection of pollution plumes driven by the larger scale
25
ACPD
9, 9117–9150, 2009Vertical distribution of sub-micron aerosol chemical
composition
W. T. Morgan et al.
Title Page
Abstract Introduction
Conclusions References
Tables Figures
◭ ◮
◭ ◮
Back Close
Full Screen / Esc
Printer-friendly Version
Interactive Discussion
driven by the thermodynamics in this atmospheric layer.
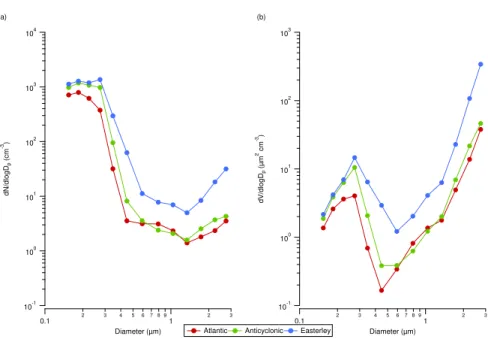
Number-size distributions and estimated volume size distributions from the PCASP are shown in Fig. 7. These are extracted from the SLRs identified in Fig. 1 and the relevant number of SLRs for each cluster is shown in Table 1. The first two chan-nels from the PCASP are omitted as these have been known to experience elevated
5
levels of intermittent electronic noise. Consequently, the distributions shown are from
0.15µm to 3µm. The shape of the distributions is broadly similar. The number-size
distributions all peak between 0.15µm and 0.3µm. The volume distributions for the
Atlantic, easterly and stagnant air masses peak at approximately 0.3µm. However,
the distributions display significant differences between their concentrations,
particu-10
larly above 0.3µm. Due to the relatively small number of SLRs for the stagnant cluster,
direct comparisons will be drawn between the easterly and Atlantic only. Based on the volume-convolved distributions, the majority of the mass sampled by the Q-AMS will be for particles smaller than 600 nm. The volume distributions indicate the presence of significant super-micron aerosol. This is likely composed of primary particles and is
15
not discussed further in this paper.
The easterly number-size and volume distributions are enhanced compared to the
Atlantic distribution. This is particularly pronounced above 0.3µm. This is
consis-tent with the higher mass concentrations observed in the profile data for the easterly condition. Newly formed secondary species condense upon available surfaces,
fur-20
ther increasing the volume of material at larger sizes. Consequently, the distinctions between the distributions for the easterly and Atlantic clusters are consistent with the Q-AMS profile data. The size distributions from this analysis are consistent with those obtained by Osborne and Haywood (2005) during the ACE-2 experiment within the in-strument’s uncertainty. Osborne and Haywood (2005) also noted an enhancement in
25
ACPD
9, 9117–9150, 2009Vertical distribution of sub-micron aerosol chemical
composition
W. T. Morgan et al.
Title Page
Abstract Introduction
Conclusions References
Tables Figures
◭ ◮
◭ ◮
Back Close
Full Screen / Esc
Printer-friendly Version
Interactive Discussion
3.3 Pollution episodes and comparison with the surface-based network
In order to study the characteristics of high pollution episodes, several flights have been
selected based on elevated measurements of PM2.5mass concentrations from the UK
surface-based measurement network. The aircraft data is compared with a rural
moni-toring station in Harwell, Oxfordshire (51◦36′0′′N, 1◦17′24′′W) in the South East of the
5
UK. The site is marked in Fig. 1. This station was selected due to its location away from major population centres, roads or industrial sources. Measurements made at the site are therefore largely representative of regional aerosol concentrations. Thus it provides an indication of the general pollution situation, which is independent of the measure-ments made on the aircraft. The data is provided by the UK Air Quality Archive website
10
(http://www.airquality.co.uk/archive/index.php) for the period covered by the analysis, which runs from 5 April 2005 to 27 September 2006. Daily mean values at Harwell were available for 40 out of 41 flights and were ranked according to total mean loading. The data is summarised by a frequency distribution shown in Fig. 8. The distribution for the entire flying period and the distribution for the flying days are investigated using a
15
two-sample T-test on unpaired means in order to discern whether the distributions are
statistically different. The null hypothesis is that the population means are equal at the
0.05 (5%) significance level. The T-statistic for the distributions is 1.930, with a p-value of 0.101. Consequently, the null hypothesis may not be rejected at the 5% level and the flights are considered to be representative of the entire analysis period. For the
20
majority of the analysis period (80% of the time), daily mean loadings were between
5–15µg sm−3. High pollution episodes are accordingly defined as those when the daily
mean exceeds 15µg sm−3. Such episodes occur on 106 days out of the 534 days
dur-ing the considered analysis period. Flight days where this value was exceeded are extracted for further analysis and are summarized in Table 2. Five flights in total are
25
ACPD
9, 9117–9150, 2009Vertical distribution of sub-micron aerosol chemical
composition
W. T. Morgan et al.
Title Page
Abstract Introduction
Conclusions References
Tables Figures
◭ ◮
◭ ◮
Back Close
Full Screen / Esc
Printer-friendly Version
Interactive Discussion
advecting European pollution outflow to the UK.
Figure 9 displays the median and 75th percentile mass concentrations of chemical composition as a function of height for the high pollution episode data. Nitrate mass fraction for the pollution episode data and the full dataset are also shown. The data is consistent with the ground-based data from Harwell with increased mass
concen-5
trations detected from the aircraft during the high pollution cases compared to the full dataset. This is consistent with the air mass history analysis in Sect. 3.2 with enhanced mass concentrations due to the large availability of sources in continental Europe. For the full dataset, sulphate and organics are the dominant components, with
concentra-tions of less than 1.6µg sm−3each close to the surface. Nitrate accounts for a small
10
fraction of the sub-micron mass. For the high pollution cases, all components are en-hanced relative to the full dataset. In particular, nitrate is significantly enen-hanced for both the median and 75th percentile mass loading. For the 75th percentile high pollu-tion cases, nitrate is the dominant chemical constituent between 0–1000 m, with nitrate
mass concentrations exceeding 5µg sm−3. Thus, the nitrate mass concentration is
en-15
hanced by a factor of 10 for the high pollution cases relative to the full dataset. Below 3000 m, nitrate is the dominant inorganic constituent. These characteristics are con-sistent with Sect. 3.1, with the high mass concentrations being quite distinct from the general background trend. Such high pollution episodes are coincident with consider-able enhancements in the nitrate mass concentration and occurred on average 20% of
20
the time during the flying period (5 April 2005 to 27 September 2006) considered by this analysis.
4 Conclusions
The vertical distribution of aerosol chemical composition has been characterised for the UK region. A back trajectory cluster analysis formed the basis for categorizing
25
ACPD
9, 9117–9150, 2009Vertical distribution of sub-micron aerosol chemical
composition
W. T. Morgan et al.
Title Page
Abstract Introduction
Conclusions References
Tables Figures
◭ ◮
◭ ◮
Back Close
Full Screen / Esc
Printer-friendly Version
Interactive Discussion
matter and ammonium sulphate. The background mass concentrations are similar to those measured by Coe et al. (2006) on the west coast of Ireland during westerly conditions. Enhanced organic matter concentrations are infrequently observed in the mid-troposphere, likely a result of long-range transport. The background profiles for the Atlantic cluster are representative of the input of aerosol to Western Europe. The
5
Atlantic cluster represented the predominant condition (53% of all back trajectories) of the cluster solution. Such profiles should serve as a useful constraint for mod-elling studies. Summary statistics for the vertical profiles are presented in the supple-mentary material section (see http://www.atmos-chem-phys-discuss.net/9/9117/2009/ acpd-9-9117-2009-supplement.pdf) for the full dataset and the cluster solutions. The
10
background trend is punctuated by higher concentrations associated with pollution plumes. Such plumes are shown to be more intense and more frequent during periods of European outflow and periods of stagnant/recirculating air masses. Analysis of the UK surface-based measurement network corroborates this conclusion, with pollution episodes occurring on average 20% of the time during the flying period. Furthermore,
15
Abdalmogith and Harrison (2005) showed enhanced mass concentrations during
peri-ods of European outflow compared to inflow from the Atlantic. Consequently, differing
meteorological regimes have a substantial impact upon the concentration, composition and microphysical properties of the aerosol input to the UK region. Such conditions increase the prospect of maximum mass concentration targets being exceeded and
20
amplified perturbations of the radiative equilibrium in the UK region. This has major implications for source apportionment and impact studies.
A major facet of the enhanced mass concentrations observed was the increase in the fractional contribution of nitrate to the particulate mass. This is consistent with previous composition profiles derived from AMS measurements in Europe (Crosier et al., 2007;
25
ACPD
9, 9117–9150, 2009Vertical distribution of sub-micron aerosol chemical
composition
W. T. Morgan et al.
Title Page
Abstract Introduction
Conclusions References
Tables Figures
◭ ◮
◭ ◮
Back Close
Full Screen / Esc
Printer-friendly Version
Interactive Discussion
Nitrate exhibited two maxima within the boundary layer; one close to the surface and a second close to the top of the boundary layer. Formation occurring higher in the bound-ary layer is likely due to thermodynamics driving the chemical partitioning of the gas
phase precursors to the particle phase. Such effects have previously been observed
on the west coast of the USA (Neuman et al., 2003) and demonstrated using 1-D
ther-5
modynamic modelling above Tokyo, Japan (Morino et al., 2006). On the regional scale, organic matter is predominantly composed of Secondary Organic Aerosol (SOA) under polluted conditions in the Northern Hemisphere (Zhang et al., 2007), which potentially contains a significant semi-volatile fraction (Donahue et al., 2006). Whether the or-ganic matter displays similar semi-volatile behaviour to the nitrate is unclear from this
10
dataset. The dataset does indicate that ammonium nitrate can be a substantial com-ponent of the regional aerosol burden. Its complex vertical distribution highlights the requirement for accurate representation of aerosol formation and processes away from the surface.
These findings have significant implications for treatment of the radiative and
ecolog-15
ical effects of anthropogenic aerosol. Firstly, the addition of relatively more inorganic
material to a mixed inorganic-organic system will enhance the hygroscopic nature of the aerosol. Consequently, the addition of particulate mass coupled with enhanced hy-groscopicity will greatly enhance the Aerosol Optical Depth (AOD) of the atmospheric burden. Such impacts will be exacerbated in areas exhibiting high relative humidity,
20
such as the top of the boundary layer. The deliquescence relative humidity of ammo-nium nitrate is 62% (Tang, 1996) with a growth factor of 1.59 at a relative humidity of
85% (Topping et al., 2005), thus the wet size of the aerosol is enhanced. Such effects
combine to greatly increase the scattering potential of the aerosol, increasing the
mag-nitude of the aerosol direct effect. Secondly, clouds forming at the top of the boundary
25
layer entrain air from beneath them into the cloud. Enhanced ammonium nitrate con-centrations in such air will lead to a modification of the microphysical properties of the cloud. Such modifications are known to modify the amount, lifetime and radiative
ACPD
9, 9117–9150, 2009Vertical distribution of sub-micron aerosol chemical
composition
W. T. Morgan et al.
Title Page
Abstract Introduction
Conclusions References
Tables Figures
◭ ◮
◭ ◮
Back Close
Full Screen / Esc
Printer-friendly Version
Interactive Discussion
As well as such climate related impacts, nitrate partitioning significantly perturbs the ni-trogen cycle of the atmosphere. Particulate nitrate has a dry deposition velocity which is ten times slower than that of nitric acid (Seinfeld and Pandis, 1998). Consequently, transport and ultimately deposition can be substantially altered by this partitioning phe-nomenon. Further elucidation of the impact of ammonium nitrate is required across
5
Europe, particularly in terms of its direct and indirect radiative effects.
Acknowledgements. We would like to acknowledge the efforts of FAAM, DirectFlight, Avalon and the Met Office and everyone associated with the various projects from which data was used for this study. W. T. Morgan was supported by a Natural Environment Research Council (NERC) studentship NER/S/A/2006/14040 and a CASE sponsorship from Aerodyne
10
Research Inc. The NERC National Centre for Atmospheric Science (NCAS) Facility for Ground based Atmospheric Measurements (FGAM) supported the maintenance of the Q-AMS. NCAS also supported the development of the data interpretation methods employed here through its Composition Directorate. Several NERC funded projects were used in this study including AMPEP (NER/T/S/2002/00493), CIRRUS (NER/T/S/2002/00135), CLOPAP
15
(NER/T/S/2002/00147) and ICEPIC (NER/A/S/2002/01021). Thanks to the British Atmospheric Data Centre (BADC) for the calculation of trajectories and access to ECMWF data. The UK Air Quality Archive website is prepared and hosted by AEA Energy & Environment, on behalf of the UK Department for Environment, Food & Rural Affairs and the Devolved Administrations. We also thank G. McFiggans and G. R. McMeeking for useful critical comments.
20
References
Abdalmogith, S. S. and Harrison, R. M.: The use of trajectory cluster analysis to examine the long-range transport of secondary inorganic aerosol in the UK, Atmos. Environ., 39, 6686– 6695, 2005. 9120, 9132
Allan, J. D., Jimenez, J. L., Williams, P. I., Alfarra, M. R., Bower, K. N., Jayne, J. T., Coe, H.,
25
ACPD
9, 9117–9150, 2009Vertical distribution of sub-micron aerosol chemical
composition
W. T. Morgan et al.
Title Page
Abstract Introduction
Conclusions References
Tables Figures
◭ ◮
◭ ◮
Back Close
Full Screen / Esc
Printer-friendly Version
Interactive Discussion
Allan, J. D., Delia, A. E., Coe, H., Bower, K. N., Alfarra, M. R., Jimenez, J. L., Middlebrook, A. M., Drewnick, F., Onasch, T. B., Canagaratna, M. R., Jayne, J. T., and Worsnop, D. R.: A generalised method for the extraction of chemically resolved mass spectra from aerodyne aerosol mass spectrometer data, J. Aerosol Sci., 35, 909–922, 2004. 9121
Bahreini, R., Jimenez, J. L., Wang, J., Flagan, R. C., Seinfeld, J. H., Jayne, J. T., and
5
Worsnop, D. R.: Aircraft-based aerosol size and composition measurements during ACE-Asia using an Aerodyne aerosol mass spectrometer, J. Geophys. Res.-Atmos., 108, 8645, doi:10.1029/2002JD003226, 2003. 9119
Canagaratna, M. R., Jayne, J. T., Jimenez, J. L., Allan, J. D., Alfarra, M. R., Zhang, Q., Onasch, T. B., Drewnick, F., Coe, H., Middlebrook, A., Delia, A., Williams, L. R., Trimborn, A. M.,
10
Northway, M. J., DeCarlo, P. F., Kolb, C. E., Davidovits, P., and Worsnop, D. R.: Chemi-cal and microphysiChemi-cal characterization of ambient aerosols with the aerodyne aerosol mass spectrometer, Mass Spectrom. Rev., 26, 185–222, 2007. 9119
Cape, J. N., Methven, J., and Hudson, L. E.: The use of trajectory cluster analysis to interpret trace gas measurements at Mace Head, Ireland, Atmos. Environ., 34, 3651–3663, 2000.
15
9124
Coe, H., Allan, J. D., Alfarra, M. R., Bower, K. N., Flynn, M. J., McFiggans, G. B., Topping, D. O., Williams, P. I., O’Dowd, C. D., Dall’Osto, M., Beddows, D. C. S., and Harrison, R. M.: Chemical and physical characteristics of aerosol particles at a remote coastal location, Mace Head, Ireland, during NAMBLEX, Atmos. Chem. Phys., 6, 3289–3301, 2006,
20
http://www.atmos-chem-phys.net/6/3289/2006/. 9120, 9132
Crosier, J., Allan, J. D., Coe, H., Bower, K. N., Formenti, P., and Williams, P. I.: Chemical composition of summertime aerosol in the Po Valley (Italy), northern Adriatic and Black Sea, Q. J. Roy. Meteorol. Soc., 133, 61–75, suppl. 1, 2007. 9119, 9121, 9132
DeCarlo, P. F., Slowik, J. G., Worsnop, D. R., Davidovits, P., and Jimenez, J. L.: Particle
mor-25
phology and density characterization by combined mobility and aerodynamic diameter mea-surements. Part 1: Theory, Aerosol Sci. Technol., 38, 1185–1205, 2004. 9122
Donahue, N. M., Robinson, A. L., Stanier, C. O., and Pandis, S. N.: Coupled partitioning, dilution, and chemical aging of semivolatile organics, Environ. Sci. Technol., 40, 2635–2643, 2006. 9133
30
ACPD
9, 9117–9150, 2009Vertical distribution of sub-micron aerosol chemical
composition
W. T. Morgan et al.
Title Page
Abstract Introduction
Conclusions References
Tables Figures
◭ ◮
◭ ◮
Back Close
Full Screen / Esc
Printer-friendly Version
Interactive Discussion
Forster, P., Ramaswamy, V., Artaxo, P., Berntsen, T., Betts, R., Fahey, D.W, Haywood, J., Lean, J., Lowe, D., Myhre, G., Nganga, J., Prinn, R., Raga, G., Schulz, M., and Van Dorland, R.: Changes in Atmospheric Constituents and in Radiative Forcing, Climate Change 2007: The Physical Science Basis. Contribution of Working Group I to the Fourth Assessment Report of the Intergovernmental Panel on Climate Change, Cambridge University Press, Cambridge,
5
United Kingdom and New York, NY, USA, 2007. 9118, 9119
Haywood, J. and Boucher, O.: Estimates of the direct and indirect radiative forcing due to tropospheric aerosols: A review, Rev. Geophys., 38, 513–543, 2000. 9119
Jayne, J. T., Leard, D. C., Zhang, X. F., Davidovits, P., Smith, K. A., Kolb, C. E., and Worsnop, D. R.: Development of an aerosol mass spectrometer for size and composition analysis of
10
submicron particles, Aerosol Sci. Technol., 33, 49–70, 2000. 9119, 9121
Jimenez, J. L., Jayne, J. T., Shi, Q., Kolb, C. E., Worsnop, D. R., Yourshaw, I., Seinfeld, J. H., Flagan, R. C., Zhang, X. F., Smith, K. A., Morris, J. W., and Davidovits, P.: Ambient aerosol sampling using the Aerodyne Aerosol Mass Spectrometer, J. Geophys. Res.-Atmos., 108, 8425, doi:10.1029/2001JD001213, 2003. 9121
15
Kalkstein, L. S., Tan, G. R., and Skindlov, J. A.: An Evaluation of 3 Clustering Procedures for Use in Synoptic Climatological Classification, J. Clim. Appl. Meteorol., 26, 717–730, 1987. 9124
Kinne, S., Schulz, M., Textor, C., Guibert, S., Balkanski, Y., Bauer, S. E., Berntsen, T., Berglen, T. F., Boucher, O., Chin, M., Collins, W., Dentener, F., Diehl, T., Easter, R., Feichter, J.,
20
Fillmore, D., Ghan, S., Ginoux, P., Gong, S., Grini, A., Hendricks, J., Herzog, M., Horowitz, L., Isaksen, I., Iversen, T., Kirkev ˚ag, A., Kloster, S., Koch, D., Kristjansson, J. E., Krol, M., Lauer, A., Lamarque, J. F., Lesins, G., Liu, X., Lohmann, U., Montanaro, V., Myhre, G., Penner, J., Pitari, G., Reddy, S., Seland, O., Stier, P., Takemura, T., and Tie, X.: An AeroCom initial assessment optical properties in aerosol component modules of global models, Atmos.
25
Chem. Phys., 6, 1815–1834, 2006,
http://www.atmos-chem-phys.net/6/1815/2006/. 9119
Lee, Y. N., Weber, R., Ma, Y., Orsini, D., Maxwell-Meier, K., Blake, D., Meinardi, S., Sachse, G., Harward, C., Chen, T. Y., Thornton, D., Tu, F. H., and Bandy, A.: Airborne measurement of inorganic ionic components of fine aerosol particles using the particle-into-liquid sampler
30
coupled to ion chromatography technique during ACE-Asia and TRACE-P, J. Geophys. Res.-Atmos., 108, 8646, doi:10.1029/2002JD003265, 2003. 9119
ACPD
9, 9117–9150, 2009Vertical distribution of sub-micron aerosol chemical
composition
W. T. Morgan et al.
Title Page
Abstract Introduction
Conclusions References
Tables Figures
◭ ◮
◭ ◮
Back Close
Full Screen / Esc
Printer-friendly Version
Interactive Discussion
Controlled Dimensions and Divergence. 1. Theory of Particle Motion in Aerodynamic Lenses and Nozzle Expansions, Aerosol Sci. Technol., 22, 293–313, 1995a. 9122
Liu, P., Ziemann, P. J., Kittelson, D. B., and McMurry, P. H.: Generating Particle Beams of Controlled Dimensions and Divergence .2. Experimental Evaluation of Particle Motion in Aerodynamic Lenses and Nozzle Expansions, Aerosol Sci. Technol., 22, 314–324, 1995b.
5
9122
Liu, P. S. K., Leaitch, W. R., Strapp, J. W., and Wasey, M. A.: Response of Particle Measuring Systems Airborne ASASP and PCASP to Nacl and Latex-Particles, Aerosol Sci. Technol., 16, 83–95, 1992. 9121
Matthew, B. M., Middlebrook, A. M., and Onasch, T. B.: Collection efficiencies in an Aerodyne
10
Aerosol Mass Spectrometer as a function of particle phase for laboratory generated aerosols, Aerosol Sci. Technol., 42, 884–898, iSI Document Delivery No.: 353ULTimes Cited: 1Cited Reference Count: 59, 2008. 9121
McFiggans, G., Artaxo, P., Baltensperger, U., Coe, H., Facchini, M. C., Feingold, G., Fuzzi, S., Gysel, M., Laaksonen, A., Lohmann, U., Mentel, T. F., Murphy, D. M., O’Dowd, C. D., Snider,
15
J. R., and Weingartner, E.: The effect of physical and chemical aerosol properties on warm cloud droplet activation, Atmos. Chem. Phys., 6, 2593–2649, 2006,
http://www.atmos-chem-phys.net/6/2593/2006/. 9133
Morino, Y., Kondo, Y., Takegawa, N., Miyazaki, Y., Kita, K., Komazaki, Y., Fukuda, M., Miyakawa, T., Moteki, N., and Worsnop, D. R.: Partitioning of HNO3 and particulate
20
nitrate over Tokyo: Effect of vertical mixing, J. Geophys. Res.-Atmos., 111, D15215, doi:10.1029/2005JD006887, 2006. 9119, 9133
Mozurkewich, M.: The Dissociation-Constant of Ammonium-Nitrate and Its Dependence on Temperature, Relative-Humidity and Particle-Size, Atmos. Environ. Part A-Gen., 27, 261– 270, 1993. 9120
25
Neuman, J. A., Nowak, J. B., Brock, C. A., Trainer, M., Fehsenfeld, F. C., Holloway, J. S., Hubler, G., Hudson, P. K., Murphy, D. M., Nicks, D. K., Orsini, D., Parrish, D. D., Ryerson, T. B., Sueper, D. T., Sullivan, A., and Weber, R.: Variability in ammonium nitrate formation and nitric acid depletion with altitude and location over California, J. Geophys. Res.-Atmos., 108, 4557, doi:10.1029/2003JD003616, 2003. 9119, 9133
30
ACPD
9, 9117–9150, 2009Vertical distribution of sub-micron aerosol chemical
composition
W. T. Morgan et al.
Title Page
Abstract Introduction
Conclusions References
Tables Figures
◭ ◮
◭ ◮
Back Close
Full Screen / Esc
Printer-friendly Version
Interactive Discussion
Osborne, S. R. and Haywood, J. M.: Aircraft observations of the microphysical and optical properties of major aerosol species, Atmos. Res., 73, 173–201, iSI Document Delivery No.: 898CNTimes Cited: 5Cited Reference Count: 46, 2005. 9129
Schneider, J., Hings, S. S., Hock, B. N., Weimer, S., Borrmann, S., Fiebig, M., Petzold, A., Busen, R., and Karcher, B.: Aircraft-based operation of an aerosol mass spectrometer:
Mea-5
surements of tropospheric aerosol composition, J. Aerosol Sci., 37, 839–857, 2006. 9119, 9132
Schulz, M., Textor, C., Kinne, S., Balkanski, Y., Bauer, S., Berntsen, T., Berglen, T., Boucher, O., Dentener, F., Guibert, S., Isaksen, I. S. A., Iversen, T., Koch, D., Kirkev ˚ag, A., Liu, X., Montanaro, V., Myhre, G., Penner, J. E., Pitari, G., Reddy, S., Seland, Ø., Stier, P., and
10
Takemura, T.: Radiative forcing by aerosols as derived from the AeroCom present-day and pre-industrial simulations, Atmos. Chem. Phys., 6, 5225–5246, 2006,
http://www.atmos-chem-phys.net/6/5225/2006/. 9119
Seinfeld, J. H. and Pandis, S.: Atmospheric chemistry and physics: from air pollution to climate change, John Wiley & Sons, New York, USA, 1998. 9134
15
Stelson, A. W. and Seinfeld, J. H.: Relative-Humidity and Ph-Dependence of the Vapor-Pressure of Ammonium-Nitrate Nitric Acid-Solutions at 25-Degrees-C, Atmos. Environ., 16, 993–1000, 1982. 9120
Strapp, J. W., Leaitch, W. R., and Liu, P. S. K.: Hydrated and Dried Aerosol-Size-Distribution Measurements from the Particle Measuring Systems FSSP-300 Probe and the Deiced
20
PCASP-100x Probe, J. Atmos. Ocean. Tech., 9, 548–555, 1992. 9121
Tang, I. N.: Chemical and size effects of hygroscopic aerosols on light scattering coefficients, J. Geophys. Res.-Atmos., 101, 19245–19250, 1996. 9133
Textor, C., Schulz, M., Guibert, S., Kinne, S., Balkanski, Y., Bauer, S., Berntsen, T., Berglen, T., Boucher, O., Chin, M., Dentener, F., Diehl, T., Easter, R., Feichter, H., Fillmore, D., Ghan, S.,
25
Ginoux, P., Gong, S., Grini, A., Hendricks, J., Horowitz, L., Huang, P., Isaksen, I., Iversen, I., Kloster, S., Koch, D., Kirkev ˚ag, A., Kristjansson, J. E., Krol, M., Lauer, A., Lamarque, J. F., Liu, X., Montanaro, V., Myhre, G., Penner, J., Pitari, G., Reddy, S., Seland, Ø., Stier, P., Takemura, T., and Tie, X.: Analysis and quantification of the diversities of aerosol life cycles within AeroCom, Atmos. Chem. Phys., 6, 1777–1813, 2006,
30
http://www.atmos-chem-phys.net/6/1777/2006/. 9119
ACPD
9, 9117–9150, 2009Vertical distribution of sub-micron aerosol chemical
composition
W. T. Morgan et al.
Title Page
Abstract Introduction
Conclusions References
Tables Figures
◭ ◮
◭ ◮
Back Close
Full Screen / Esc
Printer-friendly Version
Interactive Discussion
2005,
http://www.atmos-chem-phys.net/5/1205/2005/. 9133
Weber, R. J., Orsini, D., Daun, Y., Lee, Y. N., Klotz, P. J., and Brechtel, F.: A particle-into-liquid collector for rapid measurement of aerosol bulk chemical composition, Aerosol Sci. Technol., 35, 718–727, 2001. 9119
5
Zhang, Q., Jimenez, J. L., Canagaratna, M. R., Allan, J. D., Coe, H., Ulbrich, I., Alfarra, M. R., Takami, A., Middlebrook, A. M., Sun, Y. L., Dzepina, K., Dunlea, E., Docherty, K., De-Carlo, P. F., Salcedo, D., Onasch, T., Jayne, J. T., Miyoshi, T., Shimono, A., Hatakeyama, S., Takegawa, N., Kondo, Y., Schneider, J., Drewnick, F., Borrmann, S., Weimer, S., Demerjian, K., Williams, P., Bower, K., Bahreini, R., Cottrell, L., Griffin, R. J., Rautiainen, J., Sun, J. Y.,
10
Zhang, Y. M., and Worsnop, D. R.: Ubiquity and dominance of oxygenated species in organic aerosols in anthropogenically-influenced Northern Hemisphere midlatitudes, Geophys. Res. Lett., 34, L13801, doi:10.1029/2007GL029979, 2007. 9133
Zhang, X. F., Smith, K. A., Worsnop, D. R., Jimenez, J., Jayne, J. T., and Kolb, C. E.: A numerical characterization of particle beam collimation by an aerodynamic lens-nozzle system: Part I.
15
ACPD
9, 9117–9150, 2009Vertical distribution of sub-micron aerosol chemical
composition
W. T. Morgan et al.
Title Page
Abstract Introduction
Conclusions References
Tables Figures
◭ ◮
◭ ◮
Back Close
Full Screen / Esc
Printer-friendly Version
Interactive Discussion
Table 1.Summary of cluster solution including details of the number of profiles, SLRs and back trajectories associated with each cluster.
Cluster Condition Profiles SLRs Back Trajectories
1 Atlantic origin 181 51 84
2 Easterly 44 19 19
3 Southerly 18 7 6
4 Northerly 29 N/A 18
ACPD
9, 9117–9150, 2009Vertical distribution of sub-micron aerosol chemical
composition
W. T. Morgan et al.
Title Page
Abstract Introduction
Conclusions References
Tables Figures
◭ ◮
◭ ◮
Back Close
Full Screen / Esc
Printer-friendly Version
Interactive Discussion
Table 2. Details of flights which occurred when daily mean PM2.5 measurements at Harwell,
UK exceeded 15µg sm−3.
Date Flight Number PM2.5Mass Concentration (µg sm− 3
)
21/04/2005 B091 16
13/07/2005 B110 16
17/08/2005 B122 17
22/09/2005 B133 16
ACPD
9, 9117–9150, 2009Vertical distribution of sub-micron aerosol chemical
composition
W. T. Morgan et al.
Title Page
Abstract Introduction
Conclusions References
Tables Figures
◭ ◮
◭ ◮
Back Close
Full Screen / Esc
Printer-friendly Version
Interactive Discussion 60
58
56
54
52
50
48
-12 -10 -8 -6 -4 -2 0 2 4
Profiles SLR Harwell
ACPD
9, 9117–9150, 2009Vertical distribution of sub-micron aerosol chemical
composition
W. T. Morgan et al.
Title Page
Abstract Introduction
Conclusions References
Tables Figures
◭ ◮
◭ ◮
Back Close
Full Screen / Esc
Printer-friendly Version
Interactive Discussion
1.0
0.8
0.6
0.4
0.2
0.0
Test Statistic
20 15
10 5
Number of Clusters
12
10
8
6
4
2
0
Number of Major Clusters (>3% of total)
R2 RMS
Number of Major Clusters
ACPD
9, 9117–9150, 2009Vertical distribution of sub-micron aerosol chemical
composition
W. T. Morgan et al.
Title Page
Abstract Introduction
Conclusions References
Tables Figures
◭ ◮
◭ ◮
Back Close
Full Screen / Esc
Printer-friendly Version
Interactive Discussion 80
70
60
50
40
30
Latitude (°)
-60 -40 -20 0 20 Longitude (°)
Cluster 1 Cluster 2 Cluster 3 Cluster 4 Cluster 5
-80 -60 -40 -20 0 20 40 60
750-Pressure (hPa)
70 60 50 40 30 20 10 0
Hours
(a) (b)
ACPD
9, 9117–9150, 2009Vertical distribution of sub-micron aerosol chemical
composition
W. T. Morgan et al.
Title Page Abstract Introduction Conclusions References Tables Figures ◭ ◮ ◭ ◮ Back Close
Full Screen / Esc
Printer-friendly Version Interactive Discussion 10000 8000 6000 4000 2000 0 Altitude (m) 20 15 10 5 0 -5
Organics Mass Concentration (µg sm-3) 2.5 0.0 10000 8000 6000 4000 2000 0 Altitude (m) 20 15 10 5 0 -5
SO4 Mass Concentration (µg sm -3 ) 2.5 0.0 10000 8000 6000 4000 2000 0 Altitude (m) 20 15 10 5 0 -5
NO3 Mass Concentration (µg sm -3 ) 2.5 0.0 10000 8000 6000 4000 2000 0 Altitude (m) 20 15 10 5 0 -5
NH4 Mass Concentration (µg sm -3 ) 2.5 0.0 (a) (c) (b) (d)
ACPD
9, 9117–9150, 2009Vertical distribution of sub-micron aerosol chemical
composition
W. T. Morgan et al.
Title Page
Abstract Introduction
Conclusions References
Tables Figures
◭ ◮
◭ ◮
Back Close
Full Screen / Esc
Printer-friendly Version
Interactive Discussion
10000
8000
6000
4000
2000
0
Altitude (m)
1.5 1.0
0.5 0.0
-0.5
Median Mass Concentration (µg sm-3)
Organics Sulphate Nitrate Ammonium
ACPD
9, 9117–9150, 2009Vertical distribution of sub-micron aerosol chemical
composition
W. T. Morgan et al.
Title Page Abstract Introduction Conclusions References Tables Figures ◭ ◮ ◭ ◮ Back Close
Full Screen / Esc
Printer-friendly Version Interactive Discussion 10000 8000 6000 4000 2000 0 Altitude (m) 5 4 3 2 1 0 -1
Organics Mass Concentration (µg sm-3) 10000 8000 6000 4000 2000 0 Altitude (m) 5 4 3 2 1 0 -1
SO4 Mass Concentration (µg sm -3 ) 10000 8000 6000 4000 2000 0 Altitude (m) 5 4 3 2 1 0 -1
NO3 Mass Concentration (µg sm -3 ) 10000 8000 6000 4000 2000 0 Altitude (m) 5 4 3 2 1 0 -1
Organics Mass Concentration (µg sm-3) 10000 8000 6000 4000 2000 0 Altitude (m) 5 4 3 2 1 0 -1
SO4 Mass Concentration (µg sm -3 ) 10000 8000 6000 4000 2000 0 Altitude (m) 5 4 3 2 1 0 -1
NO3 Mass Concentration (µg sm -3 ) Atlantic Easterley Stagnant (a) (b)
ACPD
9, 9117–9150, 2009Vertical distribution of sub-micron aerosol chemical
composition
W. T. Morgan et al.
Title Page
Abstract Introduction
Conclusions References
Tables Figures
◭ ◮
◭ ◮
Back Close
Full Screen / Esc
Printer-friendly Version
Interactive Discussion 10-1
100 101 102 103 104
dN/dlogD
p
(cm
-3)
0.1 2 3 4 5 67 8 91 2 3 Diameter (µm)
10-1 100 101 102 103
dV/dlogD
p
(µm
2 cm -3)
0.1 2 3 4 5 6 7 8 91 2 3 Diameter (µm)
(a) (b)
Atlantic Anticyclonic Easterley
ACPD
9, 9117–9150, 2009Vertical distribution of sub-micron aerosol chemical
composition
W. T. Morgan et al.
Title Page
Abstract Introduction
Conclusions References
Tables Figures
◭ ◮
◭ ◮
Back Close
Full Screen / Esc
Printer-friendly Version
Interactive Discussion
220
200
180
160
140
120
100
80
60
40
20
0
Frequency
35 30
25 20
15 10
5 0
Mass Concentration (µg m-3)
Entire Flying Period Flight Days
Fig. 8. Histogram of daily mean PM2.5 mass concentrations at Harwell for the entire flying
ACPD
9, 9117–9150, 2009Vertical distribution of sub-micron aerosol chemical
composition
W. T. Morgan et al.
Title Page Abstract Introduction Conclusions References Tables Figures ◭ ◮ ◭ ◮ Back Close
Full Screen / Esc
Printer-friendly Version Interactive Discussion 6 5 4 3 2 1 0
Mass Concentration (µg sm-3)
0-1000
1000-2000
2000-3000
3000-4000
Height Interval (m)
(a) 0.5 0.4 0.3 0.2 0.1 0.0
Nitrate Mass Fraction
0-1000
1000-2000
2000-3000
3000-4000
Height Interval (m)
(b) 6 5 4 3 2 1 0
Mass Concentration (µg sm-3)
0-1000
1000-2000
2000-3000
3000-4000
Height Interval (m)
Sulphate Nitrate Organics Ammonium (c) 0.5 0.4 0.3 0.2 0.1 0.0
Nitrate Mass Fraction
0-1000
1000-2000
2000-3000
3000-4000
Height Interval (m)
Full Dataset High Mass Loading Cases (d)