Geophysicae
Comparison between XBT data and TOPEX/Poseidon satellite
altimetry in the Ligurian-Tyrrhenian area
S. Vignudelli1, P. Cipollini2, F. Reseghetti3, G. Fusco3, G. P. Gasparini4, and G. M. R. Manzella3 1CNR – Istituto Elaborazione della Informazione, 56 100 Pisa, Italy
2James Rennell Division and Laboratory for Satellite Oceanography, Southampton Oceanography Centre, SO14 3ZH,
Southampton, UK
3ENEA – CRAM, P.O. Box 224, 19 100 La Spezia, Italy
4CNR – Istituto per lo studio dell’Oceanografia Fisica, 19 036 Lerici, La Spezia, Italy
Received: 1 October 2001 – Revised: 30 April 2002 – Accepted: 11 July 2002
Abstract. From September 1999 to December 2000, eX-pendable Bathy-Thermograph (XBT) profiles were collected along the Genova-Palermo shipping route in the framework of the Mediterranean Forecasting System Pilot Project (MF-SPP). The route is virtually coincident with track 0044 of the TOPEX/Poseidon satellite altimeter, crossing the Lig-urian and Tyrrhenian basins in an approximate N–S direc-tion. This allows a direct comparison between XBT and altimetry, whose findings are presented in this paper. XBT sections reveal the presence of the major features of the re-gional circulation, namely the eastern boundary of the Lig-urian gyre, the Bonifacio gyre and the Modified Atlantic Wa-ter inflow along the Sicily coast. Twenty-two comparisons of steric heights derived from the XBT data set with concur-rent realizations of single-pass altimetric heights are made. The overall correlation is around 0.55 with an RMS differ-ence of less than 3 cm. In the Tyrrhenian Sea the spectra are remarkably similar in shape, but in general the altimet-ric heights contain more energy. This difference is explained in terms of oceanographic signals, which are captured with a different intensity by the satellite altimeter and XBTs, as well as computational errors. On scales larger than 100 km, the data sets are also significantly coherent, with increasing coherence values at longer wavelengths. The XBTs were dropped every 18–20 km along the track: as a consequence, the spacing scale was unable to resolve adequately the inter-nal radius of deformation (<20 km). Furthermore, few XBT drops were carried out in the Ligurian Sea, due to the limited north-south extent of this basin, so the comparison is prob-lematic there. On the contrary, the major features observed in the XBT data in the Tyrrhenian Sea are also detected by TOPEX/Poseidon. The manuscript is completed by a discus-sion on how to integrate the two data sets, in order to extract additional information. In particular, the results emphasize their complementariety in providing a dynamically complete description of the observed structures.
Key words. Oceanography: general (descriptive and re-Correspondence to:S. Vignudelli ([email protected])
gional oceanography) Oceanography: physical (sea level variations; instruments and techniques)
1 Introduction
The Ligurian and Tyrrhenian Seas are areas of considerable oceanographic interest in the western Mediterranean region. The Ligurian Sea has a well-defined cyclonic gyre circula-tion, involving both the Modified Atlantic Water (MAW) at the surface and the Levantine Intermediate Water (LIW) at depth. This pattern is sustained mainly by two independent currents, both flowing northward along the eastern and west-ern sides of Corsica Island: the Tyrrhenian current, which intrudes into the basin through the Corsica Channel, and the Western Corsica Current. North of the island, the two cur-rents join together and flow westward along the Ligurian coast (Astraldi and Gasparini, 1992). A marked frontal struc-ture found nearly parallel to the coast over the shelf, separates this coastal current from the basin interior, where the gyre exhibits a quasi-permanent cyclonic structure. The Ligurian Sea is a region heavily subject to cold weather conditions during winter; these may induce relevant air-sea interaction processes, which, in turn, may cause deep water formation, especially in the central part of the basin (Sparnocchia et al., 1995).
influ-T/P 0044
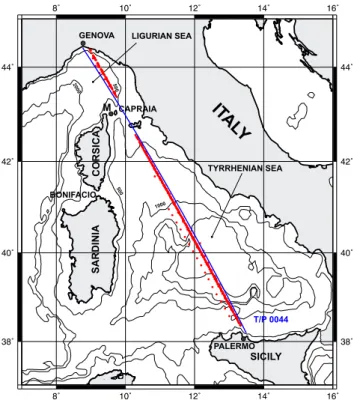
Fig. 1. Study area including bottom topography and T/P ground
track 0044 with superimposed the positions of the XBTs (red dots) deployed during the VOS program as part of the MFSPP.
ence of the advection of both MAW coming from the western Mediterranean at the surface, and LIW coming from the east in the subsurface layer. In winter, the flow progresses along the Tyrrhenian coast and through the Corsica Channel into the Ligurian Sea. By contrast, a weak exchange is observed through the channel during summer. The most important ex-change region for the Tyrrhenian basin is the southern open-ing, where inflow/outflow of all water masses present in the basin are observed (Astraldi et al., 2002).
The actual picture of the physical coupling between the Ligurian and Tyrrhenian circulation dynamics comes from isolated investigations, while a simultaneous systematic monitoring of both seas has never been carried out. As part of the Volunteer Observing System (VOS) program of the Mediterranean Forecasting System Pilot Project (MFSPP), repeated XBT measurements gave an opportunity to mon-itor seasonal, and eventually interannual, changes in upper ocean thermal structure along a shipping route from Genova to Palermo, crossing significant circulation features, namely the eastern boundary of the Ligurian Gyre, the Bonifacio Gyre, and the Atlantic water inflow along the Sicily coast. An important characteristic of this shipping route is that it is approximately coincident with a TOPEX/Poseidon (here-inafter T/P) ground-track (track 0044, see Fig. 1). This gives a chance of a comparison with respect to space and time be-tween the sea surface heights measured by the T/P satellite altimeter and “synthetic” steric heights from a data set con-sisting of the XBT measurements and temperature/salinity
climatology profiles. The combination of subsurface infor-mation with concurrent satellite altimetry overflights permit-ted the extension of our knowledge of the altimeter perfor-mances in the open part of the basin, complementing the tide gauge intercomparison near Capraia Island made by Vi-gnudelli et al. (2000).
Since the launch of the T/P satellite, some studies (Gilson et al., 1998; McCarthy et al., 2000) have clarified, in terms of oceanographic signal and error, the differences between the sea surface height changes inferred by the altimeter and XBT data sets over the open ocean. Pioneering studies (Lar-nicol et al., 1995; Iudicone et al., 1998; Ayoub et al., 1998) have demonstrated the usefulness of satellite altimetry for monitoring oceanographic conditions in marginal seas like the Mediterranean Sea. However, it is clear that corrobora-tive information and any available in situ data from historical archives are often indispensable to validate satellite-derived results and to give them the correct interpretation on the ba-sis of the regional phenomena. In this framework, Buon-giorno Nardelli et al. (1999) find good agreement between XBT and altimetric heights in the Channel of Sicily, although over short observational periods.
This study seeks to establish whether the two data sets over a period of 15 months are making comparable mea-surements, and thus, to understand the similarities and dif-ferences. Conclusions are then drawn concerning their inte-gration, in order to obtain more information about the sea-sonal variability of the main oceanographic features in the Ligurian-Tyrrhenian area.
2 Data and methods
2.1 XBT temperature profiles and steric heights computation
The XBT monitoring system was first developed during a training period (September–November 1999) in which all the data collection/transmission systems and protocols for qual-ity assurance were tested (Manzella and MFS-VOS Group, 2002), by carrying out monthly cruises. From December 1999 to May 2000 the collection was twice per month, while from June 2000 to December 2000 the data were collected once a month along the whole track, with the exception of July 2000; in August 2000, the data were collected twice but only in the southern Tyrrhenian Sea. The spatial reso-lution of the XBT drops was about 18–20 km. All data were quality checked, including an assessment of the overall con-sistency, by comparing each single profile with the adjacent ones (Fusco et al., 2003).
a) b) c)
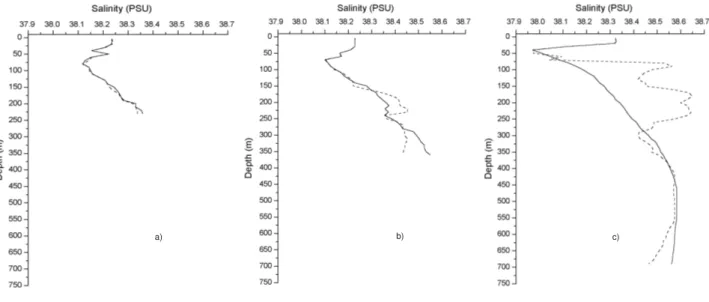
Fig. 2.Comparison between synthetic (dashed line) and CTD-measured (solid line) salinities (best estimate(a), satisfactory estimate(b)and
worst estimate(c)) during September 2000.
estimation of salinity from the T–S relationship. Errors as-sociated with the methodology by such authors were esti-mated by Lagerloef (1994), who found a maximum error in correspondence to a sub-surface temperature inversion. Im-provements and different approaches were also proposed by Donguy et al. (1986), Kessler and Taft (1987), Vossepoel et al. (1999), and Troccoli and Haines (1999). Particularly in-teresting is the estimation of salinity by using the Empirical Orthogonal Functions technique presented by Sparnocchia et al. (2003).
In this study, XBT data are used to reconstruct salinities by means of T–S relationships obtained from MED6 tempera-ture and salinity monthly climatology (Brankart and Pinardi, 2001). Climatological data were extracted in the grid point nearest to the XBT geographic location, then they both were re-sampled at every 10 m, up to 450 m, adding the data at 5 and 15 m and temporally interpolating by using values of the two months closest to the XBT date. Cubic spline coef-ficients were computed from T–S climatological values, and they were used to calculate salinities corresponding to XBT profiles. This technique requires a monotonic vertical profile, i.e.T =f (z), withf′(z) < 0 almost everywhere, but this condition is not always met in the Western Mediterranean basin, where temperature inversions can be found during the winter season.
Under the assumption of almost monotonic vertical pro-files, a “synthetic” salinity was computed by requiring a dif-ference on the profile as low as possible with respect to the climatological one. In practice, the calculation was done by imposing the following constraints on the salinity values:
– the mean value of the differences between the computed and the climatological values at each depth, weighted on the depth, less than 1% of corresponding climatological profile (about 0.4 PSU);
– the difference between the maximum (and the mini-mum) computed value on each profile, with the profile no greater than 1% of the maximum (minimum) value on the corresponding climatological one;
– overall variability of the computed profile at each depth less than twice the variability as deduced from the cor-responding climatological one.
These constraints were met by varying the number of knots in the spline coefficients calculation and selecting that one having the minimum value of the weighted difference. An analysis of the available data shows that the larger errors are associated with those profiles having a significant tempera-ture inversion, as pointed out before (Lagerloef, 1994). By applying this technique, 706 out of 760 salinity profiles were satisfactorily reconstructed (92.9% of the total launches), with an overall weighted mean difference on each profile of 0.106 PSU with respect to the corresponding climatological one. It must be underlined that the estimation failed over the majority (50 out of 54) of profiles collected during January– April, when a cold water influx was detected at around 200 m depth.
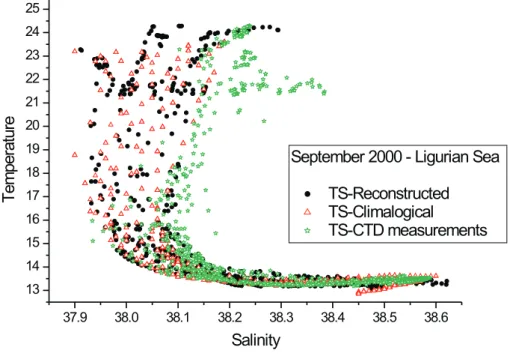
Fig. 3. T–S diagram comparisons among CTD, climatology and XBT-synthetic salinities during Septem-ber 2000.
shown in Fig. 3, where T–S relationships among CTD, cli-matology and XBT-synthetic salinities are compared for the particular period of September 2000. It can be seen that be-low the thermocline the synthetic data are very close to CTD and climatological data.
The steric heights were calculated assuming 300 m as the reference level, where the seasonal variability becomes mi-nor, as demonstrated by Astraldi and Gasparini (1994) and Vignudelli et al. (2000). The computed values are affected by many errors related to the methodology of salinity recon-struction, precision of XBT measurements, and the choice of the no-motion level. Based on the previous XBT-CTD inter-comparison, it is possible to give an upper limit of 4 cm to the absolute error in the steric height calculations.
A list of the available XBT cruises and T/P altimeter over-passes is shown in Table 1. Since the altimetric observations are not at the same time as the XBT data, some differences have to be expected in comparing the two data sets. Other possible discrepancies are due to the inconsistencies between the XBT and altimeter means. Further differences can also be expected, considering the fact that the XBT data do not account for the effect of the wind that is the generation of an essentially barotropic circulation. Moreover, large-scale fea-tures might extend beyond the 300 m reference level, causing mass redistribution, whose effect would be to offset the baro-clinic contribution to the sea level.
2.2 Altimetric heights
We used data from the ground-track 044 (Fig. 1) of cycles 258 to 304 of T/P, whose dates are listed in Table 1. A de-tailed explanation of the problems encountered in the use of satellite altimetry in coastal and marginal seas can be found in Vignudelli et al. (2000), but it is, nevertheless,
appropri-ate to highlight briefly some aspects of the processing meth-ods. The raw data were obtained from Archiving Validation and Interpretation of Satellite Oceanographic data (AVISO, 1996) in the form of Geophysical Data Records (GDRs). The data set includes the altimeter measurements, as well as all the information needed to compute accurate sea sur-face heights. All the data, repeated every 10 days, were at 1-s intervals (corresponding to∼6.2 km or ∼0.06◦ in lati-tude along the satellite ground-track). After a first screening for anomalous and non-ocean data, the altimeter measure-ments were corrected for instrumental, atmospheric and sea surface effects. The ocean tides were calculated at the grid points using the tidal model by Eanes (1994) provided in the GDRs. Sea surface heights were also corrected for the effects of a slight non-collinearity of the satellite tracks by collocat-ing them on the nominal reference track, accountcollocat-ing for the mean height gradient. Sea surface height anomalies were ini-tially computed with respect to the mean sea surface profile calculated for the period 1993–1995 (a standard period used in oceanographic research to exclude strong el-Ni˜no years), but were subsequently re-referenced to the mean value over the cruise period, as detailed in Sect. 4.
Table 1.XBT cruises (date and time) and near T/P overflights (cycle, date and time)
____________________________________________________________________________________________________________________________
XBT Cruise T/P Overpass
From To Near-before Near-after
__________________________________________ _________________________________________ Cycle From To Cycle From To
_____________________________________________________________________________________________________________________________
20-Sep-1999 19:54 21-Sep-1999 14:23 258 17-Sep-1999 03:48 17-Sep-1999 03:51 259 27-Sep-1999 01:47 27-Sep-1999 01:49 20-Oct-1999 21:45 21-Oct-1999 16:45 261 16-Oct-1999 21:44 16-Oct-1999 21:46 262 26-Oct-1999 19:42 26-Oct-1999 19:45 10-Nov-1999 21:48 11-Nov-1999 15:45 263 05-Nov-1999 17:41 05-Nov-1999 17:43 264 15-Nov-1999 15:40 15-Nov-1999 15:42 01-Dec-1999 22:00 02-Dec-1999 16:26 265 25-Nov-1999 13:38 25-Nov-1999 13:40 266 05-Dec-1999 11:37 05-Dec-1999 11:39 15-Dec-1999 21:49 16-Dec-1999 16:14 267 15-Dec-1999 09:35 15-Dec-1999 09:37 268 25-Dec-1999 07:34 25-Dec-1999 07:36 11-Jan-2000 21:59 12-Jan-2000 14:27 269 04-Jan-2000 05:32 04-Jan-2000 05:34 270 14-Jan-2000 03:31 14-Jan-2000 03:33 25-Jan-2000 21:16 26-Jan-2000 15:15 271 24-Jan-2000 01:29 24-Jan-2000 01:31 272 02-Feb-2000 23:28 02-Feb-2000 23:30 08-Feb-2000 21:00 09-Feb-2000 14:59 272 02-Feb-2000 23:28 02-Feb-2000 23:30 273 12-Feb-2000 21:26 12-Feb-2000 21:29 22-Feb-2000 21:01 23-Feb-2000 15:02 274 22-Feb-2000 19:25 22-Feb-2000 19:27 275 03-Mar-2000 17:23 03-Mar-2000 17:26 08-Mar-2000 00:03 09-Mar-2000 17:30 275 03-Mar-2000 17:23 03-Mar-2000 17:26 276 13-Mar-2000 15:22 13-Mar-2000 15:24 21-Mar-2000 21:14 22-Mar-2000 13:45 276 13-Mar-2000 15:22 13-Mar-2000 15:24 277 23-Mar-2000 13:20 23-Mar-2000 13:23 08-Apr-2000 22:30 09-Apr-2000 16:59 278 02-Apr-2000 11:19 02-Apr-2000 11:21 279 12-Apr-2000 09:17 12-Apr-2000 09:20 28-Apr-2000 22:01 29-Apr-2000 16:00 280 22-Apr-2000 07:16 22-Apr-2000 07:18 281 02-May-2000 05:14 02-May-2000 05:17 15-May-2000 20:17 16-May-2000 13:44 282 12-May-2000 03:13 12-May-2000 03:15 283 22-May-2000 01:11 22-May-2000 01:14 29-May-2000 20:15 30-May-2000 13:45 283 22-May-2000 01:11 22-May-2000 01:14 284 31-May-2000 23:10 31-May-2000 23:12 14-Jun-2000 21:15 15-Jun-2000 14:45 285 10-Jun-2000 21:09 10-Jun-2000 21:11 286 20-Jun-2000 19:07 20-Jun-2000 19:09 13-Aug-2000 18:35 14-Aug-2000 13:08 291 09-Aug-2000 09:00 09-Aug-2000 09:02 292 19-Aug-2000 06:58 19-Aug-2000 07:00 27-Aug-2000 18:16 28-Aug-2000 07:03 292 19-Aug-2000 06:58 19-Aug-2000 07:00 293 29-Aug-2000 04:57 29-Aug-2000 04:59 27-Sep-2000 21:01 28-Sep-2000 15:00 296 27-Sep-2000 22:52 27-Sep-2000 22:55 297 07-Oct-2000 20:51 07-Oct-2000 20:53 25-Oct-2000 21:15 26-Oct-2000 14:14 298 17-Oct-2000 18:49 17-Oct-2000 18:52 299 27-Oct-2000 16:48 27-Oct-2000 16:50 22-Nov-2000 22:10 23-Nov-2000 16:15 301 16-Nov-2000 12:45 16-Nov-2000 12:47 302 26-Nov-2000 10:43 26-Nov-2000 10:46 13-Dec-2000 22:16 14-Dec-2000 16:20 303 06-Dec-2000 08:42 06-Dec-2000 08:44 304 16-Dec-2000 06:40 16-Dec-2000 06:43
_____________________________________________________________________________________________________________________________
Abbreviations are: XBT, eXpendable BathyThermograph; T/P, TOPEX/Poseidon
error value is not significantly greater than the 2-cm solution obtained near Sao Tome Island (Verstraete and Park, 1995) and indicates that the T/P-derived altimetric heights are accu-rate enough in the area when used to investigate the seasonal variability.
3 XBT survey results
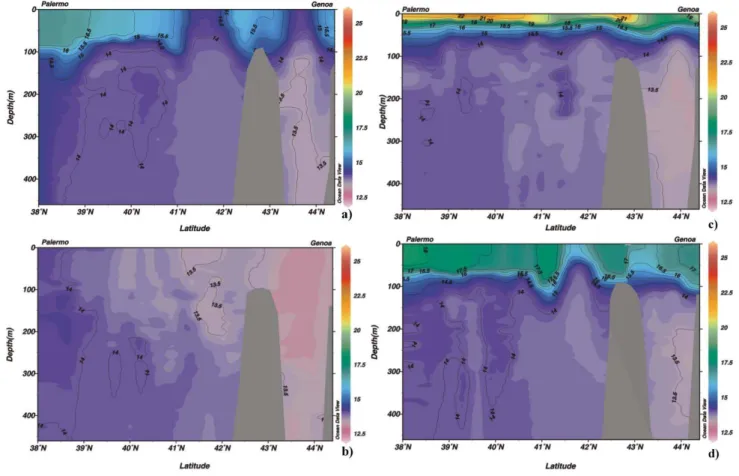
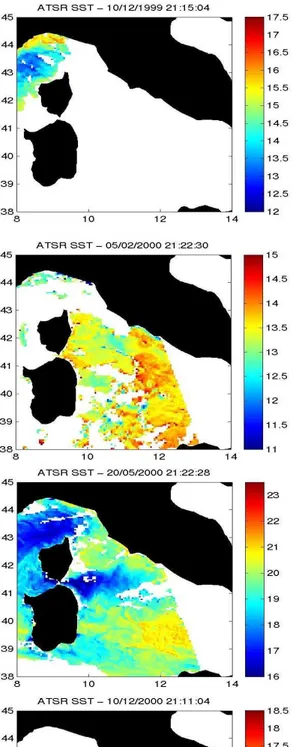
Some significant examples of temperature sections col-lected during the survey period (September 1999 to Decem-ber 2000) are shown in Fig. 4 and discussed below. When possible, the interpretation of each section was integrated by the Sea Surface Temperature (SST) images (Fig. 5) from the Along-Track Scanning Radiometer (ATSR) on board ERS-2. A more complete overview of the temporal evolution of the upper thermal structure within the Mediterranean Sea can be found in Fusco et al. (2003).
The section of 15–16 December 1999 (Fig. 4a) is represen-tative of a typical situation during autumn, when the mixed layer approaches a depth of around 100 m. A progressive decreasing of temperatures from lower to higher latitudes is observed. The subsurface temperatures are about 14◦C in the Tyrrhenian Sea, as compared to values lower than 13.5◦C in the greatest part of the Ligurian Sea. A weakening of the stratification by the uplift of the isotherms is also evi-dent in correspondence of the well-known quasi-permanent cyclonic structures: the Bonifacio Gyre in the northern part
of the Tyrrhenian Sea around 41.5◦N and the Ligurian Gyre at about 43.5◦N. The ATSR image taken on 10 December (Fig. 5) has cloud-free areas only over part of the Ligurian Sea and show the surface signature of the Ligurian Gyre as having a temperature of about 14◦C, while on its northern boundary the temperature increases to>15.5◦C, in perfect
agreement with the XBT near-surface data. The image on 13 December, conversely, is free from clouds over most of the Tyrrhenian and shows clearly the signature of the Boni-facio Gyre around 41.5◦N, with a marked temperature front and smaller scale instabilities on its southern side, where the temperature increases from∼14◦C to about 16◦C and then to almost 17◦C along the T/P track towards the Sicilian coast, still in good qualitative and quantitative agreement with the XBTs.
Fig. 4.Temperature sections from four XBT sections through the Tyrrhenian and Ligurian Seas:(a)15–16 December 1999;(b)22–23 Febru-ary 2000;(c)29–30 May 2000;(d)13–14 December 2000.
A much stronger stratification at the surface characterizes 29–30 May 2000 (Fig. 4c), when the thermocline is in the developing phase. Colder features can also be observed in correspondence of cyclonic gyres, especially in the Ligurian Sea. The SST image for 20 May (Fig. 5c) shows clearly the cold core (18–19◦C) of the Bonifacio Gyre. On the 30 May image, a number of smaller scale structures in the central and SW part of the basin are also evident.
The section of 13–14 December 2000 (Fig. 4d), if com-pared with that of 15–16 December 1999 (Fig. 4a), gives some evidence of interannual variability of the upper thermal layer. On December 2000 we can observe higher tempera-tures in the mixed layer and a relatively strong thermocline, a situation more similar to a summer period. Also, there ap-pears to be less divergence in the gyres, which exhibit larger temperature gradients. The higher temperatures (on average, about+1◦C warmer than the corresponding period in 1999) are confirmed by ATSR imagery of 10 December and 16 De-cember (Fig. 5d), clearly showing a fully developed Bonifa-cio Gyre. On the 10 December image, a patch of very warm (> 18◦C) water can be noted immediately to the south of the gyre (around 11.2◦E, 41◦N), a feature also apparent in the XBT profile (the 16 December image is cloudy over that location).
The XBT sections (Fig. 4) and the ATSR SST imagery (Fig. 5) confirm that three main semipermanent oceano-graphic features are present in the area: two cold features cor-respond to the Ligurian and Bonifacio Gyres, and a warmer patch of water, related to the MAW and LIW influx, near the coast of Sicily. These features had been described from in situ data and satellite infrared images in previous works by Artale et al. (1994) and Marullo et al. (1994).
4 Comparison of altimetric heights with XBT steric heights
XBT temperature sections collected across the Tyrrhenian and Ligurian Seas in 1999 and 2000, of which those dis-cussed above are a subset, allow one to assess the ability of satellite altimetry, to detect the oceanographic features, as already shown by other authors (e.g. Gilson et al., 1998; Buongiorno Nardelli et al., 1999). The steric heights are cal-culated, as explained in Sect. 2.1, assuming 300 m as a ref-erence level for each available track. Successively, they are interpolated onto the same regular ship track, with values ev-ery 0.1◦in latitude.
a)
b)
c)
d)
Fig. 5. Sea surface temperatures from ATSR images collected in the time frame of the XBT sections shown in Fig. 4: (a)10–16
02-APR-2000 08-APR-2000 12-APR-2000 17-SEP-1999 20-SEP-1999 27-SEP-1999 -10 10 -5 0 5 10
38 39 40 41 42 43 44 45 38 39 40 41 42 43 44 45
-10 10 -5 0 5 10 -10 10 -5 0 5 10 -10 10 -5 0 5 10 -10 10 -5 0 5 10 -10 10 -5 0 5 10 -10 10 -5 0 5 10 -10 10 -5 0 5 10 -10 10 -5 0 5 10 -10 10 -5 0 5 10 -10 10 -5 0 5 10 22-APR-2000 28-APR-2000 02-MAY-2000 16-OCT-1999 20-OCT-1999 26-OCT-1999 05-NOV-1999 10-NOV-1999 15-NOV-1999 12-MAY-2000 15-MAY-2000 22-MAY-2000 25-NOV-1999 01-DEC-1999 05-DEC-1999 22-MAY-2000 29-MAY-2000 31-MAY-2000 15-DEC-1999 15-DEC-1999 25-DEC-1999 10-JUN-2000 14-JUN-2000 20-JUN-2000 04-JAN-2000 11-JAN-2000 14-JAN-2000 09-AUG-2000 13-AUG-2000 19-AUG-2000 02-FEB-2000 08-FEB-2000 12-FEB-2000 19-AUG-2000 27-AUG-2000 29-AUG-2000 27-SEP-2000 27-SEP-2000 07-OCT-2000 22-FEB-2000 22-FEB-2000 03-MAR-2000 17-OCT-2000 25-OCT-2000 27-OCT-2000 03-MAR-2000 08-MAR-2000 13-MAR-2000 16-NOV-2000 22-NOV-2000 26-NOV-2000 13-MAR-2000 21-MAR-2000 23-MAR-2000 06-DEC-2000 13-DEC-2000 16-DEC-2000 24-JAN-2000 25-JAN-2000 02-FEB-2000 cm Latitude Latitude
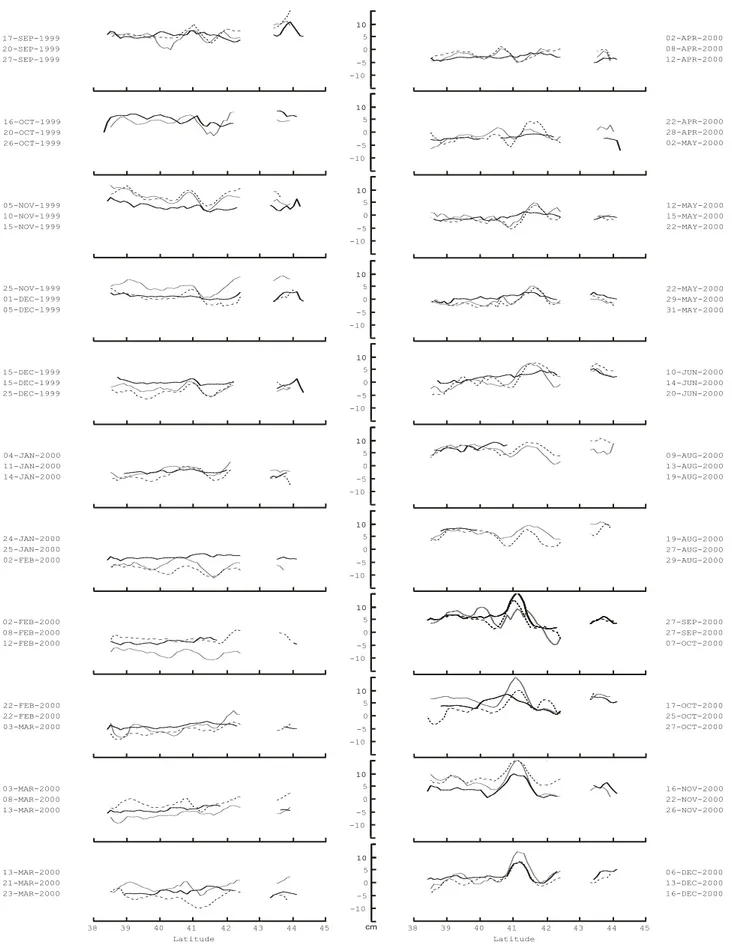
Fig. 6.XBT steric heights relative to 300 m for the 22 cruises (tick solid line). Dashed (shaded) lines are the altimetric heights before (after)
only the time-varying parts of the XBT steric and altimet-ric heights. As stated before, the altimetaltimet-ric height anomaly was initially derived with respect to a true 3–year mean sea surface over the 1993–1995 reference period, which obvi-ously accounts for the geoid plus the time-averaged sea level signal (that is, the geoid plus the mean of the dynamic topog-raphy). To allow for a proper comparison of the altimeter-and XBT-derived anomalies, these must necessarily be rela-tive to the same time period, so the altimetric anomalies were re-referenced to the September 1999 to August 2000 mean by subtracting from them the difference between the mean over this period and the mean over the reference period.
For each XBT profile, we selected the two T/P passes clos-est in time (see Table 1), which are within 10 days of the se-lected cruise. Therefore, patterns that are strongly variable on time scales of less than 10 days would be found by the al-timeter only if a satellite track has crossed the region at a time sufficiently close to the hydrographic measurement. Both steric heights (thick solid line) and the corresponding alti-metric heights (dashed and shaded lines) are plotted in Fig. 6 for all 22 realizations of comparison. There is a good visual agreement between the two data sets. However, before as-sessing this agreement, it is necessary to examine the issue of the temporal mismatch more closely. The difference between any XBT-derived height and the nearest altimetric heights with respect to time was computed. The height mismatch is then represented as a function of the temporal mismatch. As expected, the height mismatch becomes quite small as the temporal difference decreases (less than 2 cm RMS with less than a 5–day separation). Therefore, it is appropriate to com-pare the spatial structures of the features observed in the two data sets.
The most obvious changes from cruise to cruise occur in the North Tyrrhenian Sea, where the Bonifacio Gyre appears to have a stronger intensity in September through Decem-ber 2000. The lack of a clear feature in some cruises might be explained by the fact that both the ship and altimeter tracks missed the gyre. A less developed spatial structure of the gyre would thus reflect the loss of the signal along the track. Small-scale features in altimetric heights are sometimes not well represented in the XBT data set. This loss of variability on small spatial scales is probably due to the higher sam-pling of T/P data along the track (about 6 km versus 20 km of XBT data). Profiles also provide evidences for differences on very long scales. In some cruises, the altimetric heights are somewhat higher (e.g. 10 November 1999) or lower (e.g. 15 December 1999) than the steric heights over most of the transect. The above aspects will be the focus of the remain-der of the paper.
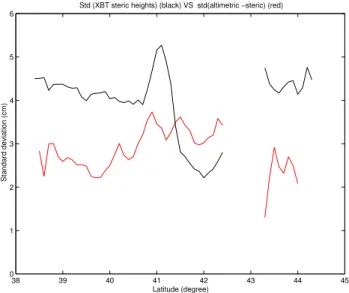
The overall RMS of the difference between steric and al-timetric heights is about 3 cm, compared to the 2–4 cm es-timated approximation error for the in situ data. The RMS in steric height, as a function of latitude, is shown in Fig. 7. As expected, variability is greater in the northern part of the Tyrrhenian Sea, where the larger temperature gradients are observed. There is a maximum centered near 41◦N (which is discussed below) followed by a steep ramp down to an
ad-38 39 40 41 42 43 44 45
0 1 2 3 4 5 6
Std (XBT steric heights) (black) VS std(altimetric −steric) (red)
Latitude (degree)
Standard deviation (cm)
Fig. 7.Standard deviation of steric height (0/300 dbars), as a
func-tion of latitude, based on the 22 cruises (black line) and RMS be-tween steric height and altimetric height (red line).
jacent trough, corresponding to the central part of the Bonifa-cio Gyre: a very stable cold region already seen in the XBT vertical sections in Fig. 4. Figure 7 also shows the RMS difference between altimetric and steric heights, which oscil-lates within 2–4 cm over the entire transect, thus, providing scope for a further comparison between the two data sets. The comparison is much more difficult in the Ligurian Sea because there are fewer good XBT points, most of them hav-ing been collected in waters shallower than 300 m, where er-rors in tidal models further reduce the accuracy of the al-timetric heights. The correlation coefficient for each case ranges from 0.4–0.5 during the winter period to 0.65 during autumn, with a mean value of 0.55. The maximum correla-tion is reached in correspondence to more intense baroclinic dynamics.
A spectral analysis was carried out to evaluate the differ-ences between XBT steric and altimetric heights as a func-tion of spatial scales. Both data sets exhibit similar be-haviour, although the energy of the steric heights was lower than that of the altimetric heights (as in Vignudelli, 1997). Figure 8a shows the spectra time-averaged over all data sets, computed from 0.1◦ equally spaced points of the
a)
b)
c)
Fig. 8. (a)Spectra of steric heights (red line) and T/P altimetric
heights (blue line). (b)Coherence amplitude. (c)Phase between steric and altimetric heights (positive phase indicates steric height leads).
all the factors explained before. But the fact that energy in XBT-derived heights is reduced at all wavelengths points to an underestimate of steric variability, probably related to the use of climatological salinity in computing steric heights and to the choice of the reference level. Over-smoothing in the climatological profiles will reduce the variability and thus, the energy in the situ data (Hopkins, 1988).
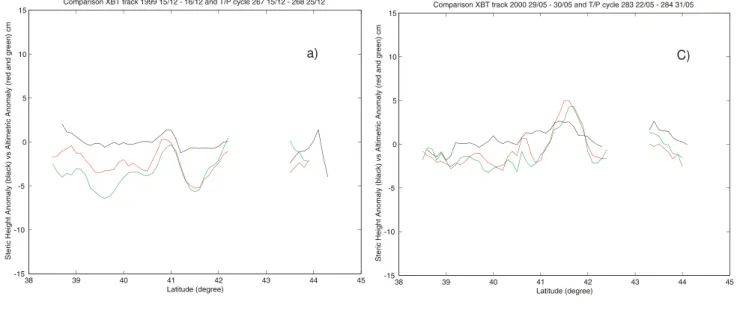
The same XBT surveys presented in Fig. 4, and the T/P passes closest in time, are selected as examples of detailed comparisons between altimetric and steric heights. Each comparison includes a plot showing XBT and altimetric-derived heights versus latitude. The first set (Fig. 9a) is from the 15–16 December 1999 cruise. The altimeter data used to generate the comparison are from overpasses in the same time frame (red line) and after 10 days (green line). Both altimetric profiles provide evidence of a topographic trough near 41.5◦N, a clear surface manifestation of the Bonifacio Gyre, bounded on the southern edge by a steep ramp. The
maximum coincides with the maximum of XBT height vari-ability in Fig. 7 and corresponds to a deepening of the ther-mocline in the XBT data of Figure 4a. Due to its position, it is likely that this maximum be the direct effect of wind blow-ing through the Bonifacio Strait (Artale et al., 1994). The same structure seen in altimetry was also evident in the XBT height profile, although less pronounced and with reduced amplitude. Agreement between satellite and in situ data was also good in the southern part of the transect. It should be noted that over the whole Tyrrhenian, T/P-derived heights from cycle 267 mirror the thermocline depth accurately from the XBT section in Fig. 4a (oscillations of the order of 50 m in the thermocline correspond to surface variations of oppo-site sign, with amplitudes of the order of 5 cm). Such good agreement is also present in the southern part of the track. As previously stated, the interpretation over the Ligurian Sea is not reliable due to the small number of points.
The weaker winter stratification reduces the variabil-ity considerably, especially for the steric heights on 22– 23 February 2000 (Fig. 9b). Altimeter and in situ data ev-idence the same northward trend, but the steep increase in the altimeter signal is not shown in steric heights.
Results from 29–30 May 2000 survey are shown in Fig. 9c. The dip in the height profiles, although less developed than in December 1999, is still visible. A small shift northward in the location of the feature is also observed, as confirmed by the temperature section. Though basically similar, the altimetric heights exhibit a rise around 41.5◦N, which was not reflected in the XBT data. In this particular example, there is also some agreement in the Ligurian Sea between the deep structure and both the satellite- and XBT-derived heights, which mirror the slope of the thermocline.
Figure 9d shows the comparison with reference to the 13– 14 December 2000 survey. The shape of the altimeter heights agrees well with the shape of the steric heights. The position of the Bonifacio Gyre is readily inferred, centered around 41.8◦N. The structure is essentially the same as seen in De-cember 1999, although more developed, with the southern side of the trough steeper than the northern side.
5 Discussion
a)
b) b)
C)
d)
Fig. 9. Comparison of altimetric heights (green and red lines) and steric heights calculated from the XBT data and climatological salinity
(black line).(a)15–16 December 1999;(b)22–23 February 2000;(c)29–30 May 2000;(d)13–14 December 2000.
The intercomparison demonstrates a significant agreement in terms of correlation coefficient. The RMS difference across the section is less than 3 cm (Fig. 7). Combining the error estimates of T/P and XBT anomalies gives an RMS er-ror of the same order of magnitude of the observed RMS variability, indicating that only a negligible part of the differ-ence seems to be related to dynamics. An intriguing aspect is, however, seen in proximity of the Bonifacio Gyre. Here, the RMS of the difference is systematically higher than that ob-served in the remainder of the transect. Dynamical interpre-tation of the differences requires knowledge of whether these are due to a deeper baroclinic variability and/or a barotropic contribution. As shown by Vignudelli et al. (2000), the steric contribution resulting from density variation in the upper
lay-ers is much larger than that due to the deep laylay-ers. By con-trast, large-scale features, like the Bonifacio Gyre, clearly may extend beyond the 300 m depth, causing mass redistri-bution (bottom pressure variability), whose effect is to offset the total sea level.
tem-poral mismatch and different spatial resolution between the two data sets. It is also believed that the coherence amplitude drops seen in Fig. 8b are due in part to a barotropic compo-nent of circulation, which is not reflected in the correspond-ing hydrographic data.
When discussing the temporal variability, it should be kept in mind that the XBT data only span slightly more than one full year and clearly, this is not enough to do a very com-plete analysis of seasonal/interannual variability. The rela-tively short record is clearly dominated by the seasonal cycle related to the steric heating and cooling of the upper water column. In taking the difference between XBT and altimetric heights, both the seasonal heating/cooling, which is confined in the upper layers and the baroclinic contribution above 300 m, are removed, since both measurement systems ob-serve these components. Therefore, the difference can arise from either deep baroclinic contributions, or barotropic com-ponents generated by wind forcing, and/or instrument noise. On seasonal time scales the two measures differ by only a 2 cm RMS. This number is considered conservative since it decreases with further temporal and spatial averaging.
Although the major objective of the present work is to verify altimetric results, the analysis has demonstrated that both data sets observe the overall spatial and seasonal pat-terns. The results also emphasize their complementariety in that they provide a dynamically complete description of the circulation. Nevertheless, further efforts should be made to improve the quality of the altimeter retrievals using correc-tion models and processing methods tuned to the local con-ditions. Moreover, the salinity reconstruction technique has to be improved, in order to take into account the thermal and salinity characteristics of the study area. The main problem of the technique is that it requires a monotonic behaviour of the profiles, a condition that is not always found during the winter period. Some improvements (dividing the pro-files in sub-parts and reconstructing the salinity for each part) were suggested in Lagerloef (1994); however, these do not guarantee the continuity of the reconstructed profiles. The limitation of the methodology is then crucial in areas, such as the Ligurian-Tyrrhenian region, where temperature inver-sions are often found.
Acknowledgements. The authors are grateful to Antonio Baldi, Carlo Galli, Egisto Lazzoni, Massimo Morgigni, involved with the data collection during the monitoring. We especially thank the Mas-ters and Crew Members, the Board of Directors and the agents of Excelsior – Grimaldi Italy, for their valuable support and assistance. We also thank Rutherford Appleton Laboratories for the provision of ATSR data used in Sect. 3 and Graham Quartly for his help with ATSR data processing. This work was supported by EC MAST Project MFSPP (contract MAS3-CT98–0171) and by the Italian Space Agency (ASI). Figure 4 is done using Ocean Data View soft-ware by R. Schiltzer (www.awi-bremerhaven.de/GEO/ODV).
Topical Editor N. Pinardi thanks L. Santoleri and another referee for their help in evaluating this paper.
References
Artale, V., Astraldi, M., Buffoni, G., and Gasparini, G. P.: Seasonal variability of gyre-scale circulation in the North Tyrrhenian sea, J. Geophys. Res., 99, 14 127–14 137, 1994.
Astraldi, M. and Gasparini, G. P.: The seasonal characteristics of the circulation in the north Mediterranean basin and their rela-tionship with the atmospheric-climatic conditions, J. Geophys. Res., 97, 9531–9540, 1992.
Astraldi, M. and Gasparini, G. P.: The Seasonal Characteristics of the Circulation in the Tyrrhenian Sea, In: Seasonal and Interan-nual Variability of the western Mediterranean Sea, Coastal and Estuarine Studies, vol. 46, (Ed) La Violette, P. E., AGU, Wash-ington, D.C., 115–134, 1994.
Astraldi, M., Gasparini, G. P., Vetrano, A., and Vignudelli, S.: Hy-drographic characteristics and interannual variability of water masses in the Central Mediterranean Region: a sensitivity test for long-term changes in the Mediterranean, Deep Sea Res., 49, 661–680, 2002.
AVISO: AVISO User Handbook: merged TOPEX/Poseidon prod-ucts, Tech. Rep.AVI-NT-02–101-CN, ed. 3.0, Toulouse, France, 1996.
Ayoub, N., Le Traon, P. Y., and De Mey, P.: A description of the Mediterranean surface variable circulation from combined ERS-1 and TOPEX/Poseidon altimetric data, J. Mar. Syst., ERS-18, 3–40, 1998.
Brankart, J. M. and Pinardi, N.: Abrupt cooling of the Mediter-ranean Levantine Intermediate water at the beginning of the 1980 s: observational evidence and model simulation, J. Phys. Ocean., 31, 2307–2320, 2001.
Buongiorno Nardelli, B., Santoleri, R., Marullo, S., Iudicone, D., and Zoffoli, S.: Altimetric sea level anomalies and three-dimensional structure of the sea in the Channel of Sicily, J. Geo-phys. Res., 104, 20 585–20 603, 1999.
Donguy, J. R., Eldin, G., and Wyrtki, K.: Sea level and dynamic topography in the western Pacific during 1982–83 El Ni˜no, Trop. Ocean-Atmos. Newsletters 36, 1–3, 1986.
Eanes, R. J.: Diurnal and semidiurnal tides from TOPEX/Poseidon, EOS Transactions, Am. Geophys. Un., 75, pp. 108, 1994. Emery, W. J.: Dynamic height from temperature profiles, J. Phys.
Ocean., 5, 369–375, 1975.
Emery, W. J. and Wert, R. T.: Temperature-Salinity curves in the Pacific and their application to dynamic height computation, J. Phys. Ocean., 6, 613–617, 1976.
Emery, W. J. and O’Brien, A.: Inferring salinity from temperature or depth for dynamic height computations in the North Pacific, Atmosphere-Ocean 16, 348–366, 1978.
Emery, W. J. and Dewar, J. S.: Mean temperature-salinity, salinity-depth and temperature-salinity-depth curves for the North Atlantic and the North Pacific, Progr. Oceanog. 11, 219–305, 1982.
Fu, L.-L., Christensen, E. J., Yamarone, C. A. Jr., Lefebvre, M., Menard, Y., Dorrer, M., and Escudier, P.: TOPEX/Poseidon mis-sion overview, J. Geophys. Res., 99, 24 369–24 381, 1994. Fusco, G., Manzella, G. M. R., Cruzado, A., Gacic, M.,
Gas-parini, G. P., Kovacevic, V., Millot, C., Tziavos, C., Ve-lasquez, Z. R., Walne, A., Zervakis, V., and Zodiatis, G.: Vari-ability of mesoscale features in the Mediterranean Sea from XBT data analysis, Ann. Geophisicae, this issue, 2003.
Hopkins, T. S.: Recent observations on intermediate and deep water circulation in the Southern Tyrrhenian Sea, Oceanologica Acta, 9, 41–50, 1988.
Iudicone, D., Santoleri, R., Marullo, S., and Gerosa, P.: Sea level variability and surface eddy statistics in the Mediterranean Sea from TOPEX/Poseidon data, J. Geophys. Res., 103, 2995–3012, 1998.
Kessler, W. S. and Taft, B. A.: Dynamic heights and zonal geostrophic transports in the central tropical Pacific during 1979– 84, J. Phys. Ocean., 17, 97–122, 1987.
Lagerloef, G. S. E.: An alternate method for estimating dynamic height from XBT profiles using empirical vertical modes, J. of Phys. Ocean., 24, 205–213, 1994.
Larnicol, G., Le Traon, P. Y., Ayoub, N., and De Mey, P.: Mean sea level and surface circulation of the Mediterranean sea from two years of TOPEX/Poseidon data, J. Geophys. Res., 100, 25 163– 25 177, 1995.
Manzella, G. M. R. and MFS-VOS Group (Bruschi, A., Cruzado, A., Fusco, G., Gacic, M., Gasparini, G. P., Gervais, T., Kovacevic, V., Millot, C., Tonani, M., Tziavos, C., Velasquez, Z., Walne, A., Zervakis, V., and Zodiatis, G.): A Marine Information System for Ocean Predictions, In: Ocean Forecasting: Concep-tual Basis and Applications, (Eds) Pinardi, N. and Woods, J. D., 37–53, 2002.
Marullo, S., Santoleri, R., and Bignami, F.: The Surface Character-istics of the Tyrrhenian Sea: Historical Satellite Data Analysis, In: Seasonal and Interannual Variability of the Western Mediter-ranean Sea, Coastal and Estuarine Studies, vol. 46, (Ed) La Vio-lette, P. E., AGU, Washington, D. C., 134–154, 1994.
McCarthy, M. C., Talley, L. D., and Roemmich, D.: Seasonal to interannual variability from expendable bathythermograph and
TOPEX/Poseidon altimeter data in the South Pacific subtopical gyre, J. Geophys. Res., 105, 19 535–19 550, 2000.
Siedler, G. and Stramma, L.: The applicability of the T/S method to geopotential anomaly computations in the Northeast Atlantic, Oceanologica Acta, 6, 167–172, 1983.
Sparnocchia, S., Picco, P., Manzella, G. M. R., Ribotti, A., Copello, S., and Brasey, P.: Intermediate water formation in the Ligurian Sea, Oceanologica Acta, 18, 151–162, 1995.
Sparnocchia, S., Pinardi, N., and Demirov, E.: Multivariate Em-pirical Orthogonal Function analysis of the upper thermocline structure of the Mediterranean Sea from observations and model simulations, Ann. Geophysicae, this issue, 2003.
Stommel, W. J.: Note on the use of T–S correlation for dynamic height anomaly computation, J. Marine Res. 5(2), 85–92, 1947. Troccoli, A. and Haines, K.: Use of the temperature-salinity relation
in a data assimilation context, J. Atmos. Ocean. Technol., 16, 2011–2025, 1999.
Verstraete, J. M. and Park, Y. H.: Comparison of TOPEX/Poseidon altimetry and in situ sea level data at Sao Tome Island, Gulf of Guinea, J. Geophys. Res., 100, 25 129–25 134, 1995.
Vignudelli, S.: Potential use of ERS-1 and Topex/Poseidon altime-ters for resolving oceanographic patterns in the Algerian Basin, Geophys. Res. Lett., 24, 14, 1787–1790, 1997.
Vignudelli, S., Cipollini, P., Astraldi, M., Gasparini, G. P., and Manzella, G.: Integrated use of altimeter and in situ data for understanding the water exchanges between the Tyrrhenian and Ligurian Seas, J. Geophys. Res., 105, 19 649–19 663, 2000. Vossepoel, F. C., Reynolds, R. W., and Miller, L.: Use of sea level