Based Active Contour Segmentation of Uterine Fibroid
Ultrasound Images in HIFU Therapy
Xiangyun Liao1, Zhiyong Yuan1*, Qi Zheng1, Qian Yin2, Dong Zhang3, Jianhui Zhao1
1School of Computer, Wuhan University, Wuhan, Hubei, China,2College of Information Science and Technology, Beijing Normal University, Beijing, China,3School of Physics and Technology, Wuhan University, Wuhan, Hubei, China
Abstract
Purpose: To overcome the severe intensity inhomogeneity and blurry boundaries in HIFU (High Intensity Focused Ultrasound) ultrasound images, an accurate and efficient multi-scale and shape constrained localized region-based active contour model (MSLCV), was developed to accurately and efficiently segment the target region in HIFU ultrasound images of uterine fibroids.
Methods:We incorporated a new shape constraint into the localized region-based active contour, which constrained the active contour to obtain the desired, accurate segmentation, avoiding boundary leakage and excessive contraction. Localized region-based active contour modeling is suitable for ultrasound images, but it still cannot acquire satisfactory segmentation for HIFU ultrasound images of uterine fibroids. We improved the localized region-based active contour model by incorporating a shape constraint into region-based level set framework to increase segmentation accuracy. Some improvement measures were proposed to overcome the sensitivity of initialization, and a multi-scale segmentation method was proposed to improve segmentation efficiency. We also designed an adaptive localizing radius size selection function to acquire better segmentation results.
Results: Experimental results demonstrated that the MSLCV model was significantly more accurate and efficient than conventional methods. The MSLCV model has been quantitatively validated via experiments, obtaining an average of 0.94 for the DSC (Dice similarity coefficient) and 25.16 for the MSSD (mean sum of square distance). Moreover, by using the multi-scale segmentation method, the MSLCV model’s average segmentation time was decreased to approximately 1/8 that of the localized region-based active contour model (the LCV model).
Conclusions:An accurate and efficient multi-scale and shape constrained localized region-based active contour model was designed for the semi-automatic segmentation of uterine fibroid ultrasound (UFUS) images in HIFU therapy. Compared with other methods, it provided more accurate and more efficient segmentation results that are very close to those obtained from manual segmentation by a specialist.
Citation:Liao X, Yuan Z, Zheng Q, Yin Q, Zhang D, et al. (2014) Multi-Scale and Shape Constrained Localized Region-Based Active Contour Segmentation of Uterine Fibroid Ultrasound Images in HIFU Therapy. PLoS ONE 9(7): e103334. doi:10.1371/journal.pone.0103334
Editor:Jie Tian, Institute of Automation, Chinese Academy of Sciences, China
ReceivedApril 16, 2014;AcceptedJune 27, 2014;PublishedJuly 25, 2014
Copyright:ß2014 Liao et al. This is an open-access article distributed under the terms of the Creative Commons Attribution License, which permits unrestricted use, distribution, and reproduction in any medium, provided the original author and source are credited.
Data Availability:The authors confirm that all data underlying the findings are fully available without restriction. All relevant data are within the paper and its Supporting Information files.
Funding:The presented research work was supported by the National Basic Research Program of China (2011CB707904), the National Natural Science Foundation of China (61372107, 61272276, and 61190125) and the Open Funding Project of State Key Laboratory of Virtual Technology and Systems, Beihang University (BUAA-VR-13KF-15). The funders had no role in study design, data collection and analysis, decision to publish, or preparation of the manuscript.
Competing Interests:The authors have declared that no competing interests exist. * Email: zhiyongyuan@whu.edu.cn
Introduction
Uterine fibroids are commonly occurring benign tumors that can trouble females. HIFU therapy, a new type of noninvasive surgery, has been gradually applied to the treatment of uterine fibroids for its safety and effectiveness, reducing pain caused by traditional surgery [1–4]. As is widely known, precise segmentation of ultrasound images has always been a problem with regard to image segmentation, and there has not been an ideal solution until now due to the images’ low SNR (signal to noise ratio), weak boundaries and intensity inhomogeneity [5]. More serious noise
Active contour modeling has been widely applied in medical image segmentation in recent years as a consequence of its smoothness and closure, and because it can obtain fairly good results [9–11]. Active contour modeling, which was first proposed by Kass et al. [12], can be classified into two categories: edge-based modeling [12–14] and region-edge-based modeling [15–18]. The edge-based active contour model adopts the image’s gradient information as an image-based ‘‘force’’ to push the contour toward the target boundary, and achieves a good segmentation result for target regions with clear edges. However, sensitivity to noise in the image and the initial contours [19], the two major drawbacks of this model, exist because gradient information is highly localized image information, so the problem of edge leakage can easily be produced when this model is applied to ultrasound images, such as GVF (Gradient Vectov Flow) [20]. Region-based active contour modeling, in which the driving force is formed using statistical information about the foreground and background regions, applies to image segmentation where the intensity is homogeneously distributed inside regions. The most famous region-based active contour model is the piecewise constant model by Chan and Vese (C-V model) [16], which effectively segments ultrasound images with noise and weak edges as a consequence of not using the images’ gradient information. However, incorrect results can be produced on HIFU ultrasound images with intensity inhomoge-neity because the C-V model assumes regions of intensity in the image are homogeneously distributed and utilizes global statistical information [16,19].
To overcome the shortcoming that makes the region-based active contour model difficult to use when segmenting targets with inhomogeneous intensity, localizing the region-based model has attracted interest, and many models using localized information have been proposed. Li et al. [21] presented a model where a kernel function was introduced to define local binary fitting energy in a variational level set framework, thus incorporating local grayscale information into a region-based active contour model. Then, Liet al. [18] made improvements on this model and studied in depth the selection of kernel functions and the size of localized regions. S. Lankton et al. [19] came up with a localizing framework that allowed a region-based energy equation that utilized global information to be rewritten in localized form and thoroughly analyzed the impact of the localizing radius on segmentation results. Zhang et al. [22] put forward a similar localized fitting energy, improving calculation efficiency. Later, Wang et al. [23] proposed a region-based grayscale level fitting energy combining global and local information with better flexibility. Similarly, Wu et al. [24] presented the average misclassification probability (AMP) model, as well as a global-to-local strategy by combining global and global-to-local information to enhance segmentation results on complex images. Appiaet al. [25] introduced a global edge-based constraint into the region-based model. All of these models include local information and are suitable approaches for the ultrasound image segmentation problem. They have better segmentation capacity for images with intensity inhomogeneity than region-based active contour models that use global information, but for UFUS images in HIFU therapy that have seriously low SNR, low contrast and weak edges, as shown in Figure 1, the localized region-based active contour model may still produce incorrect segmentation with boundary leakage or excessive contraction. To solve this problem, we proposed incorporating a shape constraint into the localized region-based active contour model. Meanwhile, we studied adaptive selection of localizing radius that is suitable for segmentation of UFUS images in HIFU therapy to acquire better segmentation results.
As mentioned in [5], for ultrasound images, depending only on edge and region information are usually not sufficient to obtain reliable and precise segmentation. In this case, shape constraint is usually used to improve the segmentation results [26–30]. Leventonet al. [26] used a level set representation to model the shape prior by computing a principal components analysis (PCA) of training shapes incorporated in level set functions, but the variational formulation was not associated with evolution equa-tion. Chen et al. [27] designed a novel variational model that incorporated prior shape knowledge into geometric active contours. Later, Chen presented a method to solve the minimi-zation problem of the coupling of prior shape and intensity profiles for image segmentation [28]. Bressonet al. [29] used a space of a given shape in the target region to build a shape energy and used local edge information and global image information at the same time. Recently, Wu et al. [30] also combined prior high-level shape information to build a non-parametric statistical shape model and applied it to prostate segmentation. Huanget al. [31] focuses on optimization of robust graph-based (RGB) segmenta-tion algorithm to extract breast tumors in ultrasound images more adaptively and accurately. Considering that the benign uterine fibroids usually approximate ellipsoid shapes of different sizes, we take an ellipse as an example to form a shape constraint to segment UFUS images for HIFU therapy. In this paper, we incorporate a shape constraint into a localized region-based level set framework to obtain the desired and accurate segmentation avoiding boundary leakage and excessive contraction.
To reduce the calculation time consumed by segmentation of HIFU ultrasonic images, a multi-scale segmentation method is an effective way to significantly improve the segmentation efficiency in HIFU therapy. Yu et al. [32] proposed a novel method for breast mass segmentation based on the level set method and multi-scale analysis. Kimet al. [33] introduced a flow-based multi-scale framework for unsupervised surface defect segmentation based on the multi-scale scheme of the phase spectrum of Fourier transform. Zhou et al. [34] proposed a new multi-scale saliency detection algorithm based on image patches. Wanget al. [35] presented a multi-scale framework for segmentation of ultrasound image based on speckle-reducing anisotropic diffusion and geodesic active contours. All of these previous works utilized multi-scale methods to improve segmentation efficiency by reducing the heavy computational burden in some way. Thus, we propose introducing a multi-scale segmentation method to improve the efficiency of segmentation of the target regions of UFUS in HIFU therapy.
In this work, our contributions are focused on following 3 parts. First, by incorporating a new shape constraint into localized region-based active contouring, the MSLCV model is able to address ultrasound images with substantial noise and weak edges, and even with some missing information. This model provides more precise segmentation, and the shape constraint is universal and easy to use. Second, to optimize the calculation, we analyze Figure 1. HIFU ultrasound images of uterine fibroids with extremely low SNR, low contrast and weak edges; the red arrows show edges that can easily lead to incorrect segmen-tation.
and utilize a multi-scale segmentation algorithm to greatly improve the efficiency of segmentation. Third, we have studied the selection of localizing the radius in depth and have designed an adaptive radius size selection function for the segmentation of UFUS images in HIFU therapy. Meanwhile, considering that the proposed method relies on initialization, we put forward some corresponding methods to reduce the initialization sensitivity.
The remainder of this paper is organized as follows. In the section ‘‘Materials and Methods’’, the proposed MSLCV model and two classical region-based active contour models are described in detail. These two classical region-based active contour models are the bases of the MSLCV model. Numerous experiments and comparisons are shown in the ‘‘Results’’ section. We analyze and discuss several key implementation details and improvement methods that play important roles in the accuracy and efficiency of segmentation in the ‘‘Discus-sion’’ section. Finally, in the ‘‘Conclusions’’ section, we summarize our work and give some directions for further research.
Materials and Methods
2.1 C-V Model
Chan and Vese [16] proposed a two-phase piecewise constant model (C-V model) by simplifying Mumford and Shah’s model [36] and combining the level set method. For a given grayscale image I:V?R, and a closed curve C, the energy function is
defined as follows:
ECVðc1,c2,CÞ~l1 ð
inside(C)
I xð Þc1 j j2dxz
l2 ð
outside(C)
I xð Þc2
j j2dxzm:length(C),
ð1Þ
where variablexinI(x)refers to a point inV, andoutside(C)and
inside(C)accordingly refer to regions outside and inside contour
C, respectively.c1and c2are two constants used to evaluate the image intensity of outside(C) and inside(C). Parameters l1, l2 andmare non-negative constants in whichl1andl2control the image data’s driving force inside and outside contour C, respectively, and m controls the smoothness of the contour. In equation (1), the first two terms use region-based global information for form fitting energy, which is called global fitting energy.
After minimizing the energy function in equation (1) and using the zero level set to express contour C~fx[Vjw(x)~0g in the level set method, we can obtainc1andc2and the variational level set equation as follows:
c1ð Þw ~ Ð
VI xð Þ:H0ðwð Þx Þdx Ð
VH0ðwð Þx Þdx
, ð2Þ
c2ð Þw ~ Ð
VI xð Þ:ð1{H0ðwð Þx ÞÞdx Ð
Vð1{H0ðwð ÞxÞÞdx
, ð3Þ
Lw
Lt~d0ð Þw {l1ðI{c1Þ
2zl2 I{c 2
ð Þ2zm:div +w
+w j j
, ð4Þ
wherew(x)represents the level set function,H0(x)is the Heaviside function,d0(w)is the Dirac function, and the derivative ofH0(x)is
{l1ðI{c1Þ2zl2ðI{c2Þ2, called the data fitting term, which controls the evolution of the curve.m:div(+w=j+wj), called the arc length term or regular term, determines the smoothness of the curve. The limitation of this model is that becausec1and
c2are acquired using region-based global information without considering localized image information, c1 and c2 might disappear from the original data when the image intensity is inhomogeneously distributed, resulting in segmentation error.
2.2 Localized Region-based Active Contour Model
To overcome the difficulty that the global region-based active contour model has with processing images with inhomogeneously distributed intensity, S. Lankton et al. [19] proposed a localized region-based active contour model that allowed any global energy formula based on regions to be rewritten into localized form, thus segmenting these images more efficiently and precisely using localized information. The basic idea of this model is that the localized energy of every point on the curve is calculated separately. To optimize the localized energy, every point is considered separately and moves toward the minimized energy calculated for the point’s localized region. Each point’s localized neighborhood is segmented into local inside and local outside by the evolving curve. Then, energy optimization is realized by a localized region fitting model.
To define the localized region for each point on the curve, an eigenfunction is defined as [19]:
B xð ,yÞ~ 1, x {y
k kvr
0, otherwise
, ð5Þ
wherex,y[Vrepresent each point as separate space variables, and
rrepresents the radius parameter. When pointyis in the circle centered atxand with a radius ofr, the value of the function is 1, otherwise 0.
The eigenfunction B(x,y) is adopted to acquire the average intensity inside and outside the localized region of pointxon the contour, respectively denoted bycx1andcx2:
cx1ð Þw~ Ð
VyB xð ,yÞ:H0ðwð ÞyÞ:I yð Þdy
Ð
VyB xð ,yÞ:H0ðwð ÞyÞdy
, ð6Þ
cx2ð Þw~ Ð
VyB xð ,yÞ:ð1{H0ðwð ÞyÞÞ:I yð Þdy
Ð
VyB xð ,yÞ:ð1{H0ðwð ÞyÞÞdy
, ð7Þ
whereVyis the local region defined byB(x,y). After applying the
localized framework into the C-V model, the localized version of the energy function and the curvature flow for point x are, respectively:
ELCVðcx1,cx2,wÞ~ ð
V d wð ð ÞxÞ
ð
Vy
B xð ,yÞ:FregionðI yð Þ,wð ÞyÞdydx
zm ð
V
d wð ð Þx Þk+w(x)kdx,
Lw
Ltð Þx ~
d wð ð ÞxÞ ð
Vy
B xð ,yÞd wð ð ÞyÞ: ðI yð Þ{cx1Þ2{ðI yð Þ{cx2Þ2
dy
"
zm:div +wð Þx
+wð Þx
j j
,
ð9Þ
where Fregion~H(w(y))(I(y){cx1)2z(1{H(w(y)))(I(y){cx2)2 represents the region-based force, d(w) is the Dirac function,
B(x,y)is the above-mentioned eigenfunction,xis a global point in the whole image, andyis a local point in the local region, which is the circle centered atx and with a radius of r. Compared with equation (4), here, l1~l2~1. H(w), compared with H0(w) mentioned above, is only a difference of definition of inside and outside the region. In the localized version, the energy is minimized when every point on the curve has moved such that its corresponding localized inside and outside region is the best estimate of localized averagecx1andcx2.
Here, we call this localized C-V model the LCV model, which segments images with inhomogeneously distributed intensity better than does the C-V model. However, for images for HIFU therapy with extremely low SNR, low contrast and blurry boundaries, the model still easily produced boundary leakage and excessive contraction. Moreover, because the LCV model applied the C-V model on every point on the curve separately, it resulted in a large amount of calculations and became time-consuming.
2.3 Multi-Scale and Shape Constrained Localized Region-based Active Contour Model
To overcome the limitations of the localized region-based active contour model, we propose an accurate and efficient multi-scale and shape constrained localized region-based active contour model, called the MSLCV model, which improves segmentation accuracy and efficiency, avoids boundary leakage and excessive contraction and reduces segmentation time. By incorporating a shape constraint, we obtain more accurate segmentation for uterine fibroid HIFU ultrasound images, and by using a multi-scale segmentation method, we improve the segmentation efficiency.
2.3.1 Shape Constrained Localized Region-based Active Contour Model. Traditional shape constrained models always need specified training followed by a complex matching process of shifting and stretching transformations [29], which is complicated and time-consuming. However, ultrasound imaging, due to its low SNR, low contrast and blurry boundaries, requires a good initial contour to obtain correct segmentation. Because uterine fibroids usually approximate elliptical shapes, we can set an ellipse of suitable size as an initial contour. Based on the LCV model, we utilized this initial contour as a simple and effective shape constraint to avoid boundary leakage and excessive contraction during the segmentation process. This shape constraint was incorporated into the level set framework of the LCV model, and accurate segmentation results were acquired in the experi-ments. Here, we call our proposed shape constrained localized region-based active contour model the SLCV model.
The basic idea is to add shape constraint energy to the process of separately calculating each point’s localized energy on the curve. The shape constraint energy is acquired by a function of the nearest distance between the point and the initial contour. We propose the following total energy function of the SLCV model by incorporating the shape constraint as:
ESLCVð Þw ~ ð
V d wð ð Þx Þ
ð
Vy
B xð ,yÞ:FregionðI yð Þ,wð ÞyÞdydx
zm ð
V
d wð ð ÞxÞk+wð Þxkdxzb ð
V
d wð ð Þx Þ:Fshapedx, ð10Þ
where
Fshape~signðw0ð ÞxÞkpx{pmink2, ð11Þ
signðw0ð ÞxÞ~
1, w0ð Þxw0 {1, w0ð Þx v0
0, w0ð Þx~0
8 > <
> :
, ð12Þ
wherepxis the location of pointxon the current contour in the
image, pmin is the location of the nearest point on the initial contour C0 to pointx, w0 is the level set representation of the initial contourC0,bis a positive constant determining the shape constraint force, and sign(w0(x)) is a function determining the direction of the shape constraint force to move it towards the initial contour. Localized average valuescx1and cx2 remain the same as in equations (6) and (7). In equation (10), the first term is the data fitting term, the second term is the arc length term, and the third term is the incorporated shape constraint term that forms the force toward the initial contour when the curve deforms in the evolution process.
By minimizing the energy function of the SLCV model, the corresponding level set evolution equation is:
Lw
Ltð Þx~
d wð ð Þx Þ ð
Vy
B xð ,yÞd wð ð ÞyÞ:ðI yð Þ{cx1Þ2{ðI yð Þ{cx2Þ2
dy
"
zm:div +wð Þx
+wð Þx
j j
zb:signðw0ð ÞxÞkpx{pmink2
:
ð13Þ
bin equation (10) and equation (13) decides the driving force of the shape constraint in the segmentation. When it approaches a maximum, the initial contour almost ceases to evolve, and the constraint degrades to non-existent when it approaches a minimum. b can be selected according to the quality of the images to be segmented.
In experiments, the Heaviside functionH(w(x))used to express the inside of contourCis defined using a smooth version as [19]:
HEðwð ÞxÞ~
1, wð Þx v{E
0, wð Þx wE
1 2 1z
wð Þx
E z
1
psin pwð Þx
E , otherwise 8 > > > < > > > :
:ð14Þ
The smooth version of the Dirac function,d(w(x)), used to mark nearby regions of the curve, is obtained through derivation of
dEðwð Þx Þ~
1, wð Þx ~0 0, jwð Þx jwE
1
2E 1zcos
pwð Þx E
, otherwise
8 > > > <
> > > :
: ð15Þ
Thus, the level set evolution equation is estimated as:
Lw
Ltð Þx ~
dEðwð Þx Þ ð
Vy
B xð ,yÞdEðwð ÞyÞ:ðI yð Þ{cx1Þ2{ðI yð Þ{cx2Þ2
dy
"
zm:div +wð Þx
+wð Þx
j j
zb:signðw0ð Þx Þkpx{pmink2
:
ð16Þ
This SLCV model has a natural shortcoming in that it relies on the quality of the initial contour. As uterine fibroids typically approximate elliptical shapes, in the experiments, we set ellipses of different sizes as the initial contours for the segmentation of uterine fibroids. In the discussion, we have also proposed some methods to reduce the initialization sensitivity. In the experiments, we normalized the region-based energy and then used it together with the arc length term and shape constraint term to act on the evolution of the curve. Figure 2 illustrates that the shape constraint force makes a difference in the segmentation of HIFU ultrasound images of uterine fibroids, effectively avoiding boundary leakage.
2.3.2 Multi-Scale Segmentation. To overcome the short-comings of the SLCV model of large amounts of computation and a time-consuming segmentation process, we propose the MSLCV model, which combines a multi-scale segmentation algorithm with our proposed SLCV model and incorporates a multi-scale concept into the process of evolving the level set curve and effectively reduces the calculation time. The basic idea is, in the process of curve evolution, we first use a Gaussian pyramid to decompose the ultrasound image into different scale images and then perform coarse segmentation on the coarse-scale image using the SLCV
model instead of directly using the original-size images. Then, we adopt the segmentation result as an initial contour for the fine-scale image, thus gradually optimizing the contour and reaching the final segmentation result. Because the amount of calculation is greatly reduced by using coarse segmentation on the coarse-scale image while obtaining an essentially correct result that is used as an initial contour for further segmentation, it takes only a few iterations to obtain satisfactory results. Thus, the MSLCV model reduces segmentation time while maintaining the accuracy of the segmentation results.
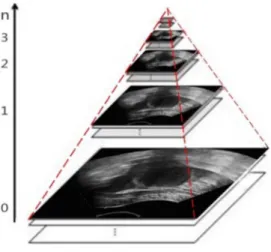
Let us suppose that the size of an image is M|N, and n
represents the scale. Now thatn~0represents the original image, the image with size (M=2)|(N=2) represents layer 1, …, the image with size (M=2n)|(N=2n) represents layer n, and the
Gaussian pyramid formed by decomposition is as shown in Figure 3.
The original size of the ultrasound images we used in the experiments is 524|413. To analyze accuracy and calculation time using different scales, we segmented HIFU ultrasound images with different scales and obtained Table 1 through our experi-ments as follows.
According to Table 1, the DSCs that represent the segmenta-tion accuracy of layer 0, layer 1 and layer 2 are nearly the same, while for layer 3, the DSC decreases due to a large loss of information that results in the images’ becoming overly vague. In regard to the calculation time, the segmentation time drops quickly with increasing numbers of layers and decreasing image size. The segmentation time for layer 2 dropped to less than 10 seconds.
Considering accuracy and time of segmentation, we chose the image from layer 2 as the input image for coarse-scale segmentation, and the original image for fine-scale segmentation. Because of the difference in the initial contour and the different results for the two segmentations, the parameter settings are also different. In the first segmentation, the initial contour is manually initialized using an ellipse. To overcome initialization sensitivity, the weight of the shape constraint is small and the localizing radius is large, whereas in the second segmentation, the weight of the shape constraint is large and the localizing radius is small. The process for the MSLCV algorithm can be described as Table 2: Figure 2. The shape constraint’s effect of avoiding boundary
leakage.The yellow curve represents the initial contour, the red curve represents the contour in the process of evolution, and the green curve represents the contour drawn manually by the specialist. The red arrows display the forces of the LCV model near regions of easily occurring boundary leakage, and the blue arrows represent the shape constraint forces pointing toward the direction of the initial contour.
doi:10.1371/journal.pone.0103334.g002
Figure 3. Decomposition images of the Gaussian pyramid.n
Results
We conducted experiments on a desktop with an Intel CPU of Core Dual-core E7500 2.93 GHz, 2 GB RAM, Windows XP 32-bit and Matlab 2012a.
3.1 Segmentation of Synthetic Images
We first used synthetic images to test the effects of the shape constraint proposed in this work. When initializing contours using an ellipse on the synthesized images shown in Figure 4, we utilized a shape constraint so that the final segmentation would retain an approximately elliptical contour. However, without a shape constraint, common segmentation results will stall at clear edges and cannot maintain the true shape of the target. The experiment indicates that boundary leakage and excessive contraction will not occur in the segmentation of images with information loss or severe noise near the target region when a shape constraint is introduced to maintain the true shape of the target.
3.2 Segmentation of Uterine Fibroids in HIFU Ultrasound Images
In this section, we tested our proposed MSLCV model on uterine fibroids in ultrasound images for HIFU therapy and compared it with the SLCV model, which is a version of the MSLCV model without multi-scale segmentation, and other
well-known methods that are suitable for ultrasound images with inhomogeneous intensity. All of the HIFU ultrasound images of uterine fibroids used here came from the HIFU center of The Second Affiliated Hospital of Chongqing Medical University.
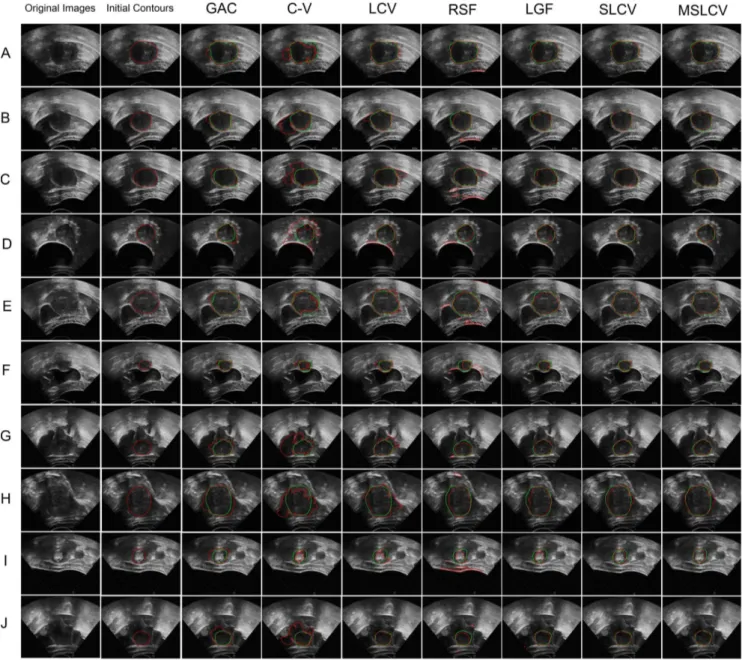
For ease of statistical analysis, the resolution of each image was adjusted to524|413. Using the software mentioned in [37], we compared the MSLCV model and the SLCV model with 5 other well-known methods on their performance in segmenting UFUS images for HIFU therapy, including an edge-based active contour model (GAC; geodesic active contours [13]) and region-based active contour models (C-V [16], LCV [19], RSF (region-scalable fitting) [18], and LGF (local Gaussian fitting) [38]). Figure 5 presents the experimental results from MSLCV, SLCV and the other five 5 methods when they were used to segment 10 typical ultrasound images of uterine fibroids for HIFU therapy. According to the images’ blurry boundaries, the HIFU ultrasound images of uterine fibroids are categorized into good, fair, and poor groups. Images A and B, with relatively clear boundaries, belong to the good group; images C, D, E and F, with blurry boundaries in some regions, belong to the fair group; and images G, H, I and J, with extremely blurry boundaries and low contrast, belong to the poor group. In the experiments, we set an ellipse of suitable size as the initial contour. The experimental results illustrate that MSLCV and SLCV can achieve more accurate segmentation results than the other 5 methods while avoiding boundary leakage and excessive contraction, even for the images in the poor group.
Table 2.The process the MSLCV algorithm.
Algorithm : MSLCV
1:The first segmentation:
2: Initialize contour asC0.
3: Assume the size of original imageI0isM|N,get the(M=4)|(N=4)imageI1and the corresponding contourC1by Gaussian Pyramid, initialize level set function
w1(x)fromC1by SDF (Signed Distance Function). 4:whilenot meet the iteration stop conditiondo
5: evolve the curveC1on imageI1by evolvingw1(x)using the evolution equation (14) 6:end while
7: get the first segmentation resultC2andw2(x),C2~fx[Vjw2(x)~0g. 8:The second segmentation:
9: getC3fromC2after interpolation and enlargement to the size ofI0and correspondingw3(x). 10:whilenot meet the iteration stop conditiondo
11: evolve the curveC3on imageI0by evolvingw3(x)using the evolution equation (14) 12:end while
13: get the second segmentation resultC4andw4(x),C4~fx[Vjw4(x)~0gas the final result.
doi:10.1371/journal.pone.0103334.t002
Table 1.Accuracy and calculation time under different scales (iterations = 300).
Layern Size Localized radius DSC Calculation time (s)
0 524|413 40 0.96 81.13
1 262|207 30 0.96 25.84
2 131|104 15 0.95 5.05
3 66|52 8 0.93 1.76
To more precisely estimate the quantitative comparison between the segmentation results and manual segmentation by a specialist, we adopt the Dice similarity coefficient (DSC) [39] and the mean sum of square distance (MSSD) [37] as standards. The Dice similarity coefficient is defined as:
DSC Sð S,SRÞ~
2Area Sð S\SRÞ Area Sð SÞzArea Sð RÞ
, ð17Þ
whereSSandSRrepresent segmentation results and ground truth,
respectively. The closer the value of the DSC is to 1, the better the segmentation result is.
The mean sum of square distance is defined as:
MSSD~1 N
XN n~1D
2
2ðA,B xð ÞnÞ, ð18Þ
D2ðA,B xð ÞÞ~min
y[Aðky{xkÞ, ð19Þ
whereAandBare the reference contour and the result contour of our algorithm, respectively, andNis the size of the result contour. The closer the value of the MSSD is to 0, the better the segmentation result is. We obtained table 3 via quantitative comparison of the MSLCV and the SLCV with the other five methods.
Meanwhile, in table 4, we compared the calculation times of these methods for the segmentation of UFUS images. For ease of comparison and full evolution of the curves, we set the number of iterations at 400. In Figure 5 and Table 3, we can see that the accuracy of the segmentation results for the SLCV and the MSLCV are very similar. The drop in the quality of the segmentation results when using MSLCV is almost negligible, while the segmentation efficiency is greatly improved by using the multi-scale algorithm, as shown in Table 4. This result confirms
the practicability of the multi-scale segmentation algorithm. As shown in Figure 6, the MSLCV model (the red line) achieves the best performance in the segmentation of HIFU ultrasound images of uterine fibroids when considering the overall evaluation of the of the DSC, MSSD and calculation time.
Discussion
4.1 Setting the Parameters
In equation (10), m and b are two important parameters. m decides the smoothness of the curve, and ifmis too small, it will result in some independent points in the segmented image with substantial noise. Thus in HIFU ultrasound images with consid-erable noise, we usually choose a relatively large value formas the weight of regular term.bdecides the value of the shape constraint forces in the segmentation. If its value is too large, the initial contour will evolve very little if at all; if it is too small, the proposed model will be degraded without shape constraint. In fact,bshould be chosen according to the quality of the images to be segmented. It can be a relatively small value if the image has clear edges and little noise; if the opposite is true,bshould be a relatively large value, thus enhancing the effect of the shape constraint. Meanwhile, the closer the initial contour is to the true contour of the target region, the largerbshould be. In the experiments, we choose 0.2 formand 0.5–0.9 forbfor the segmentation of HIFU ultrasound images of uterine fibroids because of the images’ quality and the uterine fibroids’ shape.
4.2 The Localizing Radius
As another important parameter, the localizing radius is separately discussed here because it decides localization, thereby affecting the final segmentation results. An improper localizing radius can produce incorrect results in regions with extensive noise. Figure 7 illustrates the effects of different localizing radii on segmentation results using the LCV and MSLCV models. In Figure 7(a) and Figure 7(d), the iteration was slow under a Figure 4. Segmentation of two synthetic images.Column (a) is initialization, column (b) is the segmentation results without shape constraint and column (c) is the segmentation results with shape constraint. Comparing column (b) with column (c), we can see that the incorporation of the shape constraint maintains an approximately elliptical contour in the final segmentation results in the segmentation of images with information loss or severe noise near the target region.
relatively small localizing radius that led to incorrect results, while in Figure 7(c) and Figure 7(f), we observe that the LCV model easily produces boundary leakage when the localizing radius is relatively large. Because of the shape constraint and multi-scale segmentation, the MSLCV model effectively reduced the problem of boundary leakage caused by the relatively large localizing radius while worsening the difficulty in evolving the contour when the localizing radius was relatively small. Thus, it is of great importance for segmentation accuracy and efficiency to choose a suitable localizing radius.
S. Lanktonet al. [19] discussed the effects of localizing radius in detail and noted that the localizing radius should be chosen according to the scale of the target region and the presence and proximity of surrounding noise, but they did not give a method for
adaptive selection of the localizing radius. We do so by making use of well-initialized contours. Because difference of the size of the target region may be substantial, to automate the selection of the localizing radius, we connect the selection to the size of the well-initialized contour. We take a proportion of the sum of the difference between the maximum and minimum values on thex
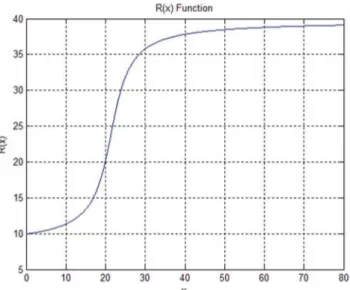
axis andyaxis, respectively, of the initial contour in the image as an input parameter of the localizing radius’ adaptive selection function. For example, if we utilize an ellipse to initialize the contour, we take a proportion of the sum of the major and minor axes of the ellipse. The localizing radius’s adaptive selection functionR(x)is defined as:
Figure 5. Comparison of the MSLCV and SLCV with five other well-known methods by applying them to segment 10 typical ultrasound images (A-J) of uterine fibroids for HIFU therapy.Columns 1 and 2 are the original images and the initial contours. Columns 3 to 9 respectively show the segmentation results for GAC [13], C-V [16], LCV [19], RSF [18], LGF [38], SLCV and MSLCV. The green curves are manual segmentation results by the specialist as ground truth, and the red curves are the final segmentation contours from these methods.
standards from the test images in Figure 5.
GAC C-V LCV RSF LGF SLCV MSLCV
A DSC 0.90 0.80 0.95 0.92 0.93 0.95 0.95
MSSD 187.98 615.70 37.22 1738.96 33.02 28.89 20.50
B DSC 0.91 0.70 0.92 0.86 0.93 0.97 0.96
MSSD 80.98 1608.76 154.27 2165.74 44.21 7.77 12.38
C DSC 0.88 0.75 0.89 0.81 0.94 0.96 0.95
MSSD 84.93 1068.30 391.88 2921.86 65.3 15.05 16.87
D DSC 0.88 0.50 0.83 0.88 0.94 0.94 0.96
MSSD 114.23 1270.8 1231.20 1229.52 45.57 17.81 10.38
E DSC 0.92 0.88 0.92 0.87 0.93 0.95 0.95
MSSD 71.23 177.42 115.73 3052.14 52.79 23.82 24.45
F DSC 0.89 0.70 0.84 0.50 0.89 0.91 0.91
MSSD 48.91 192.44 93.16 1925.36 30.99 16.71 25.67
G DSC 0.85 0.53 0.84 0.83 0.95 0.95 0.94
MSSD 161.43 1711.53 373.05 211.47 17.17 17.40 19.08
H DSC 0.89 0.73 0.85 0.89 0.90 0.92 0.94
MSSD 194.69 800.51 646.14 952.10 203.53 90.37 71.86
I DSC 0.78 0.63 0.55 0.50 0.69 0.85 0.88
MSSD 207.86 217.14 318.28 4064.26 1832.40 49.11 39.52
J DSC 0.77 0.54 0.94 0.82 0.91 0.94 0.96
MSSD 322.05 1587.29 16.55 475.11 366.10 13.29 10.87
Average value
DSC 0.87 0.67 0.85 0.79 0.90 0.93 0.94
MSSD 147.43 924.99 337.75 1873.65 269.11 28.02 25.16
The number of iterations = 400. In the first and second segmentations of the MSLCV, the numbers of iterations were 350 and 50, respectively. Text in bold indicates the best performance for a specific image. doi:10.1371/journal.pone.0103334.t003
Active
Contour
Segmentatio
n
for
HIFU
Images
of
Uterine
Fibroids
ONE
|
www.ploson
e.org
9
July
2014
|
Volume
9
|
Issue
7
|
R(x)~10|arctan 0ð :28x{6Þz24, ð20Þ where
x~k xðk max{xminkzkymax{yminkÞ, ð21Þ where k is a coefficient that controls the proportion, which is usually set as 0.25.xmaxandymaxrespectively, are the maximum values of the initial contour on thexaxis andyaxis, whilexmin andyminare the minimum values. Figure 8 demonstrates that the function R(x) effectively avoids the problem of the localizing radius being too large or too small when the segmentation target is too large or too small. We set a range of 10 to 40 for the localizing radius according to the size of the uterine fibroids in the HIFU ultrasound images and experimental results to avoid the lack of evolution of the contour that occurs when the localizing radius is too small and the boundary leakage and greatly increased calculation time that occur when the localizing radius results is too large. In the multi-scale segmentation, we set a largerkin the first segmentation to obtain a larger localized radius, faster convergence and weaker initialization sensitivity, and set a smaller
kon the second segmentation to reduce the calculation time.
4.3 Reducing initialization sensitivity
The effect of the incorporated shape constraint relies on the initial contour. To reduce initialization sensitivity, we consider using a zero narrow band that is generated around the zero level set created by the initial contour. The shape constraint is ignored within the zero narrow band. As shown in Figure 9, the green curve represents the initial contour, C0~fx[Vjw(x)~0g, the yellow curve inside the green curve is Cinside~fx[Vjw(x)~0g, and the yellow curve outside the green curve is Coutside~ fx[Vjw(x)~0g. The width of the zero narrow band is represented by 2w. Ignoring the constraint within the zero narrow band reduces the effect of the shape constraint around the initial contour and thus reduces the initialization sensitivity. In the multi-scale segmentation, for the first segmentation, we use the zero narrow band to reduce the initialization sensitivity due to the manually initialized contour, while on the second segmentation, we do not use the zero narrow band because the coarse contour has already been confirmed.
Conclusions
In this paper, an accurate and efficient multi-scale and shape constrained localized region-based active contour model, called the MSLCV model, has been proposed to perform semi-automatic segmentation of uterine fibroid in ultrasound images for HIFU therapy. By incorporating a new shape constraint into the localized region-based active contour, we have obtained a more precise segmentation result, avoiding the problems of boundary leakage and excessive contraction due to the low SNR, weak boundaries and intensity inhomogeneity of HIFU ultrasound images. Further, to overcome the shortcomings of the large computation time and the time-consuming nature of the segmentation process in the localized region-based active contour model, we have proposed a multi-scale algorithm that greatly improves the segmentation efficiency. Meanwhile, to solve the problem of the selection of localizing radius and initialization sensitivity, we have discussed and analyzed the adaptive selection of the localizing radius and the formation of a zero narrow band. Compared with other well-known methods, the MSLCV model
Figure 6. Average value Comparison comparison of DSC, MSSD and calculation time for segmentation results of GAC[13], C-V[16], LCV[19], RSF[18], LGF[38], SLCV and MSLCV by applying them on segmenting ultrasound images (A-J).
doi:10.1371/journal.pone.0103334.g006
Figure 7. Effects of different localizing radii on the segmentation results.The first row and the second row present the segmentation results with different localizing radii using the LCV model and the MSLCV model, respectively. The green curves are manual segmentation results by the specialist, the red curves are the results from the experiments, and the yellow circles represent the size of localized regions formed by the localizing radius. The localizing radii of (a) and (d), (b) and (e), and (c) and (f) are 4, 20 and 45, respectively.
provides more accurate and efficient segmentation results that are closer to the manual segmentation results obtained by a specialist. In future work, we will further improve the segmentation efficiency by GPU acceleration and study the adaptive change of the shape constraint’s effect according to the quality of the HIFU ultrasound images of uterine fibroids to acquire better segmentation results.
Acknowledgments
We would like to thank Dr. Yuanyi Zheng of The Second Affiliated Hospital of Chongqing Medical University for kindly providing us with the HIFU ultrasound images of uterine fibroids as well as manually segmenting the target regions of HIFU ultrasound images of uterine fibroids.
Author Contributions
Conceived and designed the experiments: XL ZY QZ. Performed the experiments: XL ZY QZ QY DZ. Analyzed the data: XL ZY QZ QY DZ. Contributed reagents/materials/analysis tools: XL ZY QZ JZ. Contrib-uted to the writing of the manuscript: XL QZ QY.
References
1. Kennedy JE (2005) High-intensity focused ultrasound in the treatment of solid tumours. Nat. Rev. Cancer 5(4): 321–327.
2. Orsi F, Arnone P, Chen W, Zhang L (2010) High intensity focused ultrasound ablation: A new therapeutic option for solid tumors. J Cancer Res Ther 6(4): 414–420.
3. Kim Y, Kim J H, Rhim H (2012) Volumetric MR-guided high-intensity focused ultrasound ablation with a one-layer strategy to treat large uterine fibroids: initial clinical outcomes. Radiology 263(2): 600–609.
4. Wang W, Wang Y, Wang T (2012) Safety and efficacy of US-guided high-intensity focused ultrasound for treatment of submucosal fibroids. European radiology 22(11): 2553–2558.
5. Noble J A, Boukerroui D (2006) Ultrasound image segmentation: a survey. Medical Imaging, IEEE Transactions on 25(8): 987–1010.
6. Zhang L, Wang Z B (2010) High-intensity focused ultrasound tumor ablation: review of ten years of clinical experience. Frontiers of medicine in China 4(3): 294–302.
7. Wang X, Qin J, Wang L (2013) Effect of high-intensity focused ultrasound on sexual function in the treatment of uterine fibroids: comparison to conventional myomectomy. Archives of gynecology and obstetrics 288(4): 851–858. 8. Al-Bataineh O, Jenne J, Huber P (2012) Clinical and future applications of high
intensity focused ultrasound in cancer. Cancer treatment reviews 38(5): 346–353. 9. Cheng H D, Shan J, Ju W (2010) Automated breast cancer detection and classification using ultrasound images: A survey. Pattern Recognition 43(1): 299– 317.
10. Ghose S, Oliver A, Martı´ R (2012) A survey of prostate segmentation methodologies in ultrasound, magnetic resonance and computed tomography images. Computer methods and programs in biomedicine 108(1): 262–287. 11. Li C, Huang R, Ding Z (2011) A level set method for image segmentation in the
presence of intensity inhomogeneities with application to MRI. Image Processing, IEEE Transactions on 20(7): 2007–2016.
12. Kass M, Witkin A, Terzopoulos D (1988) Snakes: Active contour models. International journal of computer vision 1(4): 321–331.
13. Caselles V, Kimmel R, Sapiro G (1997) Geodesic active contours. International journal of computer vision 22(1): 61–79.
14. Li C, Xu C, Gui C (2005) Level set evolution without re-initialization: a new variational formulation. CVPR 2005. IEEE Computer Society Conference on IEEE 1: 430–436.
15. Ronfard R (1994) Region-based strategies for active contour models. International Journal of Computer Vision 13(2): 229–251.
16. Chan T F, Vese L A (2001) Active contours without edges. Image processing, IEEE transactions on 10(2): 266–277.
17. Vese L A, Chan T F (2002) A multiphase level set framework for image segmentation using the Mumford and Shah model. International journal of computer vision 50(3): 271–293.
18. Li C, Kao C Y, Gore J C (2008) Minimization of region-scalable fitting energy for image segmentation. Image Processing, IEEE Transactions on 17(10): 1940– 1949.
19. Lankton S, Tannenbaum A (2008) Localizing region-based active contours. Image Processing, IEEE Transactions on 17(11): 2029–2039.
20. Xu C, Prince J L (1998) Snakes, shapes, and gradient vector flow. Image Processing, IEEE Transactions on 7(3): 359–369.
21. Li C, Kao C Y, Gore J C (2007) Implicit active contours driven by local binary fitting energy. CVPR’07. IEEE Conference on IEEE: 1–7.
22. Zhang K, Song H, Zhang L (2010) Active contours driven by local image fitting energy. Pattern recognition 43(4): 1199–1206.
23. Wang L, Li C, Sun Q (2009) Active contours driven by local and global intensity fitting energy with application to brain MR image segmentation. Computerized Medical Imaging and Graphics 33(7): 520–531.
24. Wu H, Appia V, Yezzi A (2013) Numerical conditioning problems and solutions for nonparametric iid. statistical active contours. Pattern Analysis and Machine Intelligence, IEEE Transactions on 35(6): 1298–1311.
25. Appia V, Yezzi A (2011) Active geodesics: Region-based active contour segmentation with a global edge-based constraint. IEEE International Conference on Computer Vision(ICCV) 1975–1980.
26. Leventon M E, Grimson W E L, Faugeras O (2000) Statistical shape influence in geodesic active contours. Computer Vision and Pattern Recognition, Proceed-ings. IEEE Conference on 1: 316–323.
27. Chen Y, Tagare H D, Thiruvenkadam S (2002) Using prior shapes in geometric active contours in a variational framework. International Journal of Computer Vision 50(3): 315–328.
28. Chen Y, Huang F, Tagare H D (2007) A coupled minimization problem for medical image segmentation with priors. International journal of computer vision 71(3): 259–272.
29. Bresson X, Vandergheynst P, Thiran J P (2006) A variational model for object segmentation using boundary information and shape prior driven by the Mumford-Shah functional. International Journal of Computer Vision 68(2): 145–162.
Figure 9. Zero narrow band.The green curve represents the initial contourC0, and the two yellow curvesCinsideandCoutsideare the edges
of the narrow band.
doi:10.1371/journal.pone.0103334.g009
Figure 8. Illustration of the adaptive localizing radius function
R(x)varies withx,xrepresents for scale of initial contour and is described in (21) detailedly.
30. Wu P, Liu Y, Li Y (2013) TRUS image segmentation with non-parametric kernel density estimation shape prior. Biomedical Signal Processing and Control 8(6): 764–771.
31. Huang Q, Bai X, Li Y (2014) Optimized graph-based segmentation for ultrasound images. Neurocomputing 129: 216–224.
32. Yu H, Li L, Xu W (2010) A multi-scale approach to mass segmentation using active contour models. SPIE Medical Imaging 762343–762343–8.
33. Kim W, Kim C (2012) Total variation flow-based multiscale framework for unsupervised surface defect segmentation. Optical Engineering 51(12): 127–201. 34. Zhou J, Jin Z (2013) A new framework for multiscale saliency detection based on
image patches. Neural processing letters 38(3): 361–374.
35. Wang W, Zhu L, Qin J (2014) Multiscale geodesic active contours for ultrasound image segmentation using speckle reducing anisotropic diffusion. Optics and Lasers in Engineering 54: 105–116.
36. Mumford D, Shah J (1989) Optimal approximations by piecewise smooth functions and associated variational problems. Communications on pure and applied mathematics 42(5): 577–685.
37. Dietenbeck T, Alessandrini M, Friboulet D, Bernard O (2010) CREASEG: a free software for the evaluation of image segmentation algorithms based on level-set. In IEEE International Conference On Image Processing. Hong Kong, China.
38. Wang L, He L, Mishra A (2009) Active contours driven by local Gaussian distribution fitting energy. Signal Processing 89(12): 2435–2447.

![Figure 6. Average value Comparison comparison of DSC, MSSD and calculation time for segmentation results of GAC [13], C-V [16], LCV [19], RSF [18], LGF [38], SLCV and MSLCV by applying them on segmenting ultrasound images (A-J).](https://thumb-eu.123doks.com/thumbv2/123dok_br/18348568.352791/11.918.94.829.104.553/average-comparison-comparison-calculation-segmentation-applying-segmenting-ultrasound.webp)