ABSTRACT
http://dx.doi.org/10.1590/1678-775720130445
Comparison between 3D volumetric rendering
and multiplanar slices on the reliability of linear
measurements on CBCT images: an
in vitro
study
Thais Maria Freire FERNANDES1, Julie ADAMCZYK2, Marcelo Lupion POLETI3, José Fernando Castanha HENRIQUES4,
Bernard FRIEDLAND5, Daniela Gamba GARIB6
1- Department of Orthodontics. University of Northern Parana (UNOPAR), Londrina, PR, Brazil. 2- Harvard School of Dental Medicine, Boston, MA, USA.
3- Department of Radiology. University of Northern Parana (UNOPAR), Londrina, PR, Brazil.
4- Department of Pediatric Dentistry, Orthodontics and Community Health, Bauru School of Dentistry, University of São Paulo, Bauru, SP, Brazil. 5- Department of Oral Medicine, Infection & Immunity. Harvard School of Dental Medicine, Boston, MA, USA.
6- Department of Pediatric Dentistry, Orthodontics and Community Health, Bauru School of Dentistry; Hospital of Rehabilitation of Craniofacial Anomalies, University of São Paulo, Bauru, SP, Brazil.
Corresponding address: Thais Maria Freire Fernandes - Universidade do Norte do Paraná (UNOPAR) - Rua João Huss, 450 Apto 104 - 86050-490 - Londrina - PR - Phone/Fax: (43) 3371-7991 - e-mail: [email protected]
Submitted: September 3, 2013 - Modiication: February 17, 2014 - Accepted: April 30, 2014
O
bjective: The purpose of this study was to determine the accuracy and reliability of two methods of measurements of linear distances (multiplanar 2D and tridimensional reconstruction 3D) obtained from cone-beam computed tomography (CBCT) with different voxel sizes. Material and Methods: Ten dry human mandibles were scanned at voxel sizesof 0.2 and 0.4 mm. Craniometric anatomical landmarks were identiied twice by two
independent operators on the multiplanar reconstructed and on volume rendering images that were generated by the software Dolphin®. Subsequently, physical measurements
were performed using a digital caliper. Analysis of variance (ANOVA), intraclass correlation
coeficient (ICC) and Bland-Altman were used for evaluating accuracy and reliability
(p<0.05). Results: Excellent intraobserver reliability and good to high precision interobserver reliability values were found for linear measurements from CBCT 3D and multiplanar images. Measurements performed on multiplanar reconstructed images were more accurate than measurements in volume rendering compared with the gold standard. No statistically
signiicant difference was found between voxel protocols, independently of the measurement
method. Conclusions: Linear measurements on multiplanar images of 0.2 and 0.4 voxel are reliable and accurate when compared with direct caliper measurements. Caution should be taken in the volume rendering measurements, because the measurements were reliable, but not accurate for all variables. An increased voxel resolution did not result in greater accuracy of mandible measurements and would potentially provide increased patient radiation exposure.
Keywords: Cone-beam computed tomography. Reliability. Mandible.
INTRODUCTION
Technological advances in three-dimensional (3D) imaging such as cone-beam computed tomography (CBCT) appear to offer signiicant advantages in both quality and quantity of data representing true anatomy7,23-25,27. The increased
use of computed tomography in dentistry has also spurred the improvement of existing software
designed primarily for dental use, as well as the development of new software9. However, it is
necessary to select protocols and to assess the reliability and accuracy of landmark identiication in 3D images20.
Figure 1- Frontal (left) and sagittal (right) views of mandible showing the points CBCT technology make its use feasible for speciic
indications, such as impacted teeth, craniofacial anomalies, airway and temporomandibular joint disorders. In these cases, CBCT images could be used for routine cephalometric purposes beyond the diagnostic purposes for which they were primarily taken. This has been extensively done for cephalometric measurements3,13, but to
a much lesser extent for maxillofacial computed tomography imaging4,17. Whether CBCT should be
used routinely in all orthodontic patients is still an open question.
A factor that could inluence the use of CBCT is the voxel size. The voxel is the smallest unit of CT images and its size has an inluence on image spatial resolution22. By decreasing the voxel size
the image spatial resolution increases as there is a decrease in partial volume averaging8,22. On the
other hand, by decreasing the voxel size, the scan time increases, as does the probability of patient movement22. Most signiicant however, increasing
resolution increases patient dose. This is especially of concern in the case of younger individuals, who constitute the overwhelming majority of orthodontic patients. This issue of increased radiation dose to children, and speciically for orthodontic purposes, has caused widespread concern and has been the source of much discussion even in the lay literature5.
In order to verify the clinical reliability of measurements on multiplanar sections and 3D reconstructions derived from CBCT, it is also necessary to evaluate the measurements using anatomic landmarks without the use of metallic markers. The most recent studies involving CBCT scans have shown reproducibility and accuracy of cephalometric measurements performed on lateral cephalograms reformatted from CBCT images17
or in 3D-CBCT images4,18. However, most of the
studies used radiopaque markers6,8 and these
might have an influence on the accuracy and reproducibility of the measurements. The presence of metallic markers eliminates errors from landmark identiication because metallic landmarks can be
easily identiied and located with a high degree of accuracy and precision. The absence of metallic markers simulates the real clinical situation.
For these reasons, the aim of this study was to verify the inluence of voxel size on the accuracy and reproducibility of linear measurements of the mandible performed without metallic markers on 3D CBCT images, comparing multiplanar sections and 3D rendering images.
MATERIAL AND METHODS
Approval for this study was received from the Ethics Committee at the University of São Paulo, Bauru, Brazil. Ten dry adult human mandibles, selected from the collection of dry skulls of the Department of Anatomy from the Bauru School of Dentistry were scanned. To it the inclusion criteria, the mandibles had to be well preserved with no large metallic restorations on the teeth, in order to avoid scattering and artifacts. The sample size of each group was calculated based on an alpha signiicance level of 0.05 and beta of 0.2 to achieve 80% of power8.
To provide soft-tissue equivalent attenuation, each dry mandible was placed in a dental wax box illed with water. The mandibles were positioned with the mandibular plane parallel and the midsagittal plane perpendicular to the loor, in accordance with the manufacturer’s instructions for performing the scans in the clinical setting. The CBCT images were acquired using the i-CAT Classic 3D Dental Imaging System (i-CAT Classic, Imaging Sciences International, Hatield, PA, USA). Each mandible was scanned twice: once with a 0.20 voxel resolution (36.12 mAs, 40 sec, FOV of 8 cm, 120 Kv) and once with a 0.40 voxel resolution (18.45 mAs, 20 sec, FOV of 8 cm, 120 Kv).
CBCT data were exported in DICOM (Digital Imaging and Communication in Medicine) multi-ile format and imported into Dolphin® 11.5 software
Name (Abbreviation) Deinition (Point) CBCT Reference in the multiplanar view
Coronoid (CR) Located at the upper limit of the
coronoid process on the right side
Move green line upward and downward in the axial slice and/or green line to the
right and left in the sagittal slice to ind
the point located at the upper limit of the coronoid process
Coronoid (CL) Located at the upper limit of the
coronoid process on the left side
Similar to CR, but on the left side
Mental Foramen (MfR) Located at the most lower and
posterior limit of the mental foramen on the right side
Move green line upward and downward in the axial slice and/or green line to the
right and left in the sagittal slice to ind
the most lower and posterior limit of the mental foramen
Mental Foramen (MfL) Located at the most lower and
posterior limit of the mental foramen on the left side
Similar to MfR, but on the left side
Lateral mandibular condyle (LCoR) Located at the most lateral limit of
the right mandibular condyle viewed coronally
Move blue line upward and downward in the coronal or sagittal slice until the limit
of condyle appears
Lateral mandibular condyle (LCoL) Located at the most lateral limit of
the left mandibular condyle viewed coronally
Similar to LCoR, but on the left side
Medial mandibular condyle (MCoR) Located in the most medial limit of
the right mandibular condyle viewed coronally
Move blue line upward and downward in the coronal or sagittal slice until the limit
of condyle appears
Medial mandibular condyle (MCoL) Located in the most medial limit of
the left mandibular condyle viewed coronally
Similar to MCoR, but on the left side
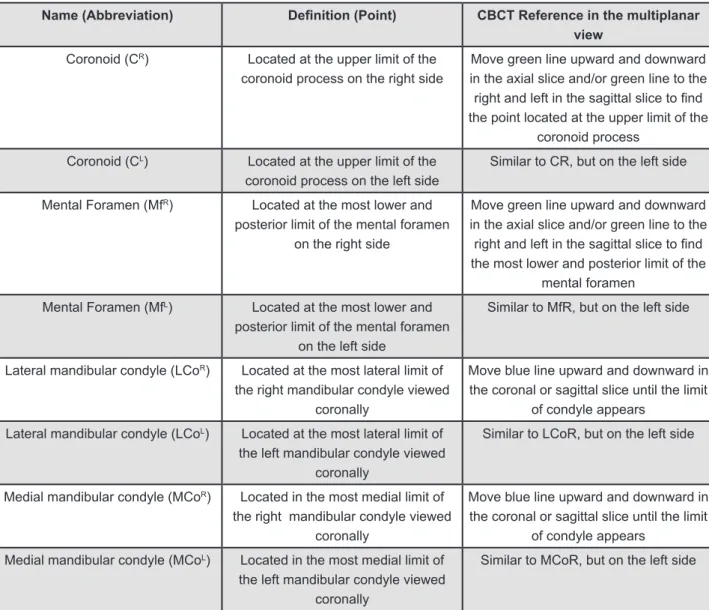
Figure 2- Points. Reference in the anatomical view and in the cone-beam computed tomography (CBCT) images
Measurement Deinition
1 CR – CL Inter-coronoid width. Linear distance between coronoid points
2 MfR – MfL Inter-mental foramen width. Linear distance between mental foramen points
3 CR – MfR Linear distance between right coronoid point and right mental foramen
4 CR – MfL Linear distance between right coronoid point and left mental foramen
5 CL – MfL Linear distance between left coronoid point and left mental foramen
6 CL – MfR Linear distance between left coronoid point and right mental foramen
7 MCo – Lco (right) Condylar width. Linear distance between medial mandibular condyle and lateral mandibular condyle in the right size
8 MCo – Lco (left) Condylar width. Linear distance between medial mandibular condyle and lateral mandibular condyle in the left size
9 LCoR – LCoL Maximum lateral intercondylar distance. Linear distance between lateral
mandibular condyles
10 MCoR – MCoL Maximum medial intercondylar distance. Linear distance between medial
mandibular condyles
computer A505-S6975 (Satellite, Toshiba, Tokyo, Japan) with a dedicated 512-MB video card on a 17-in CrystalBrite LCD lat-panel color screen with a maximum resolution of 1440x900 pixels was used.
Image measurements
Measurements were made separately on the multiplanar sections (2D) and on 3D rendering images display window of Dolphin 3D. The multiplanar window displays the sagittal, coronal and axial slices, as well as the 3D rendered image. It was possible to visualize the 3 projections and the 3D rendered image together or choose one of the four images in full screen.
Linear measurements of 3D coordinates were obtained using several craniometric anatomic landmarks (Figure 1). For multiplanar groups, each landmark (Figure 2) was identiied and marked on the three orthogonal slices simultaneously (axial, sagittal and coronal). The corresponding linear measurements (Figure 3) were determined electronically with the “Measurement” tool on the sectional images. For performing the linear measurements which landmarks were not located in the same sectional image, as CL – MfL, the irst
mark of a line was performed in the sectional image showing the irst landmark and the second mark was performed on a different section showing the second landmark. As the volume rendering was reoriented, the positions of the landmarks were veriied in the axial, sagittal and coronal slices and, if necessary, relocated.
For 3D rendering images, the landmarks were identified directly on the surface for 3D images. Corresponding linear measurements were determined with a line between the landmarks. The measurements were performed twice by 2 blinded independent examiners (TMFF and JA). The time interval between the two measurements was 15 days.
The physical measurements of the dry mandibles were obtained with a high-precision digital caliper (Mitutoyo, Mitutoyo Sul Americana, Suzano, SP, Brazil), identical to those used in similar studies23.
In this initial study, we selected landmarks that are relatively easy to identify. Points were identiied and measured with the digital caliper. Linear measurements were identiied on two occasions, one month apart, by one operator (MLP). The mean of the two measurements of each distance was calculated and used as the gold standard to evaluate the accuracy of the CBCT 3D images. The measurements were grouped into ive groups: physical measurements (G1); measurements performed on multiplanar slices with 0.20 mm voxel size (G2); measurements performed on multiplanar slices with 0.40 mm voxel size (G3); measurements performed on 3D images with voxel size of 0.20 mm
(G4) and measurements performed on 3D images with voxel size of 0.40 mm (G5).
Statistical analyses
Intraclass correlation and Bland-Altman test was used to evaluate the intra- and interobserver reliability. Analysis of variance for repeated measures (ANOVA)and Dunnett’s testwere used to compare the groups on CBCT images and the physical measurements. Results were considered signiicant at p<0.05. All tests were performed with Statistica software 6.0 (Statistica for Windows; Statsoft, Tulsa, Ok, USA) and SPSS version 10 (SPSS, SPSS Inc., Chicago, IL, USA).
RESULTS
Intra- and interobserver reproducibility are shown in Table 1. The measurements for investigator 1 showed excellent reliability with intraclass correlation coeficients (ICC) ranging from 0.93 to 1 (ICC average G2:0.97; G3:0.97; G4:0.98 and G5:0.98). Additionally, the mean absolute differences between the irst and second measurements were less than 0.40 mm (mean average difference G2:0.11 mm and G3:0.02 mm) for multiplanar images and less than 0.64 mm (mean average difference G4:0.14 mm and G5:0.03 mm) for 3D model images. For Investigator 2, the results also showed excellent reliability, with ICC coeficients ranging from 0.88 to 0.99 (ICC average - G2:0.96; G3:0.95; G4:0.97 and G5:0.97).
CBCT multiplanar reconstruction measurements showed good to high interobserver reliability with ICC ranging from 0.63 to 0.99 (mean average G2=0.86 and G3=0.87) with the absolute differences between the first and second measurements ranging for 0 to 2.12 mm (mean average difference G2:-0.34 mm and G3:-0.49 mm, Table 1). For 3D reconstruction measurements, independently of the voxel size (G4 or G5), most of the variables presented good to high interobserver reliability, with the exception of inter-mental foramen width (MfR – MfL) that had fair reliability on 0.2 mm voxel
images (G4=0.26) and moderate reliability for 0.4 voxel size (G5=0.45).
The mean values and standard deviations of the physical measurements and of the CBCT measurements for all groups are presented in Table 2. Two variables (MfR – MfL and CR – MfL) at
Multiplanar images 3D model images
Variable G2 G3 G4 G5
0.2 voxel (n=10) 0.4 voxel (n=10) 0.2 voxel (n=10) 0.4 voxel (n=10) Intraobserver
Obser ver
AD SD 95%
CI
ICC AD SD 95%
CI
ICC AD SD 95%
CI
ICC AD SD 95%
CI ICC
CR – CL 1 0.01 0.36 -0.69;
0.71
1 -0.01 0.15 -0.31; 0.29
1 0.12 0.67 -1.20; 1.44
0.99 0.18 0.77 -1.34; 1.70
0.98
2 -0.41 0.75 -1.89; 1.07
0.98 -0.68 0.75 -2.16; 0.80
0.97 0.17 0.87 -1.54; 1.88
0.98 0.46 0.73 -0.98; 1.90
0.98
MfR – MfL 1 -0.13 0.46 -1.03;
0.77
0.99 -0.19 0.49 -1.14; 0.76
0.98 0.17 0.72 -1.25; 1.59
0.96 -0.21 0.49 -1.17; 0.75
0.98
2 -0.30 1.18 -2.16; 2.01
0.93 -0.08 0.68 -1.41; 1.25
0.97 -0.21 0.82 -1.82; 1.40
0.96 -0.03 1.33 -2.63; 2.57
0.92
CR – MfR 1 -0.04 1.09 -2.18;
2.10
0.97 0.31 0.67 -0.99; 1.61
0.98 0.64 0.78 -0.90; 2.18
0.98 0.26 0.81 -1.32; 1.84
0.98
2 -0.58 1.21 -2.95; 1.79
0.95 -0.92 0.97 -2.81; 0.97
0.96 0.48 0.92 -1.33; 2.29
0.97 0.42 0.75 -1.04; 1.88
0.98
CR – MfL 1 0.19 0.84 -1.46;
1.84
0.99 0.24 0.90 -1.53; 2.01
0.97 0.39 0.67 -0.93; 1.71
0.98 0.10 0.70 -1.28; 1.48
0.99
2 -0.66 0.81 -2.24; 0.92
0.97 -0.81 1.27 -3.30; 1.68
0.94 0.10 0.73 -1.34; 1.54
0.99 0.63 0.85 -1.03; 2.29
0.97
CL – MfL 1 0.40 1.22 -2.0;
2.80
0.95 0.05 1.40 -2.68; 2.78
0.93 0.04 1.00 -1.93; 2.01
0.96 0.26 1.06 -1.83; 2.35
0.95
2 -1.05 0.90 -2.82; 0.72
0.91 -0.29 1.01 -2.27; 1.69
0.95 -0.09 0.61 -1.28; 1.10
0.99 0.41 0.68 -0.92; 1.74
0.97
CL – MfR 1 0.12 1.40 -2.62;
2.86
0.94 -0.04 1.13 -2.27; 2.19
0.95 0.09 0.90 -1.67; 1.85
0.97 0.09 0.73 -1.35; 1.53
0.98
2 -0.65 0.88 -2.36; 1.06
0.96 -0.69 0.72 -2.10; 0.72
0.96 -0.02 0.99 -1.96; 1.92
0.97 0.06 1.01 -1.93; 2.05
0.97
MCo – LCo (right) 1 -0.03 0.39 -0.80; 0.74
0.98 -0.07 0.40 -0.84; 0.70
0.98 0.14 0.28 -0.42; 0.70
0.99 -0.03 0.45 -0.91; 0.85
0.98
2 0.26 0.47 -0.66; 1.18
0.97 0.18 0.71 -1.22; 1.58
0.95 0.77 0.54 -0.29; 1.83
0.90 0.68 0.55 -0.40; 1.76
0.92
MCo – LCo (left) 1 0.39 0.44 -0.47; 1.25
0.94 -0.38 0.53 -1.42; 0.66
0.93 0.01 0.35 -0.67; 0.69
0.98 -0.05 0.53 -1.10; 1.00
0.95
2 -0.05 0.53 -1.08; 0.99
0.95 0.30 0.81 -1.29; 1.89
0.88 -0.08 0.43 -0.93; 0.77
0.98 0.14 0.33 -0.50; 0.78
0.98
LCoR – LCoL 1 0.30 0.38 -0.34;
0.94
0.99 -0.22 0.50 -1.22; 0.78
0.99 -0.03 0.31 -0.65; 0.59
1 -0.15 0.70 -1.52; 1.22
0.99
2 -0.30 0.70 -1.09; 1.69
0.98 0.15 0.67 -1.15; 1.45
0.99 0.77 0.53 -0.28; 1.82
0.97 0.78 0.53 -0.27; 1.83
0.97
MCoR – MCoL 1 -0.07 0.35 -0.76;
0.62
0.99 0.08 0.54 -0.98; 1.14
0.98 -0.22 0.35 -0.91; 0.47
0.99 -0.12 0.50 -1.11; 0.87
0.99
2 -0.33 0.51 -1.34; 0.68
0.98 -0.62 0.35 -1.31; 0.07
0.97 -0.08 0.35 -0.78; 0.62
0.99 -0.05 1.29 -0.62; 0.52
0.99
Total 1 0.11 0.97 0.02 0.97 0.14 0.98 0.03 0.98
2 -0.41 0.96 -0.35 0.95 0.18 0.97 0.35 0.97
Interobserver CR – CL 1 x 2 -0.54 0.98 -2.46;
1.38
0.96 0.00 0.49 -0.95; 0.96
0.99 -0.11 0.88 -1.84; 1.63
0.98 -0.15 0.56 -1.25; 0.95
0.99
MfR – MfL 1 x 2 1.00 0.61 -0.20;
2.19
0.91 0.94 0.54 -0.12; 1.99
0.92 3.59 1.49 0.66; 6.51
0.26 3.25 1.45 0.38; 6.09
0.45
CR – MfR 1 x 2 -1.20 1.18 -3.51;
1.15
0.93 -1.49 1.09 -3.63; 0.64
0.90 -2.42 0.80 -3.99; -0.84
0.84 -2.56 0.66 -3.86; -1.26
0.82
CR – MfL 1 x 2 0.63 1.05 -1.45;
2.70
0.97 0.06 0.80 -1.51; 1.64
0.98 0.07 1.20 -2.30; 2.43
0.96 -0.34 0.57 -1.46; 0.79
0.99
CL – MfL 1 x 2 -1.09 1.34 -3.72;
1.53
0.89 -1.07 0.94 -2.91; 0.79
0.92 -2.42 1.38 -5.13; 0.30
0.70 -2.47 1.06 -4.56; -0.37
0.69
CL – MfR 1 x 2 0.40 0.60 -0.78;
1.59
0.98 -0.79 0.81 -0.79; 2.38
0.95 0.07 0.68 -1.28; 1.41
0.98 0.10 0.58 -1.05; 1.24
0.99
MCo – LCo (right) 1 x 2 -1.77 0.54 -2.83; -0.71
0.69 -1.84 0.50 -2.83; -0.86
0.67 -0.18 0.84 -1.83; 1.46
0.92 -0.49 0.46 -1.40; 0.41
0.95
MCo – LCo (left) 1 x 2 -1.43 0.54 -2.49; -0.36
0.63 -1.39 0.63 -2.63; -0.14
0.63 -1.13 0.84 -2.79; 0.52
0.72 -0.73 0.56 -1.85; 0.38
0.86
LCoR – LCoL 1 x 2 -1.42 0.55 -2.50;
-0.34
0.92 -1.45 0.45 -2.34; -0.55
0.93 -0.09 1.16 -2.35; 2.19
0.96 -0.15 0.93 -1.96; 1.67
0.97
MCoR – MCoL 1 x 2 1.99 0.46 1.08;
2.89
0.76 2.12 0.43 1.27; 2.96
0.76 1.34 0.61 0.14; 2.53
0.86 1.17 0.48 0.21; 2.13
0.90
Total -0.34 0.86 -0.49 0.87 -0.13 0.82 -0.24 0.86
Table 1- Intraobserver and interobserver variation for each group and analysis methods [intraclass correlation coeficient (ICC) and Bland-Altman]
Physical measurement
Multiplanar images 3D model images
Variable G1 G2 G3 G4 G5 P
0.2 voxel 0.4 voxel 0.2 voxel 0.4 voxel
(n=10) (n=10) (n=10) (n=10) (n=10)
Mean SD Mean SD MD Mean SD MD Mean SD MD Mean SD MD
CR – CL 101.03 3.98 101.15 4.15 0.11 100.97 4.01 -0,06 101.12 4.06 0,09 101.18 4.26 0.14 0.697
MfR – MfL 49.17A 3.03 47.91B 2.98 -1.26 47.91B 2.81 -1,26 47.16B 2.64 -2,01 47.76B 3.01 -1.42 0.000*
CR – MfR 76.43A 4.71 76.50A 4.42 0.07 76.24A 4.17 -0,18 75.59B 4.60 -0,84 75.51B 4.49 -0.92 0.000*
CR – MfL 104.41A 4.63 103.82B 4.79 -0.58 103.56B 4.26 -0,85 102.76B 4.38 -1,64 103.10B 4.47 -1.31 0.000*
CL – MfL 75.16A 3.99 75.66A 3.64 0.50 75.69A 3.58 0,53 74.48B 3.46 -0,68 74.25B 3.30 -0.91 0.000*
CL – MfR 102.65A 3.92 102.44A 4.02 -0.21 102.33A 3.76 -0,32 101.29B 3.90 -1,36 101.38B 3.81 -1.27 0.000*
MCo – LCoR 21.42A 2.43 21.68A 2.28 0.26 21.69A 2.28 0,26 19.61B 2.08 -1,81 20.07B 2.19 -1.35 0.000*
MCo – LCoL 21.37A 2.05 21.28A 1.67 -0.09 21.02A 1.68 -0,34 19.31B 1.82 -2,06 19.14B 1.74 -2.23 0.000*
LCoR – LCoL 124.25A 4.05 124.00A 4.03 -0.25 123.78A 4.10 -0,47 122.73B 4.21 -1,53 122.74B 4.04 -1.51 0.000*
MCoR – MCoL 83.87 3.09 84.07 2.86 0.20 84.13 2.97 0,26 84.07 2.81 0,2 83.76 2.98 -0.11 0.251
SD, Standard Deviation; MD, Mean difference
* Statistically signiicant
Different letters represent statistically signiicant differences (Dunnett’s test)
Table 2- Mean (mm) and Standard Deviation (SD) of linear measurements for dry mandibles compared to cone-beam computed tomography (CBCT) images with different voxel sizes [analysis of variance (ANOVA) for repeated measures and Dunnett’s tests]
DISCUSSION
CBCT maxillofacial imaging provides clinicians with an opportunity to generate 3D volumetric renderings. The availability of this technology is undoubtedly expanding the use and application of 3D imaging in the ield of orthodontics6. However,
while CBCT provides many advantages, patient radiation dose is still higher than conventional cephalometric and panoramic digital imaging modalities6,29. This study was performed to evaluate
the reliability and accuracy of linear measurements between common landmarks of the mandible taken from CBCT multiplanar sections and 3D volumetric renderings with different voxel sizes. It is not well deined if 3D model images presented accuracy. In addition, larger voxel sizes are consistent with the ALARA principle, keeping the dose as low as reasonably achievable for the intended purpose of the scan28.
Most of the previous studies4,12,15,18 performed
to validate CBCT for 3D cephalometrics measured linear distances between anatomical landmarks in dry skulls in combination with radiopaque markers. Cephalometric analyses are subject to the inluence of the examiner, landmark identiication and type of image analyzed (2D sections or 3D image). The major question of this study was if the dificulty in identifying the landmarks in 3D images can inluence the reliability and accuracy of the measurements, and for this reason, metallic markers were not used. This method is close to
the real clinical procedures and is more clinically relevant than making measurements between well-deined metallic landmarks.
There was excellent intraobserver reliability for both examiners with the mean ICC for all groups above 0.95 and mean average differences less than 0.41 mm, independently of the protocol analyzed (Table 1). Our results are in accord with similar studies that used metallic markers2,4,8,30. These differences
are not clinically signiicant for orthodontic/surgical diagnosis and treatment planning, and acceptable for skeletal measurements7,16.
Additionally, good to high interobserver precision was identiied for all groups, with exception of measurement MfR – MfL for 3D groups (Table 1). The
main explanations for the good reliability found in this study are the use of landmarks which are easily identiiable, the calibration between observers and the high spatial deinition of CBCT images. The differences between multiplanar sections and 3D volume rendering images were probably because landmarks on multiplanar images were identiied on the orthogonal slices simultaneously instead of being identiied directly on the surface of 3D reformatted images.
Our study also evaluated the accuracy of measurements performed in CBCT images (Table 2). Two variables at G2 and G3 and 8 variables at G4 and G5 were significantly smaller than physical measurements (G1). These indings were similar to those found by Lascala, et al.18 (2004)
tendency for the CBCT measurements to slightly underestimate the gold standard. The consistency of the differences we found suggests a systematic error in the 3D model measurement method. One possible explanation is that this error might have been introduced by the measurement software, mainly building line. Although few software systems currently have a 3D cephalometric module, most of them have not been tested or validated11. The
results of the validation measurements for a speciic machine or software can not be extrapolated to the entire CBCT machine and software11. Most of them
are designed differently and software updates are constant and frequent. In addition, the difference ranged from 0.06 to 2.23 mm. In agreement with previous reports, the average difference in our study is below clinical signiicance. According to Grauer, et al.10 (2009), generating measurements
in 3D volumetric images rather than simultaneously in sets of 2D multiplanar images introduces error because of the difficulty involved in locating landmarks in 3D space and the inaccuracies of the user entered threshold used for the construction of 3D virtual surface models. Rendered 3D objects may be adequate for qualitative assessment (i.e., superimposition). However, accurate quantitative assessment should still be performed on the multiplanar sections11. For this reason, greater
caution is suggested for linear measurements performed on 3D models11.
The spatial resolution of the image has an inluence in the accuracy of the measurements27.
Most studies on CBCT with a large ield of view used 0.4 mm voxel size4,12,21, whereas others with
a small ield of view used a 0.2 mm or smaller voxel sizes15,26. None of the measurements showed
signiicant difference between the voxel sizes, independently of the method of measurement (Table 2). These results are in accord with those of Ballrick, et al.1 (2008) and Damstra, et al.8 (2010),
who have suggested that 0.4 mm voxel resolution is adequate for performing measurements of craniofacial structures. While small voxel sizes increase the image resolution, they also may increase the image noise22. The beneits of a shorter
scanning time, with its reduced likelihood of patient movement and especially the lower exposure dose compensates for the poorer resolution. Besides, large measurements are less inluenced by small differences in spatial resolution22. On the other
hand, the diagnostic ability of CBCT images for evaluating small structures appears to be inluenced by voxel size. The two most common voxel sizes used in orthodontics – 0.3 and 0.4 mm – provide lower spatial resolution than smaller voxel sizes. Orthodontic scans with resolutions of 0.3 and 0.4 voxels are ideal for general treatment planning but should be used with caution if the goal is to assess
small variations in bone thickness22. Liedkte, et
al.19 (2009) investigated the usefulness of CBCT
for identifying artiicial external root resorption in images with voxel sizes of 0.4, 0.3, and 0.2 mm. They concluded that, even though the results were the same for the different voxel sizes, diagnosis was easier at smaller voxel sizes of 0.3 and 0.2 mm. Although the beneits of a shorter scanning time satisfy the ‘‘as low as reasonably achievable’’ principle, the risks of misdiagnosis and treatment complications must also be weighed. Consequently, a scanning protocol with a 0.40 mm voxel size might not be suitable for every patient. Voxel size may vary according to the size of the structures to be analyzed as well as to the level of detail desired. In this study, we measured distances that are in excess of the resolutions 0.2 and 0.4 mm of the scan, so that voxel size would not very likely inluence the measurements.
Three-dimensional cephalometric analysis is much more time-consuming. Unlike in conventional cephalometrics, where all the landmarks are identified in one image, namely, the lateral cephalogram, with CBCT each landmark must be identiied in three different images (axial, coronal and sagittal), making the process of performing the measurements in CBCT images more time-consuming for the orthodontist. Further, CBCT demands a higher radiation dose than traditional cephalometric images. For these reasons, its use should be limited to speciic indications, for example, patients with impacted teeth, or those with facial asymmetries or craniofacial anomalies where CBCT is better able to quantify the differences between the right and the left side of craniofacial structures. Evidence-based will tell whether future advances, especially in terms of dose reduction, will make CBCT appropriate for routine use in all orthodontic patients.
CONCLUSIONS
Linear measurements obtained on multiplanar 2D CBCT images with 0.2 and 0.4 voxel sizes using i-Cat scanner and Dolphin® software are reliable
and accurate for clinical diagnosis and treatment planning.
Caution should be taken in linear measurements on 3D rendering images, because the measurements were reliable, but not accurate.
REFERENCES
1- Ballrick JW, Palomo JM, Ruch E, Amberman BD, Hans MG. Image distortion and spatial resolution of a commercially available cone-beam computed tomography machine. Am J Orthod Dentofacial Orthop. 2008;134(4):573-82.
2- Baumgaertel S, Palomo JM, Palomo L, Hans MG. Reliability and accuracy of cone-beam computed tomography dental measurements. Am J Orthod Dentofacial Orthop. 2009;136(1):19-25.
3- Baumrind S, Frantz RC. The reliability of head ilm measurements. 1. Landmark identiication. Am J Orthod. 1971;60(2):111-27. 4- Berco M, Rigali PH Jr, Miner RM, DeLuca S, Anderson NK, Will LA. Accuracy and reliability of linear cephalometric measurements from cone-beam computed tomography scans of a dry human skull. Am J Orthod Dentofacial Orthop. 2009;136(1):17e1-9. 5- Bogdanich W, McGinty JC. Radiation worries for children in dentists’ chairs [online]. The New York Times. 2010 Nov. 22 [cited 2013 Sep. 3]. Available from: http://www.nytimes. com/2010/11/23/us/23scan.html?pagewanted=all&_r=0. 6- Brown AA, Scarfe WC, Scheetz JP, Silveira AM, Farman AG. Linear accuracy of cone beam CT derived 3D images. Angle Orthod. 2009;79(1):150-7.
7- Cavalcanti MG, Haller JW, Vannier MW. Three-dimensional computed tomography landmark measurement in craniofacial surgical planning: experimental validation in vitro. J Oral Maxillofac Surg. 1999;57(6):690-4.
8- Damstra J, Fourie Z, Huddleston Slater JJ, Ren Y. Accuracy of linear measurements from cone-beam computed tomography-derived surface models of different voxel sizes. Am J Orthod Dentofacial Orthop. 2010;137(1):16 e1-6.
9- Friedland B, Donoff B, Dodson TB. The use of 3-dimensional reconstructions to evaluate the anatomic relationship of the mandibular canal and impacted mandibular third molars. J Oral Maxillofac Surg. 2008;66(8):1678-85.
10- Grauer D, Cevidanes LS, Proffit WR. Working with DICOM craniofacial images. Am J Orthod Dentofacial Orthop. 2009;136(3):460-70.
11- Gribel BF, Gribel MN, Frazão DC, McNamara JA Jr, Manzi FR. Accuracy and reliability of craniometric measurements on lateral cephalometry and 3D measurements on CBCT scans. Angle Orthod. 2011;81(1):26-35.
12- Hilgers ML, Scarfe WC, Scheetz JP, Farman AG. Accuracy of linear temporomandibular joint measurements with cone beam computed tomography and digital cephalometric radiography. Am J Orthod Dentofacial Orthop. 2005;128(6):803-11.
13- Houston WJ. The analysis of errors in orthodontic measurements. Am J Orthod. 1983;83(5):382-90.
14- Kau CH, Richmond S, Palomo JM, Hans MG. Three-dimensional cone beam computerized tomography in orthodontics. J Orthod. 2005;32(4):282-93.
15- Kobayashi K, Shimoda S, Nakagawa Y, Yamamoto A. Accuracy in measurement of distance using limited cone-beam computerized tomography. Int J Oral Maxillofac Implants. 2004;19(2):228-31. 16- Kragskov J, Bosch C, Gyldensted C, Sindet-Pedersen S. Comparison of the reliability of craniofacial anatomic landmarks based on cephalometric radiographs and three-dimensional CT scans. Cleft Palate Craniofac J. 1997;34(2):111-6.
17- Lamichane M, Anderson NK, Rigali PH, Seldin EB, Will LA. Accuracy of reconstructed images from cone-beam computed tomography scans. Am J Orthod Dentofacial Orthop. 2009;136(2):156-7.
18- Lascala CA, Panella J, Marques MM. Analysis of the accuracy of linear measurements obtained by cone beam computed tomography (CBCT-NewTom). Dentomaxillofac Radiol. 2004;33(5):291-4.
19- Liedke GS, Silveira HE, Silveira HL, Dutra V, Figueiredo JA. Inluence of voxel size in the diagnostic ability of cone beam tomography to evaluate simulated external root resorption. J Endod. 2009;35(2):233-5.
20- Lou L, Lagravere MO, Compton S, Major PW, Flores-Mir C. Accuracy of measurements and reliability of landmark identiication with computed tomography (CT) techniques in the maxillofacial area: a systematic review. Oral Surg Oral Med Oral Pathol Oral Radiol Endod. 2007;104(3):402-11.
21- Ludlow JB, Laster WS, See M, Bailey LJ, Hershey HG. Accuracy of measurements of mandibular anatomy in cone beam computed tomography images. Oral Surg Oral Med Oral Pathol Oral Radiol Endod. 2007;103(4):534-42.
22- Molen AD. Considerations in the use of cone-beam computed tomography for buccal bone measurements. Am J Orthod Dentofacial Orthop. 2010;137:S130-5.
23- Moreira CR, Sales MA, Lopes PM, Cavalcanti MG. Assessment of linear and angular measurements on three-dimensional cone-beam computed tomographic images. Oral Surg Oral Med Oral Pathol Oral Radiol Endod. 2009;108(3):430-6.
24- Navarro RL, Oltramari-Navarro PV, Fernandes TM, Oliveira GF, Conti AC, Almeida MR, et al. Comparison of manual, digital and lateral CBCT cephalometric analyses. J Appl Oral Sci. 2013;21(2):167-76.
25- Oliveira-Santos C, Capelozza AL, Dezzoti MS, Fischer CM, Poleti ML, Rubira-Bullen IR. Visibility of the mandibular canal on CBCT cross-sectional images. J Appl Oral Sci. 2011;19(3):240-3. 26- Pinsky HM, Dyda S, Pinsky RW, Misch KA, Sarment DP. Accuracy of three-dimensional measurements using cone-beam CT. Dentomaxillofac Radiol. 2006;35(6):410-6.
27- Scarfe WC, Farman AG, Sukovic P. Clinical applications of cone-beam computed tomography in dental practice. J Can Dent Assoc. 2006;72(1):75-80.
28- SEDENTEXCT Project. Radiation protection: Cone beam CT for dental and maxillofacial radiology. Evidence based guidelines [online]. 2011 [cited September 3, 2013]. Available from: http:// www.eadmfr.info/sites/default/iles/guidelines_inal.pdf.
29- Silva MA, Wolf U, Heinicke F, Bumann A, Visser H, Hirsch E. Cone-beam computed tomography for routine orthodontic treatment planning: a radiation dose evaluation. Am J Orthod Dentofacial Orthop. 2008;133(5):640.e1-5.

![Table 1- Intraobserver and interobserver variation for each group and analysis methods [intraclass correlation coeficient (ICC) and Bland-Altman]](https://thumb-eu.123doks.com/thumbv2/123dok_br/14983861.511419/5.892.85.808.168.1130/intraobserver-interobserver-variation-analysis-methods-intraclass-correlation-coeficient.webp)
![Table 2- Mean (mm) and Standard Deviation (SD) of linear measurements for dry mandibles compared to cone-beam computed tomography (CBCT) images with different voxel sizes [analysis of variance (ANOVA) for repeated measures and Dunnett’s tests]](https://thumb-eu.123doks.com/thumbv2/123dok_br/14983861.511419/6.892.86.808.186.511/standard-deviation-measurements-mandibles-compared-computed-tomography-different.webp)
