Article
J. Braz. Chem. Soc., Vol. 24, No. 7, 1085-1098, 2013. Printed in Brazil - ©2013 Sociedade Brasileira de Química 0103 - 5053 $6.00+0.00
A
*e-mail: [email protected]
Comprehensive Two-Dimensional GC with TOF-MS Detection:
Study of Pyrolytic Bio-Oil of Kraft Mill Residues
Candice S. Faccini,a Isadora Dalla Vecchia,b Desyrre Ribeiro,a
Claudia A. Zinia and Elina B. Caramão*,a
aPós-Graduação em Química and bPós-Graduação em Ciências dos Materiais,
Laboratório de Química Analítica Ambiental e Oleoquímica (LAAO), Instituto de Química, Universidade Federal do Rio Grande do Sul, 91501-970 Porto Alegre-RS, Brazil
O Brasil é um grande fabricante de celulose de eucalipto e experimentou progressos importantes na gestão ambiental nesta área nas últimas décadas. Entretanto, ainda há oportunidades para usos alternativos dos resíduos dessas fábricas, que podem resultar em produtos de maior valor agregado. As caracterizações qualitativa e semi-quantitativa da composição do bio-óleo de pirólise de três resíduos da indústria celulose (serragem de eucalipto, resíduo do digestor e lodo) foram realizadas utilizando-se cromatografia gasosa bidimensional abrangente com detector por espectrometria de massas por tempo de voo (GC×GC/TOF-MS). As melhores condições de pirólise para o resíduo do digestor foram aplicadas aos demais resíduos, obtendo-se bio-óleos complexos, sendo os bio-óleos do resíduo do digestor e da serragem qualitativamente semelhantes e o do lodo, um pirolisado de maior complexidade. As vantagens da técnica GC×GC/TOF-MS para esta aplicação específica são apresentadas, bem como o potencial dos componentes dos bio-óleos (fenóis e cetonas) para aplicações industriais importantes.
Brazil is a great manufacturer of Eucalyptus pulp and has experienced important improvements in the environmental management in the last decades. However, there are still opportunities for alternative uses of pulp mill residues, which may result in higher added value products. Qualitative and semi-quantitative characterizations of bio-oil composition of three pulp mill residues (Eucalyptus sawdust, digester residue and wastewater treatment sludge) were performed using comprehensive two-dimensional gas chromatography with time-of-flight mass spectrometric detection (GC×GC/TOF-MS). The best pyrolysis conditions achieved for the digester residue were applied to the other residues and similar bio-oils were obtained for sawdust and digester residue, while sludge rendered a more complex pyrolysate. The advantages of GC×GC/TOF-MS for this specific application are presented, as well as the potential of bio-oil components for important industrial applications.
Keywords: comprehensive two-dimensional gas chromatography, bio-oil, pyrolysis, pulp and
paper residues, time-of-flight
Introduction
Non appropriate destination of industrial wastes is a global concern due to the environmental harm it may cause. Alternatives such as re-use of residues or their use as a lower value raw material for other productive processes are welcome solutions for this environmental problem as the use of landfills is still a common choice among industries. Closing the cycle of an industrial production with the re-use of residues may produce a lower quality product and/or may cause more frequent maintenance of industrial
equipment because of buildup of impurities.1 Whenever
such as sawdust, wastewater treatment sludge and residue of the digester.2
One interesting alternative for the industrial and agricultural wastes is the pyrolysis process, which can be defined as a thermal decomposition of organic material in the partial or total absence of an oxidizing agent, yielding solid, condensable vapors (bio-oil) and gas products. Pyrolysis has been performed for thousands of years for the production of charcoal, but in recent decades, fast pyrolysis has received a further impetus due to the higher bio-oil yield it may provide. A proper adjustment of heating rate, final reactor temperature, gas flow, residence time of particles in the reactor, operating pressure, among others is essential to achieve high bio-oil yield.3
Pyrolytic processes of lignocellulosic materials are usually performed between 500 and 520 °C in order to achieve higher yields of liquid product.4 Studies are
usually focused on the pyrolysis of wood, although there are a few reports on the pyrolysis of sawdust and sludge of the P&P industry, but nothing related to the residue of the digester.5,6 The employment of various types of
biomass is consistent with the implantation of the so called bio-refineries, which are considered as a complex integrated production of energy and chemical products of high demand and value, all obtained at competitive costs.1,2,7,8 Besides that, whenever there is a shortage of
agricultural land, the use of less noble lignocellulose raw material is environmentally very convenient as it does not require the use of land.9
Bio-oil may be used as fuel or as a source of fine chemicals. In the latter case, some applications may be mentioned for bio-oils derived from lignocellulose materials: production of compounds used for food additives and flavoring, such as allyl-syringol, syringaldehyde and syringol; eugenol as expectorant, antiseptic and analgesic in medicines for asthma and bronchitis; phenols and ketones for the production of resins. In recent years, a special attention has been given to the development of phenol derivatives present in bio-oil, especially to replace phenol with bio-oil during the preparation of phenol-formaldehyde resin type. These resins are used as binders in various types of plywood and are also a basic material in abrasive and adhesive industries. The substitution of 50% (mass) of phenol is feasible, without altering or affecting the performance of the resin.9,10
Several analytical techniques are usually employed for the analysis of bio-oils. Liquid chromatography, for example, has been used for the analysis of non-volatile compounds such as organic acids, aldeydes, ketones, alcohols, sugars and polyaromatic hydrocarbons,11 while
ultraviolet spectroscopy may be used for determination
of lignin derived oligomers in oil/bio-diesel blends and infrared nuclear magnetic resonance is useful for the analysis of carbonyl, aromatic, carboxyl and other groups.12,13 However, the pyrolyzed biomaterials are
usually analyzed by one-dimensional gas chromatography coupled to mass spectrometric detector (1D-GC/MS) in order to verify the presence of volatile compounds.10 More
recently, the use of comprehensive two-dimensional gas chromatography with a time-of-flight mass spectrometric detection system (GC×GC/TOF-MS) has proved to present some advantages for the analysis of complex mixtures, such as bio-oil, and they are the following: increased peak capacity, sensitivity, selectivity and the possibility of having an organized distribution of chromatographic peaks of structurally related compounds, in the same period of time of a 1D-GC run.14,15 The two-dimensional
technique (2D-GC) has already been applied to various matrices, such as petroleum and derivatives,14,16 coal,17
flavor and fragrances,18 beverages,19 forensic samples,20
among others.21 There are still only a few reports about
GC×GC analysis of bio-oils of different biomasses, such as for example beechwood,22 sugar cane straw,23 rice
husk and peach pit24 and Eucalyptus wood.25 Almost all of
them have used GC×GC/TOF-MS22-27 and have achieved a
better chromatographic resolution and a higher number of identified compounds when compared to results provided by gas chromatography with a flame ionization detector (GC-FID)27 and GC/MS.
This work aims at the investigation of the qualitative composition of bio-oils produced in a laboratory scale reactor, using residues of a Kraft pulp mill (digester residue, sawdust and sludge from a wastewater treatment plant) and GC×GC/TOF-MS. Optimal conditions for the pyrolysis process were set up using digester residue, and a comparison among the composition of the three bio-oils was made.
Experimental
Reagents and sample preparation
Residues (Eucalyptus sawdust, Kraft digester
heating, under ultra-pure nitrogen atmosphere (99.999%, Linde Gases, Canoas, RS, Brazil). Heating started at 25 °C and reached 1000 °C at 10 °C min−1. Masses of
residues employed in TGA were approximately 6.21 mg of sawdust, 5.53 mg of digester residue and 7.13 mg of sludge. The instrument applied was a SDT Q600 from TA Instruments (New Castle, DE, USA). Reagent employed was dichloromethane (DCM) of analytical grade (Merck, Darmstadt, Hessen, Germany) or equivalent. Anhydrous sodium sulfate was purchased from Quimex (São Paulo, São Paulo, Brazil), dried for 12 h at 200 °C and kept in a desiccator before the use. A working solution of 100 mg L−1 of syringol (2,6-dimethoxyphenol,
99.99% purity, Sigma Aldrich, St. Louis, Missouri, USA) in DCM was prepared for quantification purposes, using a 1D-GC with a quadrupole mass spectrometric detector (qMS). All bio-oils underwent liquid-liquid extraction (LLE) with DCM in a 10 mL separatory funnel in order to separate the organic from the aqueous phase. The extractions were repeated four times, each one of them with 1 mL of DCM. Dichloromethane aliquots were mixed and the residual water content removed, using anhydrous sodium sulfate. The extracts of bio-oils were passed through filter paper and the resulting solvent excess was evaporated under ambient temperature. Bio-oil yields were approximately 50, 30 and 16% for sawdust, digester residue and sludge, respectively.
Pyrolysis apparatus to obtaining bio-oil
Pyrolysis was performed according to Moraes et al.23
after some changes in the condensation system. Two gas condensers were employed: the first one with 30 cm length and 5 cm diameter, and the second one with 10 cm length and 2 cm diameter (Figure 1).
Pyrolysis experimental design
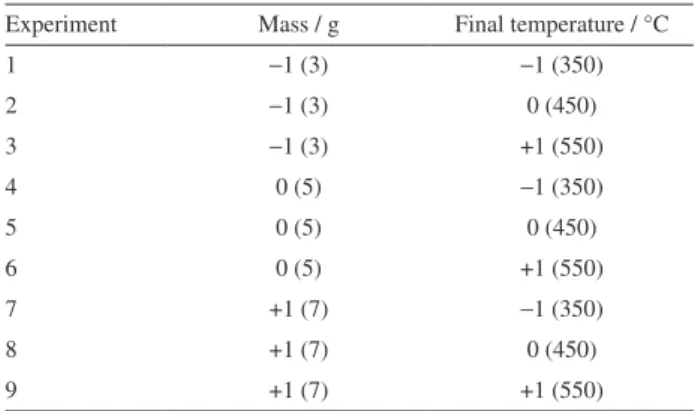
An experimental planning was developed for the residue of the digester and it was designed based on literature information and on thermogravimetric analysis results. The parameters investigated were mass and pyrolysis final temperature, while nitrogen flow rate (1 mL min−1) and
residence time at final pyrolysis temperature (5 min) were kept constant. Heating rate was also kept constant at the maximum of the equipment capacity (100 °C min−1),
as it is known that faster heating rates provide higher liquid yields.28 The particle size used was 20 mesh, close
to the optimum size employed for the production of bio-oil of waste furniture sawdust (0.7 mm).29 Values for
the mass of residue were 3, 5 and 7 g, while maximum pyrolysis temperatures were 350, 450 and 550 °C. Nine experiments and a triplicate in the central point were performed according to conditions in Table 1. Considering that siringol (2,6-dimethoxyphenol) is the major component of digester residue bio-oil, the experimental conditions chosen were the ones that provided the higher syringol concentration. Sawdust and sludge underwent the same pyrolysis experimental conditions.
Syringol quantification was carried out by 1D-GC/qMS (Shimadzu QP-5050A, Kyoto, Japan), operating the mass spectrometric detector at 70 eV in the single ion monitoring mode (m/z 154). A 100 mg L−1 solution of syringol in DCM
was employed for this purpose. The column used was an OV-5 30 m × 0.25 mm × 0.25 µm. Initial oven temperature was 50 °C for 2 min and it reached 280 °C at 4 °C min−1
for 3 min. Injector and transfer line were at 280 °C, while ion source was kept at 200 °C. Carrier gas flow (helium, 99.999% purity, Linde Gases, Canoas, RS, Brazil) was 1 mL min−1 and a volume of 1 µL of 1000 µg mL−1 solution
of bio-oil in DCM was injected for the chromatographic analysis in the split mode (1:10).
Table 1. Experimental conditions for improvement of the pyrolysis process using digester residue
Experiment Mass / g Final temperature / °C
1 −1 (3) −1 (350)
2 −1 (3) 0 (450)
3 −1 (3) +1 (550)
4 0 (5) −1 (350)
5 0 (5) 0 (450)
6 0 (5) +1 (550)
7 +1 (7) −1 (350)
8 +1 (7) 0 (450)
9 +1 (7) +1 (550)
Analyses by comprehensive two-dimensional gas chromatography with mass spectrometric detection
T h e c o m p r e h e n s i v e t w o - d i m e n s i o n a l g a s chromatography system (GC×GC) was an Agilent 6890N (Agilent Technologies, Palo Alto, CA, USA), connected to a LECO Pegasus IV time-of-flight mass spectrometric detector (TOF-MS, St. Joseph, MI, USA). The first dimension chromatographic separation was performed with a non-polar DB-5 column (5% diphenylpolysiloxanes, 95% dimethylpolysiloxanes) of 50 m length, 0.25 mm i.d., and 0.25 µm film thickness. The second dimension column was located in a secondary oven and consisted of a DB-17 column (50% phenyl methylpolysiloxane, 50% methylpolysiloxane) with 2.15 m lengh, 0.18 mm i.d., and 0.18 µm film thickness. Both columns were purchase from Agilent Technologies (Folsom, CA, USA). Cryofocusing was achieved with nitrogen vapor cooled by liquid nitrogen in a quad-jet dual-stage modulator. A hot jet of 2.4 s and a cold jet of 1.6 s were applied. Initial oven temperature of the primary oven was held at 60 °C for 0.20 min and the oven was heated to 310 °C at a rate of 3 °C min−1 and kept
for 20 min. The temperature of the secondary oven was maintained 10 °C above the temperature of the primary oven, and the modulator temperature offset was 25 °C. The modulation period was 8 s. Transfer line and ion source temperatures were 320 and 250 °C, respectively. The flow rate of the carrier gas (helium of 99.999% purity, Linde Gases) was 1.2 mL min−1 and injections were
performed in splitless mode at 280 °C. Mass range covered was 45-500 Da and data acquisition rate was 100 Hz.
Data acquisition and processing
Instrument control and data acquisition were done through ChromaTOF software (LECO, version 3.32). Bio-oil compounds were tentatively identified through comparison of their deconvoluted mass spectra with those from the National Institute of Standards and Technology (NIST) library. A minimum similarity of 600 and a minimum signal to noise of ten were adopted for the tentative identification process. Position of the chromatographic peaks in the separation space was also taken into account for the purpose of identification. Column bleed and solvent peak areas were excluded from the total sum of chromatographic areas. For the purpose of group type classification, chromatographic areas and retention time data were introduced in a Microsoft Excel software table (version 2007), according to their classes and subclass, after a manual examination of the whole chromatogram. Apex plots were generated from Excel tables according to the different chemical classes present in
the bio-oil in order to help the visualization of the organized distribution of chromatographic peaks of the different groups spread over the two-dimensional space.
A simplified semi-quantification approach was employed due to the large number of compounds present in bio-oil, taking into account that the only purpose of the quantification would be a comparison among the percentages of compounds in the three bio-oil samples. Even though the response factors would be different for distinct compounds, they were supposed to be the same for all compounds, for the sake of simplicity. The chromatographic area percentage for each compound in a sample was calculated considering the sum of the areas of all detected compounds as a hundred percent.
Results and Discussion
Thermogravimetric analyses of residues
The crude samples of sawdust, digester residue and sludge contained 2.5, 3.9 and 4.1% of humidity, respectively.30 The TGA curves for thermal decomposition
of the three samples are shown in Figure 2. Digester residue thermogram shows two important steps of weight loss: the first, until 85 °C, is due to CO2 and water evaporation,
while the second (250 to 400 °C) is probably related to the transformation of hemicellulose, cellulose and lignin. From 400 °C, other changes occur that are not readily recognizable. A similar profile was observed in the sawdust thermogram except that the weight percentage for the loss of cellulose, hemicellulose and lignin was 51% for sawdust and 36% for the digester residue. The main loss for the wastewater sludge occurred in the same temperature interval, and corresponded to 28% of the weight percentage. According to Raveendran et al.,31
cellulose decomposes within a narrow temperature range, between 300 and 430 °C, lignin over a wider temperature range, 250 to 550 °C, and hemicelluloses are thermally the most unstable and start decomposing at a much lower temperature than the other components. Based on these results, the pyrolysis temperatures for the digester residue experimental planning were 350, 450 and 550 °C, as the total decomposition of biomass can be achieved below 550 °C.
Pyrolysis experimental conditions
nine pyrolysis experiments carried out. It was positively identified with standard injection, using 1D-GC/qMS in selected ion monitoring (SIM) mode. Some applications of syringol may be mentioned: antioxidant, flavor and fragrance32 in the food industry due to its smoky aroma (in
meat, soup and seafood), antifungal and antibacterial33,34 and
also in pharmaceuticals because of its anti-dermatophyte activity.33 The highest syringol concentration was obtained
when 7 g of biomass and a final temperature of 550 °C were employed in the pyrolysis process (experiment number 9 in Figure 3 and Table 1). Pyrolysis experiment number 8 was carried out at 450 °C and also provided a similar syringol concentration, however literature recommends
a higher temperature range to ensure lignin degradation (from 250 to 550 °C).31,35 Taking into consideration that
syringol is a lignin derivative and that pyrolysis processes are usually performed in the range of 425 to 557 °C, a final pyrolysis temperature of 550 °C was chosen.5,36,37
Pyrolyses of sawdust and sludge were carried out under the same experimental conditions and all tree bio-oils were qualitatively analyzed by GC×GC/TOF-MS.
To the best of our knowledge, there are no reports in the scientific literature about the production of bio-oil from residue of the Kraft process digester and this is the first attempt in this direction. Slow and fast pyrolysis of waste furniture sawdust or Eucalyptus sawdust and also pyrolysis of different types of wood have already been investigated in the last ten years.28,29,38,39 Regarding
sludge pyrolysis, some research work has been done for the production of bio-oil and gas through pyrolysis of sewage sludge and resulted in promising perspectives from the environmental and economic point of view, as it alleviates the need for landfilling as a final destination for sludge. Strezov et al.7 investigated the potential of paper
sludge pyrolysis as a source of petrochemicals or even for bio-diesel production (major components of bio-oil were organic acids), having pointed out that the concomitant production of charcoal was a potential source of energy for the pyrolysis process itself.
Analysis of bio-oils by comprehensive two-dimensional gas chromatography with time-of-flight mass spectrometric detection
The choice of a column set was based on former works of this research group, in which different raw materials were also employed for bio-oil production and
their composition was analyzed by GC×GC/TOF-MS.24
GC×GC experimental conditions were further improved for the bio-oils under study and analyses results are shown in the 3D plots in Figure 4, along with chromatographic Figure 2. Thermogravimetric analysis curves for thermal decomposition
of the bio-oil of digester residue, sawdust and sludge.
peaks of major components of bio-oils that were tentatively identified.
Sawdust and digester residue provided similar chromatographic profiles and wastewater treatment sludge produced a completely different and more complex chromatographic profile.
A deeper look into the 3D plots in Figure 4 shows that syringol, the main component of the bio-oil of digester residue (1t
R = 26.233 min, 2tR = 6.63 s), co-elutes with another
compound (a C1 indanone, 1t
R = 26.233 min, 2t
R = 6.54 s)
in both chromatographic dimensions. In this case, mass spectral deconvolution offered by GC×GC/TOF-MS software played an important role to solve this analytical problem, as shown in Figure 5. The spectral deconvolution software may provide separation among two or more compounds through differences in their mass spectra and retention times, as TOF-MS assures constant ion ratios along the chromatographic peak.40 Whenever mass spectra
fragmentation of compounds is sufficiently different, the reconstruction of the chromatogram in the second dimension through the deconvoluted ion current (DIC) can be employed to solve chromatographic separation problems. The extracted ion current (EIC) allows the selection of the molecular ion of each compound, generating a reconstructed chromatogram.40
Syringol and a C1-indanone were easily separated by spectral deconvolution as they present distinct mass spectra.
Deconvoluted mass spectra of both compounds were similar to their corresponding mass spectra in the NIST library (similarity of 944 for syringol and 769 for C1-indanone). Considering that syringol may be a compound of interest for future industrial production, the use of 1D-GC/qMS might be misleading in case of qualitative and quantitative analyses of this compound and would also probably provide a lower quality mass spectrum due to C1-indanone interference. GC×GC/TOF-MS or perhaps GC×GC-FID might be a choice when a non-polar column is employed in 1D-GC. However, 1D-GC with a different stationary phase may also be a choice for the separation of this pair of compounds. A TOF-MS detector coupled to 1D-GC might also be an alternative that adds separation efficiency to a 1D-GC system, however the major advantages of GC×GC/TOF-MS is that it produces actual separation of compounds providing better mass spectra quality and consequently higher similarity matches with the NIST/Wiley mass spectra libraries leading to a more reliable identification of unknown compounds in non-target analysis of complex mixtures.41,42
Apexes plot approach for classification of chromatographic peaks in different chemical classes
The use of ChromaTOF software may help to verify the organized distribution of compounds of different
chemical classes in the two-dimensional (2D) space, as may be seen in other scientific reports, as for examples esters, aldehydes and ketones, tiols, alcohols, lactones, and acids in the Merlot wine headspace43 or organic sulfur
compounds of petroleum or its heavy fractions.44 However,
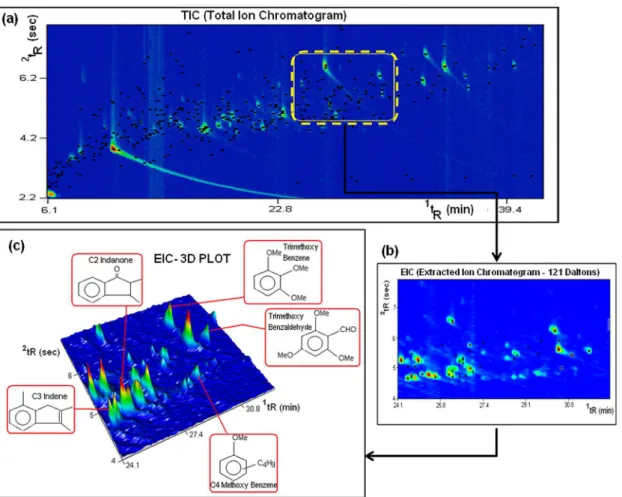
if the complexity of the sample is higher and/or the dimensionalities of the chromatographic system and sample are not compatible, GC×GC data and available commercial software tools may not be enough to provide a clear view of the organized distribution of compounds of the same chemical class, as overlap of chromatographic peaks of different chemical classes may occur in the same region of the 2D-plot, even when characteristic ions, specific of a certain chemical class are extracted. Figure 6 shows a detailed color plot of the bio-oil obtained from digester residue (a), and a zoom in the region of phenols using the EIC (extracted ion current chromatogram) that takes into consideration the current provided by ion 121,
which is characteristic of phenols (b). It also shows a 3D plot of the EIC (Figure 6c). The phenols are marked in Figure 6b by black dots, but it is possible to observe that non phenol compounds (signaled by red dots) also show up in this same region. Five non-phenol compounds are detailed in Figure 6c. Even though the identity of those non-phenolic compounds is not confirmed, the important point is that they elute in the same region of phenolic compounds and their presence compromises the visual quality of the organized peak distribution that might be seen in the 2D-space.
Sfetsas and coworkers have also reported the difficulties faced to classify different classes of structurally related compounds in the 2D chromatogram, when GC×GC data is treated only with ChromaTOF software. Overlap of many analytes belonging to different chemical groups that elute in neighboring retention times has been reported, which may lead to compound misidentification. The procedure of Figure 5. Example of peak deconvolution of two components that co-elute in both chromatographic dimensions (1t
R = 26.233 min). Modulated peaks of
syringol (2t
R = 6.63 s, green line corresponds to ionic current due to ion 154) and C1 indanone (2tR = 6.54 s, orange line corresponds to ionic current due
defining wide-content areas of the 2D plot to encompass more than one group of compounds (e.g., furans, cyclic or linear ketones and aldehydes) did not solve the problem, but overlooked it.27
A more elaborate classification method would be of interest to help distinguishing compounds in the 2D space according to their chemical group.
A detailed analysis of the mass spectrum of each chromatographic peak of the three bio-oils has allowed the classification of different components according to their chemical classes. Area counts and retention data (1t
R and 2tR) were transferred to a Microsoft Excel table
providing enough information for the calculation of the relative area percentage of the tentatively identified components of each bio-oil. Generation of apex plots of compounds of distinct chemical classes was also performed using dispersion graphs with Excel. Eleven major classes of compounds were tentatively identified in all bio-oils under study: sugars, esters, alcohols, aldehydes, phenols, ketones, ethers, hydrocarbons, acids, nitrogen and sulfur compounds. This procedure has already been employed by Moraes et al.24 and it is especially useful when
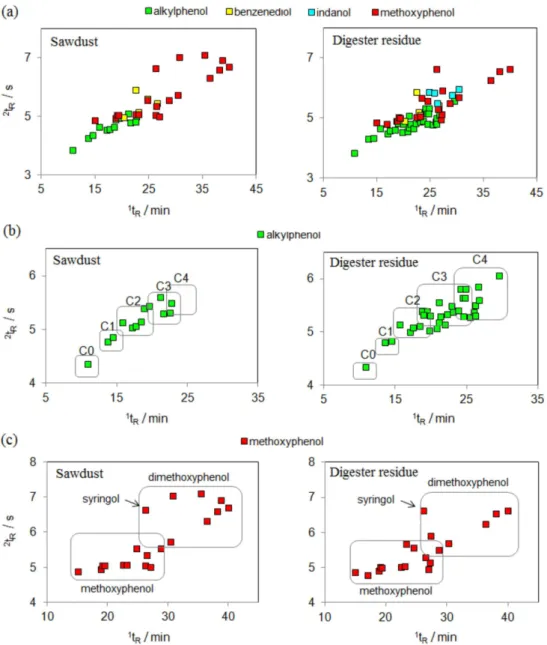
co-elutions of several compounds of different classes are observed in certain regions of the 2D space. Figure 7 presents several subclasses of phenols in the bio-oils of sawdust and digester residue and it is difficult to distinguish among them as co-elutions arise because of their similar retention properties. As the distinct subclasses of phenols are depicted as apex plots (Figures 7b and 7c), it becomes easier to verify the organized distribution of compounds in each subclass of phenols. Figures 7b shows the organized distribution of C0, C1, C2, C3 and C4 alkylphenols for both bio-oils, where x in Cx stands for the number of carbon atoms in the phenol alkyl chain. Figure 7c presents the distribution of dimethoxyphenols in the upper part of the apex plot due to their stronger retention in both dimensions, in contrast with methoxy phenols, which are located in the bottom part of the plot, as they present lower polarity and molecular weight.
monoaromatic hydrocarbons, unsaturated and saturated hydrocarbons. Saturated hydrocarbons (Figure 8b), as non-polar compounds are less retained in the second
chromatographic dimension (2D), and consequently
are located on the bottom part of the plot, followed by unsaturated, monoaromatic hydrocarbons and PAH in order to increase the polarity. A clear visualization of the separation of subclasses of compounds may be seen in the following figures: hydrocarbons with one and two double bonds in Figure 8b; indanes, indenes and alkyl benzenes in Figure 8c; naphthalenes and other PAH of higher molecular weight in Figure 8d.
The use of apex plots generated from GC×GC/TOF-MS retention data in the Excel software is an alternative for the
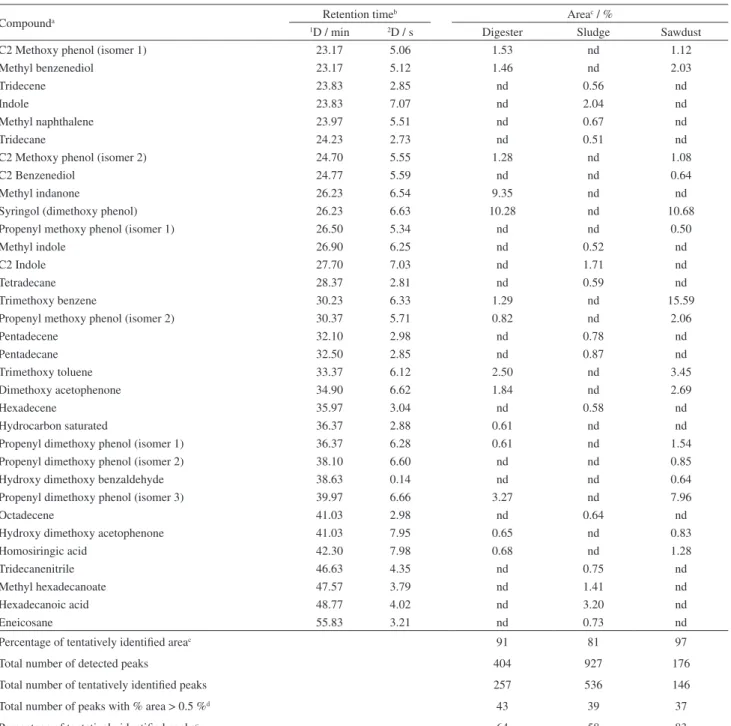
visualization of components of different classes of complex mixtures. Even though it is a time consuming task, it presents a clear view of the compound distribution in distinct classes of compounds. It also contributes to a better understanding of the identity of each one of the compounds present in a complex mixture. Compounds tentatively identified in the bio-oils of digester residue; sawdust and sludge were 257, 146 and 536, respectively. These numbers correspond to 64, 83 and 58% of the total number of peaks detected, and to 91, 97 and 81% of the total area detected in bio-oils of digester residue, sawdust and sludge, respectively (Table 2). Table 2 also shows the main components (relative area contribution > 0.5%) present in the three bio-oils.
Bio-oil compounds and some of their applications
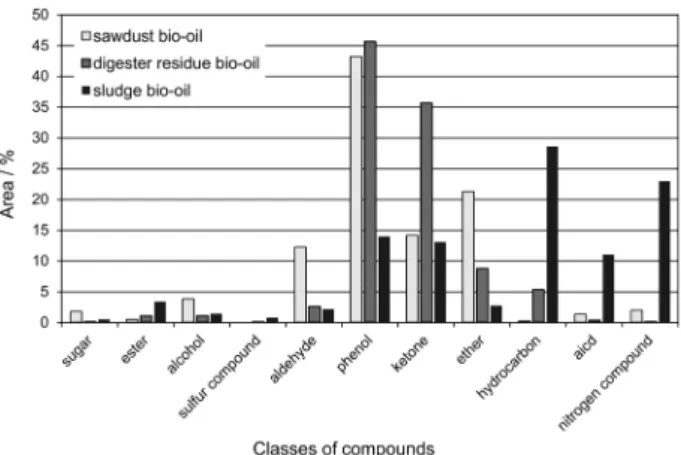
Figure 9 shows the area percentage of tentatively identified compounds of the major chemical classes of the three bio-oils. Bio-oils of sawdust and digester residue stand out for their high amount of phenolic compounds, indicating their potential as a replacement for phenol in the production of phenol-formaldehyde resins, taking into consideration that these bio-oils are rich in oligomeric fragments of the lignin degradation.10 The most important
contributions in this regard were developed by the National Renewable Energy Laboratory (NREL)45,46 and
Biocarbons47 in USA, Ensyn48 and Pyrova49 in Canada and
Chimar Hellas in Greece.50
Conversion of specific groups such as carbonyl (aldehydes and ketones in Figure 9), carboxyl and phenyl may be accomplished in order to obtain specific chemicals of interest. Biolime, a patented product of the Dynamotive Corporation (Canada), is an example of a product that was obtained from the reaction of carboxylic acid and phenol with lime to form calcium salts and phenolates, which are capable of capturing SOx emissions (90-98%) from burning coal. In addition, some components of this product proved to be effective in nitrogen oxide destruction.10,51,52 Other patents are marketed by the Red
Table 2. Tentative identification and semi-quantification of the bio-oil components (relative area contribution > 0.5%) of digester residue, sludge and sawdust bio-oils
Compounda Retention time
b Areac / %
1D / min 2D / s Digester Sludge Sawdust
Butenoic acid 6.10 2.31 nd 0.66 nd
Furfural (isomer 1) 6.37 3.01 nd nd 0.71
Pentanoic acid 6.63 2.40 nd 1.07 nd
Furfural (isomer 2) 6.77 3.23 0.90 nd 7.44
Cyclopentenone 6.77 3.41 2.15 0.51 1.35
Furanmethanol 7.17 3.10 0.56 nd 3.02
C2 Benzene 7.57 2.67 nd 0.90 nd
Methyl cyclopentenone (isomer 1) 8.50 3.74 2.49 0.51 0.57
Dihydro furanone 8.50 5.16 0.55 nd nd
Furanyl ethanone 8.63 3.78 0.80 0.84 nd
Methyl cyclopentenone (isomer 2) 10.23 4.57 1.13 1.14 nd
Furanone 8.77 5.33 nd nd 0.79
Hydroxy cyclopentenone 8.90 4.03 nd nd 0.65
Pentanedione 10.10 4.03 nd nd 0.86
Methyl furfural 10.37 4.30 nd nd 0.99
Phenol 10.84 3.88 1.33 2.16 1.18
Benzonitrile 10.90 4.67 nd 0.53 nd
C2 Cyclopentenone (isomer 3) 11.43 4.22 1.22 nd nd
Dibutyl amine 11.43 4.94 nd nd 1.17
C2 Dihydro furanone 11.43 5.00 nd nd 0.69
Benzodioxolane 11.83 4.20 nd nd 0.82
C2 Cyclopentenone (isomer 4) 12.23 4.68 0.72 0.59 nd
C3 Pyridine (isomer 1) 12.37 4.01 nd 0.51 nd
Methyl cyclopentanedione (isomer 1) 12.37 4.67 1.41 nd nd
Methyl cyclopentanedione (isomer 2) 12.50 4.64 0.55 1.10 1.36
C2 Cyclopentenone (isomer 5) 12.90 4.73 3.19 1.03 nd
C5 Dioxolane 13.03 5.07 0.92 nd nd
Methyl phenol (isomer 1) 13.61 4.30 2.54 2.23 0.86
C2 Cyclopentanedione (isomer 3) 13.57 4.33 1.66 1.66 nd
C2 Aniline 13.70 4.24 nd 1.99 nd
C3 Cyclopentenone 13.83 4.35 0.68 nd nd
C3 Pyridine (isomer 2) 14.10 4.33 nd 1.55 nd
Methyl phenol (isomer 2) 14.50 4.35 2.09 5.36 0.95
Methyl pyrrolidinedione 14.63 7.61 nd 1.22 nd
Furfuryl furan 14.77 4.33 nd 0.76 nd
Methoxy phenol 15.03 4.87 6.51 nd 2.44
Octadienal 15.43 4.77 0.59 nd nd
Methyl benzene acetaldehyde 15.57 4.91 nd 0.65 nd
C2 Phenol (isomer 1) 15.70 4.64 1.04 nd nd
C2 Phenol (isomer 2) 17.17 4.49 0.54 nd nd
C2 Phenol (isomer 3) 17.57 4.58 1.45 nd nd
Methyl indene 17.70 4.57 2.00 nd nd
Dihydro naphthalene 17.70 4.61 nd 1.71 nd
C2 Phenol (isomer 4) 18.44 4.65 1.30 1.32 nd
C2 Phenol (isomer 5) 18.77 4.89 0.69 nd nd
Methyl methoxy phenol (isomer 1) 18.90 4.90 0.83 nd nd
Methyl methoxy phenol (isomer 2) 19.43 5.03 1.24 nd 3.94
C2 phenol (isomer 6) 19.57 4.91 1.24 nd 1.09
Benzene propanenitrile 21.30 6.88 nd 0.86 nd
Methoxy benzenediol 22.50 5.91 nd nd 0.86
Compounda Retention time
b Areac / %
1D / min 2D / s Digester Sludge Sawdust
C2 Methoxy phenol (isomer 1) 23.17 5.06 1.53 nd 1.12
Methyl benzenediol 23.17 5.12 1.46 nd 2.03
Tridecene 23.83 2.85 nd 0.56 nd
Indole 23.83 7.07 nd 2.04 nd
Methyl naphthalene 23.97 5.51 nd 0.67 nd
Tridecane 24.23 2.73 nd 0.51 nd
C2 Methoxy phenol (isomer 2) 24.70 5.55 1.28 nd 1.08
C2 Benzenediol 24.77 5.59 nd nd 0.64
Methyl indanone 26.23 6.54 9.35 nd nd
Syringol (dimethoxy phenol) 26.23 6.63 10.28 nd 10.68
Propenyl methoxy phenol (isomer 1) 26.50 5.34 nd nd 0.50
Methyl indole 26.90 6.25 nd 0.52 nd
C2 Indole 27.70 7.03 nd 1.71 nd
Tetradecane 28.37 2.81 nd 0.59 nd
Trimethoxy benzene 30.23 6.33 1.29 nd 15.59
Propenyl methoxy phenol (isomer 2) 30.37 5.71 0.82 nd 2.06
Pentadecene 32.10 2.98 nd 0.78 nd
Pentadecane 32.50 2.85 nd 0.87 nd
Trimethoxy toluene 33.37 6.12 2.50 nd 3.45
Dimethoxy acetophenone 34.90 6.62 1.84 nd 2.69
Hexadecene 35.97 3.04 nd 0.58 nd
Hydrocarbon saturated 36.37 2.88 0.61 nd nd
Propenyl dimethoxy phenol (isomer 1) 36.37 6.28 0.61 nd 1.54
Propenyl dimethoxy phenol (isomer 2) 38.10 6.60 nd nd 0.85
Hydroxy dimethoxy benzaldehyde 38.63 0.14 nd nd 0.64
Propenyl dimethoxy phenol (isomer 3) 39.97 6.66 3.27 nd 7.96
Octadecene 41.03 2.98 nd 0.64 nd
Hydroxy dimethoxy acetophenone 41.03 7.95 0.65 nd 0.83
Homosiringic acid 42.30 7.98 0.68 nd 1.28
Tridecanenitrile 46.63 4.35 nd 0.75 nd
Methyl hexadecanoate 47.57 3.79 nd 1.41 nd
Hexadecanoic acid 48.77 4.02 nd 3.20 nd
Eneicosane 55.83 3.21 nd 0.73 nd
Percentage of tentatively identified areac 91 81 97
Total number of detected peaks 404 927 176
Total number of tentatively identified peaks 257 536 146
Total number of peaks with % area > 0.5 %d 43 39 37
Percentage of tentatively identified peaksc 64 58 83
nd : not detected; digester: designates digester residue; aCx: number of carbon atoms in the alkyl chain; bretention time: average of the retention times in
the three samples with standard deviation < 0.1%; carea = (Ai/ΣAi)100 in %, considering only the tentatively identified peaks; d> 0.5%: contribution higher
than 0.5% of the total relative area of the chromatographic peaks.
Table 2. continuation
as well as phenolic compounds which are employed in the food industry to obtain the known smoky flavor.53-55
In the case of the digester residue and sawdust bio-oils investigated in this work, upgrading of pyrolyzed liquid to obtain a bio-oil richer in phenolic compounds or the use of a modified pyrolytic process for the same purpose may be of interest. Another interesting possibility is to combine sawdust and digester residue biomasses for the pyrolytic
process in the industrial site since the bio-oil qualitative composition for both biomasses has shown to be similar.
Hydrocarbons were the major compounds of the bio-oil obtained from wastewater treatment plant, which corresponded to 29% of the total area percent of tentatively identified compounds. Higher hydrocarbon content may refer to the use of bio-oil as fuel.56-58 However the
Figure 9. Percentage area of tentatively identified classes of compounds present in the bio-oils of sawdust, digester residue and sludge.
energy content (calorific value), cause immiscibility with conventional fuels and low stability.10,28 Bio-oil may be
upgraded through deoxygenation, which is performed using catalytic hydrotreating and catalytic cracking.10 However,
these methods are expensive and the final product may not be competitive with fossil fuels. Sludge bio-oil has also shown a much more complex composition, including a higher variety of chemical classes. Besides phenols, ketones, nitrogen compounds, alcohols, aliphatic and cyclic hydrocarbons, it was possible to identify the formation of polycyclic aromatic hydrocarbons, which represented 7.6% of the total tentatively identified compounds. The largest area percentage of PAH corresponded to naphthalenes (4.3%), followed by indenes (2.1%) and indanes (0.5%). Fluorenes, anthracenes, phenanthrenes and biphenyls were classified as other PAH (0.7%). Although PAHs are present in a small proportion, their presence raises concerns about possible environmental impacts and also human health impacts because of their carcinogenic potential.59
A possible use of wastewater sludge bio-oil should be further investigated before it is implemented, as the above mentioned characteristics and their potential consequences to environment and human health may hinder its use.
Conclusions
The use of GC×GC/TOF-MS unveiled, to a great extent, the qualitative and semi-quantitative composition of bio-oils produced from three P&P residues (sawdust, digester residue and wastewater treatment sludge), helping to find possible environmentally friendly and economic feasible alternative uses for these products, and also to verify the environmental risks they may pose. Phenolic compounds were major components of the bio-oils produced from sawdust and digester residue, which suggests combining both residues in the same pyrolytic process and P&P industrial site.
Phenolic compounds may be employed in the place of phenol for the production of phenol-formaldeyde resins and also for other applications in the food industry, after proper bio-oil upgrading. Apex plots generated by Excel software from GC×GC/TOF-MS retention data is an alternative approach for GC×GC complex data presentation/interpretation, when a conventional column set is employed and it may help implementing future quality control of fingerprint profiling of complex matrices analyzed by GC×GC. Mass spectral deconvolution also helped separating and identifying components that co-eluted totally or partially in both chromatographic dimensions. Bio-oil obtained from P&P wastewater treatment plant presented hydrocarbons as major components; however it also contained PAH, which means that its use may be hindered due to environmental and human health concerns, unless the pyrolysis process is properly controlled in order to prevent formation of those pollutants.
Acknowledgements
The authors thank the Conselho Nacional de Pesquisa e Desenvolvimento (CNPq), the Fundação Nacional de Apoio a Pesquisa do Estado do Rio Grande do Sul (FAPERGS), the Coordenação de Aperfeiçoamento de Pessoal de Nível Superior (CAPES) and the Financiadora de Estudos e Projetos (FINEP) for financial support and scholarships. Eng. Nei Lima (the Nei Lima Consultoria Ambiental Ltda) is also acknowledged for his efforts to make this project happen, as well as the CMPC Celulose Riograndense for providing samples of the residues.
References
1. Foelkel, C.; Os Eucaliptos e os Elementos Não Processuais na Fabricação de Celulose Kraft; Eucalyptus Online Book & Newsletter, 2007, http:www.eucalyptus.com.br/disponiveis. html accessed in April 2013.
2. Associação Brasileira de Produtores de Florestas Plantadas;
Anuário Estatístico da ABRAF 2012, 7a. ed.; ABRAF: Brasília, Brasil, p. 150.
3. Bridgwater, A. V.; Biomass Bioenergy 2012, 38, 68. 4. Bridgwater, A. V.; J. Anal. Appl. Pyrolysis1999, 51, 3. 5. Demirbas, A.; J. Anal. Appl. Pyrolysis2005, 73, 39.
6. Zhang, S.; Yan, Y.; Li, T.; Ren, Z.; Bioresour. Technol.2005,
96, 545.
7. Strezov, V.; Evans, T. J.; Waste Manage. 2009, 29, 1644. 8. Cardoso, M.; de Oliveira, E. D.; Passos, M. L.; Fuel2009, 88,
756.
9. Czernik, S.; Bridgwater, A. V.; Energy Fuel2004, 18, 590. 10. Bridgwater, A. V.; Therm. Sci.2004, 8, 21.
12. Garcia-Perez, M.; Shen, J.; Wang, X. S.; Li, C.-Z.; Fuel Process. Technol. 2010, 91, 296.
13. Pittman Jr., C. U.; Mohan, D.; Eseyin, A.; Li, Q.; Ingram, L.; Hassan, E.-B. M.; Mitchell, B.; Guo, H.; Steele, P. H.; Energy Fuels2012, 26, 3816.
14. Zini, C. A.; Scientia Chromatographica2009, 1, 31. 15. Liu, Z.; Philips, J. B.; J. Chromatogr. Sci. 1991, 29, 227. 16. Von Mühlen, C.; Zini, C. A.; Caramão, E. B.; Marriott, P. J.;
Quim. Nova 2006, 29, 765.
17. Machado, M. E.; Caramão, E. B.; Zini, C. A.; J. Chromatogr., A
2011, 1218, 3200.
18. Cordero, C.; Bicchi, A.; Joulain, D.; Rubiolo, P.; J. Chromatogr., A
2007, 1150, 37.
19. Welke, J. E.; Zini, C. A.; J. Braz. Chem. Soc. 2011, 22, 609. 20. de Vos, J.; Dixon, R.; Vermeulen, G.; Gorst-Allman, P.;
Cochran, J.; Rohwer, E.; Focant, J.-F.; Chemosphere2011, 82, 1230.
21. Mondello, L.; Tranchida, P. Q.; Dugo, P.; Mass Spectrom. Rev. 2008, 27, 101.
22. Marsman, J. H.; Wildschut, J.; Mahfud, F.; Heeres, H. J.;
J. Chromatogr., A2007, 1150, 21.
23. Moraes, M. S. A.; Georges, K.; Almeida, S. R.; Damasceno, F. C.; Maciel, da Silva.G. P.; Zini, C. A.; Jacques, R. A.; Caramão, E. B.; Fuel Process. Technol. 2012, 101, 35. 24. Moraes, M. S. A.; Migliorini, M. V.; Damasceno, F. C.;
Georges, F.; Almeida, S.; Zini, C. A.; Jacques, R. A.; Caramão, E. B.; J. Anal. Appl. Pyrolysis2012, 98, 51.
25. Araújo, R. C. S.; Duarte Pasa, V. M.; Marriott, P. J.; Cardeal, Z. L.; J. Anal. Appl. Pyrolysis 2010, 88, 91.
26. Marsman, J. H.; Wildschut, J.; Evers, P.; de Koning, S.; Heeres, H. J.; J. Chromatogr., A.2008, 1188, 17.
27. Sfetsas, T.; Michailof, C.; Lappas, A.; Kneale, B.;
J. Chromatogr., A2011, 1218, 3317.
28. Mohan, D.; Pittman, C. U.; Steele, P. H.; Energy Fuel2006,
20, 848.
29. Heo, H. S.; Park, H. J.; Park, Y.; Ryu, C.; Suh, D. J.; Suh, Y.; Yim, J.; Kim, S.; Bioresour. Technol.2010, 101, 591. 30. Harris, D. C.; Análise Química Quantitativa, 7a. ed.; LTC:
Rio de Janeiro, Brasil, 2008.
31. Raveendran, K.; Ganesh, A.; Khilar, K. C.; Fuel1996, 75, 987. 32. Adsul, M. G.; Singhvi, M. S.; Gaikaiwari, S. A.; Gokhale, D. V.;
Bioresour. Technol. 2011, 102, 4304.
33. Ikegami, F.;Sekine, T.; Fuji, Y.; J. Pharm. Soc. Jpn. 1998, 118, 27.
34. Maga, A. J. In Critical Reviews in Food Science and Nutrition; Furia, E. T., ed.; CRC Press: Boca Raton, USA, 1978, p. 323. 35. Demirbas, A.; Kucuk, M. M.; Cellul. Chem. Technol. 1993, 27,
679.
36. Zhang, H.; Xiao, R.; Wang, D.; He, G.; Shao, S.; Zhang, J.; Zhong, Z.; Bioresour. Technol.2011, 102, 4258.
37. Murwanashyaka, J. N.; Pakdel, H.; Roy, C.; Technol. 2001, 24, 155.
38. Martins, A. F.; Diniz, J.; Stahl, J. A.; Cardoso, A. L.; Quim. Nova2007, 30, 873.
39. Hassan, E. M.; Yu, F.; Ingram, L.; Steele, P.; Energy Sources Part A 2009, 31, 1829.
40. Focant, J.-F.; Cochran, J. W.; Dimandja, J.-M.; DePauw, E.; Sjödin, A.; Turner, W. E.; Patterson Jr., D. G.; Analyst 2004,
129, 331.
41. Fullana, A.; Contreras, J. A.; Striebich, R. C.; Sidhu, S. S.;
J. Anal. Appl. Pyrolysis2005, 74 315.
42. Mateus, E. P; Barata, R. C.; Zrostlíková, J.; da Silva, M. D. R. G.; Paiva, M. R.; J. Chromatogr., A2010, 1217, 1845. 43. Welke, J. E.; Manfroi, V.; Zanus, M.; Lazarotto, M.; Zini, C. A.;
J. Chromatogr., A 2012, 1226, 124.
44. Machado, M. E.; Bregles, L. P.; De Menezes, E. W.; Caramão, E. B.; Benvenutti, E. V.; Zini, C. A.; J. Chromatogr., A2013,
1274, 165.
45. Chum, H. L.; Kreibich, R. E.; US pat. 5,091,4991993. 46. Kelly, S.; Wang, X.; Myers, M.; Johnson, D.; Scahill, J. In
Developments in Thermochemical Biomass Conversion; Bridgwater, A. V.; Boocock; D. G. B., ed.; Blackie Academic & Professional: London, UK, 1997, p. 557.
47. Himmelblau, A.; US pat. 5,034,4981991.
48. Giroux, R.; Freel, B.; Graham, R.; US pat. 6,326,4612001. 49. Roy, C.; Pakdel, H.; US pat. 6,143,8562000.
50. Tsiantzi, S.; Athanassiadou, E.; Wood Adhesives Made with Pyrolysis Oil; PyNe Newsletter: Aston University, Birmingham, UK, 2000, 10, p 10.
51. Oehr, K.; US pat. 5,458,8031998.
52. Zhou, J.; Oehr, K.; Simons, G.; Barrass, G. In Biomass Gasification and Pyrolysis, State of the Art and Future
Prospects; Kaltschmitt, M.; Bridgwater, A. V., ed.; CPL Press: Newbury, UK, 1997, p. 490.
53. Underwood, G. In Biomass Thermal Processing; Ho-Gan, E.; Grassi, G.; Bridgwater, A. V., ed.; CPL Press: Newbury, UK, 1992, 226.
54. Underwood, G. L.; Graham, R. G.; US pat. 4,876,1081989. 55. Underwood, G. L.; US pat. 5,039,5371991.
56. Meier, D.; Faix, O.; Bioresour. Technol.1999, 68, 71. 57. Scott, D. S.; Piskorz, J.; Can. J. Chem. Eng. 1984, 62, 404. 58. Dandik, L. H.; Aksoy, A.; Energy Fuel 1998, 12, 1148. 59. Almeida, F. V.; Centeno, A. J.; Bisinoti, M. C.; Jardim, W. F.;
Quim. Nova2007, 30, 1976.
Submitted: November 15, 2012