O
RIGINALA
RTICLE Revista Brasileira de FisioterapiaThe relationship between cardiac
autonomic function and clinical and
angiographic characteristics in patients
with coronary artery disease
Relação entre a modulação autonômica cardíaca e as características
clínicas e angiográficas de pacientes com doença arterial coronariana
Vandeni C. Kunz1, Raquel B. Souza2, Anielle C. M. Takahashi1, Aparecida M. Catai1, Ester Silva1,2
Abstract
Background: A reduction in heart rate variability (HRV) is considered an important indicator of autonomic dysfunction. Objectives: The aims of this study were to evaluate the presence of autonomic dysfunction measured by HRV in patients with coronary artery disease (CAD) and to compare them with normal subjects. Methods: A sample of 52 men (mean age 54±5.39 years) was allocated into three groups: obstructive CAD ≥50% (CAD+ n=18), obstructive CAD <50%, (CAD- n=17) and apparently healthy controls (CG n=17). Heart rate (HR) was measured at rest using a Polar®S810i for 15 min. HRV was analyzed via Shannon entropy (SE) and symbolic analysis (0V and 2ULV), which relate to sympathetic and vagal predominance, respectively. Statistical analysis included the Kruskal-Wallis test and multivariate analysis (p<0.05). Results: The CAD+ group presented lower SE and 2ULV% values and higher 0V% compared to CAD- and control groups (p<0.05). In the multivariate analysis, the presence of the clinical characteristics such as myocardial infarction and revascularization in the CAD+ group lead to a lower SE and higher 0V compared to the CAD- group. The use of angiotensin converting enzymes led to a higher SE in the CAD- group compared to the CAD+ (p<0.05). Conclusions: In uncomplicated CAD+ patients the patterns of HRV have a lower complexity, a greater sympathetic modulation and a lower parasympathetic modulation compared to CAD- and control groups in supine resting conditions. These results indicate that autonomic heart dysfunction is related to the degree of coronary occlusion and cardiac compromise.
Keywords: Physicaltherapy; heart rate; coronary artery disease; nonlinear dynamics.
Resumo
Contextualização: A redução da variabilidade da frequência cardíaca (VFC) é considerada como um importante marcador de disfunção autonômica. Objetivos: Avaliar a VFC em pacientes com doença arterial coronariana (DAC) e compará-los com sujeitos saudáveis.
Métodos: Cinquenta e dois homens (53±7,2 anos), divididos em três grupos, sendo dois grupos com obstrução coronariana (DAC+ com obstrução ≥50%, n=17 e DAC+ com obstrução ≥50%, n=18) e um grupo controle (GC, n=17). A frequência cardíaca (FC) foi captada batimento a batimento, a partir do Polar®S810i, em repouso supino, durante 15 minutos. A análise da VFC foi feita pelos cálculos da entropia de Shannon (ES) e pelos padrões da análise simbólica (0V e 2ULV%), relacionados à predominância simpática e vagal, respectivamente. A análise estatística incluiu o teste de Kruskal-Wallis e a análise multivariada (p<0,05). Resultados: O grupo DAC+ apresentou menores valores de ES e 2ULV% e maior 0V quando comparado aos grupos DAC- e CG. Na análise multivariada, observou-se menor ES e maior 0V na preobservou-sença das características clínicas prévias, como infarto e revascularização do miocárdio no grupo DAC+ comparado ao grupo DAC-. O uso de inibidores da enzima conversora de angiotensina contribuiu para maior ES do grupo DAC- comparado ao DAC+. Conclusões: Na DAC+ não complicada, os padrões da VFC apresentam menor complexidade, maior modulação autonômica simpática e menor modulação parassimpática comparativamente ao DAC- e ao GC em repouso supino. Esses resultados indicam que a disfunção autonômica cardíaca está relacionada ao grau de oclusão coronariana e ao comprometimento cardíaco.
Palavras-chave: Fisioterapia; frequência cardíaca; doença arterial coronariana; dinâmica não-linear.
Received: 08/12/2011 – Revised: 08/15/2011 – Accepted: 08/17/2011
1 Laboratory of Cardiovascular Physical Therapy, Nucleus of Research in Physical Exercise, Physical Therapy Department, Universidade Federal de São Carlos (UFSCar), São Carlos, SP, Brazil 2 Faculty of Health Sciences, Universidade Metodista de Piracicaba (UNIMEP), Piracicaba, SP, Brazil
Correspondence to: Ester da Silva, Núcleo de Pesquisa em Exercício Físico, Departamento de Fisioterapia, Universidade Federal de São Carlos, Rodovia Washington Luis, Km 235, Caixa Postal 676, CEP 13565-905, São Carlos, SP, Brasil, e-mail: [email protected]; [email protected]
Introduction
Physiological and environmental risk factors for develop-ing coronary artery disease (CAD) such as smokdevelop-ing, obesity, sedentarism, arterial hypertension, diabetes and hypercholes-terolemia, are well known. hese risk factors alter autonomic function1-3, which is associated with both the progression of
CAD4 and increased mortality in the general population5-7. his
increased risk may be a result of electrical instability in the heart because of an unstable autonomic environment domi-nated by sympathetic nervous system inluences8,9.
Alterations in the cardiac autonomic nervous system of CAD patients are related to the degree of coronary artery occlusion. hese alterations result in a decrease in the vagal modulation and an increase in the sympathetic modulation10.
Heart rate variability (HRV) has been extensively used to evalu-ate autonomic nervous system balance. A reduction in HRV is associated with an increased risk of CAD4,11-13.
Traditionally, HRV has been analyzed both in time and fre-quency domains using linear methods5,12.However, it has been
reported in the literature that heart rate (HR) dynamics are non-linear due to several oscillating subsystems that contribute through positive and negative feedback to the cardiovascular re-sponse. One of the most important subsystems is the autonomic nervous system, which modulates the HR14. herefore, an
analy-sis of non-linear HR dynamics using methods based on chaos theory has been proposed15,16. Porta et al.17 reported the analysis
of non-linear HR dynamics using Shannon entropy (SE) analysis method, which calculates the degree of complexity of a series of RR interval (RRi) patterns. Studying the complexity of autonomic cardiac regulation could provide important information about the underlying regulation mechanisms18. hus, modiication to
complexity indices could predict a pathological situation and a global depression of the organism18.
Another non-linear method that has been used to analyze sympathetic and parasympathetic systems is the symbolic analysis of a sequence of three heart beats, which allows to estimate the prevalence of each branch of the cardiac auto-nomic nervous system19. hus, identifying alterations in the
autonomic nervous system of CAD patients using non-linear methods such as SE and symbolic analysis may be useful for early evaluation and stratiication of risk, as well as for the eval-uation and monitoring of clinical vulnerability of new cardiac events and physical exercise in these patients.
Our hypothesis was that the degree of coronary occlusion is related to impairment of cardiac autonomic modulation and a reduction of complexity of sympathovagal balance. herefore, the aims of this study were to determine via HRV the presence of autonomic dysfunction based on SE and symbolic analysis in
patients with CAD and to determine if their HRV patterns are diferent from normal subjects.
Methods
Participants
A sample of 102 CAD male patients was interviewed and was considered eligible for the study via angiography at the Hospital Coronary Care Unit. he following inclusion criteria were set for participation in the study: from one to four com-promised arteries (anterior descending artery, left and right coronary arteries, left circumlex artery, marginal and diagonal branches); myocardial infarction and angioplasty in the past six months; myocardial revascularization surgery in the past 12 months; obesity (body mass index between 30 and 35 kg/m2);
smoking20; drinking21; a low weekly level of physical activity
according to the International Physical Activity Questionnaire (IPAQ) version 622; history of high blood pressure23; history of
dyslipidemia and diabetes mellitus.
Exclusion criteria included: frequent arrhythmias and extrasystoles (n=5); obstructive pulmonary disease (n=6); angioplasty carried out on the same day as the angiography (n=8); unstable angina (n=3); musculoskeletal disorders (n=5); insulin-dependent diabetes (n=6); systemic high blood pres-sure stages 2 and above (n=5), neoplasia (n=2), renal failure (n=3), stroke sequelae (n=4); use of beta blocker therapy (n=15) and refusal to participate in the study (n=5).
Based on the inclusion and exclusion criteria 35 men were included in this study (mean age 55±6.02 years). hey were classiied according to the results of the angiography as either CAD+ (n=18) or CAD- (n=17), i.e. with or without signiicant stenosis (≥50%) respectively, based on the Stable Angina Guide-lines24 and a left ventricular ejection fraction (LVEF) within
normality according to ventriculography (CAD+=56.27±5.45 and CAD-=64.47±5.83). he control group (CG) consisted of 17 healthy male volunteers (mean age 53±3.68 years) whose medical status was certiied by a full medical checkup includ-ing medical history, a physical examination, chest radiography, biochemical blood tests, electrocardiograms at rest and dur-ing exercise, and measurement of supine and standdur-ing blood pressure. he participants of the control group were also non-smokers, non-drinkers, were not taking any type of medication, and were not drug users.
his study was approved by the Ethics Research Commit-tee of the Universidade Metodista de Piracicaba (UNIMEP), Piracicaba, SP, Brazil (Number 04/09). All participants signed a consent form prior to the participation in the study.
Measurement and analysis of HRV
All experiments were carried out in the afternoon in or-der to avoid response diferences due to circadian changes. Room temperature was kept at 22 ºC with relative air humid-ity between 40% and 60%. he day before the experiment, the participants were taken to the experimental room for familiar-ization with the producers and the equipment to be used. Each subject was instructed to abstain from stimulants (cofee, tea, soft drinks), alcoholic beverages and excessive physical activity in the 24 hours prior to the exam, as well as to have a light meal at least 2 hours before the measurements.
To assess autonomic modulation, each subject’s HR and RRi were measured for 15 minutes, captured digitally, and trans-ferred to a computer for later analysis. All data were obtained before angioplasty using a Polar Advanced S810i HR monitor
and a transmitter belt (Polar Electro Co.Ltda. Kempele, Finland). All subjects were carefully instructed and the measurements were taken in the presence of the chief investigator of the study. he participants were resting, awake and in supine posi-tion with their hands lying at their sides. After resting for 15 minutes, blood pressure and HR were measured to determine whether the basal conditions of the subjects were adequate for the experiment. he HR monitor registered RRi via a transmit-ter attached to the thorax and a wristband.
HR monitors provide information recording RRi, which is deined as the time interval between two adjacent QRS com-plexes (the extension of the heart cycle). he Polar Advanced S810i detects the RR waves from the electrocardiogram with a 500 Hz sampling frequency and one-millisecond time resolu-tion25. After transferring the data to the computer, the RRi series
were analyzed and any interference was eliminated. For this measurement, the region of the greatest stability for gathering RRi was used so that 300 consecutive beats from the same time segment were presented for all paticipants12. To analyze HRV,
SE and symbolic analysis were used, both of which have been fully described and validated previously17.
Symbolic analysis
his approach, which has been described by Porta et al.17, is
based on 1) transforming a heart period variability series into a sequence of integers (i.e., symbols), 2) constructing patterns (i.e., words), 3) reducing the number of patterns by grouping them into a small number of families, and 4) evaluating the rates of occurrence of these families. A coarse-graining ap-proach based on a uniform quantization procedure was used to transform the RR series into a sequence of symbols. Briely, the full range of the series was spread over ξ symbols with a
resolution of (RRmax-RRmin)/ξ, where RRmax and RRmin were the maximum and the minimum of the series. After quantization, the RR series became a sequence RRξ ={RRξ(i), i=1,...,N} of integer values ranging from 0 to ξ-117. he
tech-nique of delayed coordinates was used to transform the RRξ series into a sequence of patterns RRξ,L={RR ξ,L,(i), i=L,...,N} with RRξ,L(i)=[RRξ(i), RRξ(i-1),..., RRξ(i-L + 1)]. he number of possible RRξ,L(i) was ξL. Since ξL grew very rapidly with L and ξ, both
parameters had to be small. For applications over short data sequences, the best compromise was ξ=6 and L=3, and the number of possible patterns was 21617.
To reduce the number of patterns without losing infor-mation, we followed a procedure of redundancy reduction. All the patterns were grouped without loss into four families, according to the number and types of variations from one symbol to the next. he pattern families were as follows: 1) patterns with no variation [0V: all the symbols are equal, e.g., (4,4,4) or (2,2,2)], 2) patterns with one variation [1V: 2 consecutive symbols are equal and the remaining symbol is diferent, e.g., (3,4,4) or (4,4,2)], 3) patterns with two like vari-ations [2LV: the 3 symbols form an ascending or descending ramp, e.g., (1,2,4) or (4,3,2)], and 4) patterns with two unlike variations [2ULV: the 3 symbols form a peak or a valley, e.g., (2,4,2) or (4,1,2)]17. We evaluated the rates of occurrence
of these families, which were designated 0V%, 1V%, 2LV%, and 2ULV%. To compute these indices, we simply count the number of times a pattern Rξ =6,L=3(i) belonging to a speciic family was found in RRξ =6,L=3. he result (multiplied by 100) was divided by [N-(L-1)]17.
Studies with pharmacological blockade19 and autonomic
tests have indicated that 0V% and 2ULV% indices are able to assess sympathetic and parasympathetic modulations, respectively.
Shannon Entropy (SE) analysis
he SE of the pattern distribution was calculated to provide a description of pattern distribution complexity, i.e., SE is an index describing the shape of the distribution of the patterns. he SE is large if the distribution is lat (all patterns are identi-cally distributed and the series carries the maximum amount of information). On the other hand, the SE is small if there is a probable subset of patterns, while others are missing or infre-quent (e.g., in a Gaussian distribution)17,26.
Data analysis
he series length N was ixed at 300 beats. he mean RR and the variance of the RR series were calculated.
Statistical analysis
For the between-group analysis of the SE data and the 0V and 2ULV patterns, the Kruskal-Wallis test with Dunn’s post hoc was used. The HRV (SE, 0V and 2ULV) relationship with covariant clinical characteristics (myocardial infarc-tion >6 months, myocardial revascularizainfarc-tion >12 months, angioplasty >6 months, number of diseased vessels and location of stenosis), risk factors (hypertension, diabetes mellitus, dyslipidemia, family predisposition to CAD, obe-sity, smoking and drinking) and medications angiotensin converting enzyme (ACE) inhibitors, hypolipidemic, hy-poglycemic, diuretics and antiplatelet) was analyzed with the multivariate test model type III and Bonferroni post hoc. The significance level was set at 5% for all analysis (p<0.05). The programs SPSS 13.0 for Windows and Statis-tica for Windows v 6.1 (Stat Soft, Inc. 2000-2003) were used. A study-power analysis suggested that a minimum of 14 subjects analyzed in each group and a 5% significance level (two-tailed) would yield at least 80% power for detecting differences between the variables SE, 0V and 2ULV.
Results
Clinical characteristics
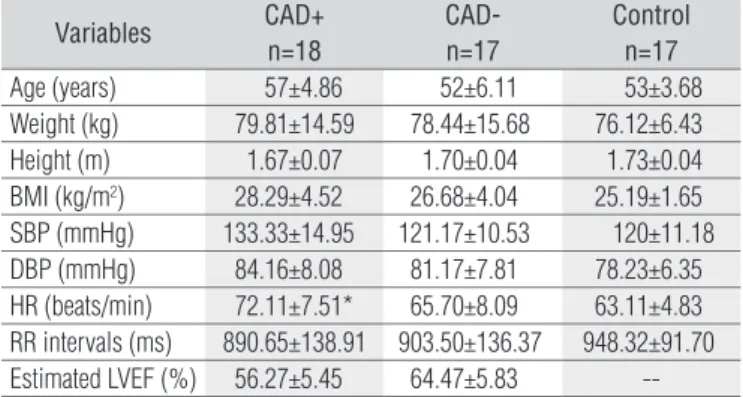
Table 1 shows the baseline characteristics and cardiovas-cular parameters of participants which can be observed that the three groups were similar, including systolic and diastolic blood pressure (SBP and DBP) (mmHg), HR (bpm), RRi (ms) and estimated LVEF (%) results at rest in the supine position. here was a statistically signiicant diference between the CAD+ and CG for HR (p<0.05). However, there were no signii-cant diferences for the other variables (p>0.05).
Data regarding the participants’ clinical characteristics, risk factors and medication used by group are presented in Table 2.
Heart rate variability indices
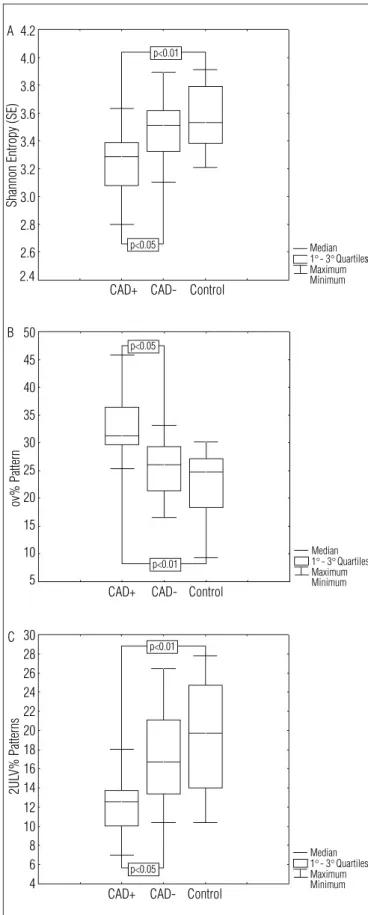
Figure 1A shows HRV analysis via SE and symbolic analy-sis; the between-group analysis presented statistically sig-niicant diferences. SE in the CAD+ group was sigsig-niicantly lower than in CAD- and CG (3.28, 3.51 and 3.53, respectively, p<0.05). he 0V pattern was lower in CG and CAD- than the CAD+ group (24.74, 26.08 and 31.26, respectively, p<0.01) (Figure 1B), and the 2ULV pattern was lower in the CAD+ group than both the CAD- and CG (12.54, 16.72 and 19.69, respectively, p<0.05) (Figure 1C).
Multivariate analysis
Regarding the relationship between group means, ac-cording to the data from the HRV analysis and the presence
Variables CAD+
n=18
CAD- n=17
Control n=17
Age (years) 57±4.86 52±6.11 53±3.68 Weight (kg) 79.81±14.59 78.44±15.68 76.12±6.43 Height (m) 1.67±0.07 1.70±0.04 1.73±0.04 BMI (kg/m2) 28.29±4.52 26.68±4.04 25.19±1.65 SBP (mmHg) 133.33±14.95 121.17±10.53 120±11.18 DBP (mmHg) 84.16±8.08 81.17±7.81 78.23±6.35 HR (beats/min) 72.11±7.51* 65.70±8.09 63.11±4.83 RR intervals (ms) 890.65±138.91 903.50±136.37 948.32±91.70 Estimated LVEF (%) 56.27±5.45 64.47±5.83
--Table 1. Clinical characteristics of the participants at baseline.
Mean±SD for continuous variables. CAD+=patients with significant coronary artery stenosis (>50%); CAD-=patients without significant coronary artery stenosis (<50%); SBP= systolic blood pressure; DBP=diastolic blood pressure; HR=heart rate; LVEF=left ventricular ejection fraction. * p<0.05 (CAD+ group vs control group).
Clinical Characteristics CAD+
yes/no CAD- yes/no
Control yes/no
Myocardial infarction (>6 months) 4/14 0/17 0/17 Myocardial revascularization (>12 months) 6/12 0/17 0/17 Angioplasty (>6 months) 4/14 0/17 0/17 No. of diseased vessels
One diseased vessel 6/12 11/6 0/17 Two diseased vessels 5/13 6/11 0/17 Three or four diseased vessels 8/10 0/17 0/17 Location of stenosis
Anterior descending artery 14/4 11/6 0/17 Right coronary artery 11/7 6/11 0/17 Left circumflex artery 5/13 2/15 0/17 Marginal arteries 7/11 3/14 0/17 Diagonal arteries 7/11 0/17 0/17 Risk factors
Hypertension 15/3 6/11 0/17 Diabetes mellitus 9/9 2/15 0/17 Dyslipidemia 11/7 8/9 0/17 Family predisposition to CAD 9/9 4/13 0/17 Overweight (BMI between 25 and 30 kg/m2) 7/11 5/12 5/12 Obesity (BMI > 30 kg/m2) 7/11 4/13 0/17
Smoking 6/12 3/14 0/17
Drinking 2/16 3/14 0/17
Medications
ACE-inhibitors 7/11 6/11 0/17 Hypolipidemic 10/8 4/13 0/17 Hypoglycemic 6/12 2/15 0/17
Diuretics 6/12 2/15 0/17
Antiplatelet 16/2 5/12 0/17
Table 2. Clinical and angiographic data, risk factors and medications.
CAD+=patients with significant coronary artery stenosis; CAD-=patients without signifi-cant coronary artery stenosis; ACE=angiotensin-converting enzyme.
of clinical characteristics, risk factors and medications used (shown in Table 3); it was observed that among patients of the CAD+ group who had a history of infarction and myocar-dial revascularization, the SE values were lower and the 0V pattern was higher compared to the CAD- group (p<0.05). Regarding the use of ACE inhibitors, the patients from the CAD- group who used this medication presented higher SE compared to the CAD+ group (p<0.05). However, the 2ULV pattern presented no relationship with clinical characteris-tics, risk factors or medications.
2.4 4.2 4.0 3.8 3.6 3.4 3.2 3.0 2.8 2.6 CAD+ A CAD- Control Median Maximum Minimum
Shannon Entropy (SE)
1s- 3sQuartiles p<0.05 p<0.01 50 45 40 35 30 25 20 15 5 10 CAD+ B CAD- Control Median Maximum Minimum ov% Pattern
1s- 3sQuartiles p<0.01 p<0.05 30 28 26 24 22 20 18 16 14 12 10 8 6 4 CAD+ C CAD- Control Median Maximum Minimum 2UL V% Patterns
1s- 3sQuartiles p<0.05
p<0.01
Figure 1. Box Plot (Median, 1º and 3º quartiles, minimum and maximum) showing results of Shannon entropy (1A) and symbolic analysis (0V, patterns with no variation (1B) and 2ULV, patterns with two unlike variations (1C)) in the CAD+ (patients with significant coronary artery stenosis), CAD- (patients without significant coronary) and control groups.
Clinical Characteristics
Variables
SE 0V 2ULV
Myocardial infarction (>6 months)
ns CAD+ > CAD- and control*
ns
Myocardial revasculariza-tion (>12 months)
ns CAD+ > CAD- and control*
ns
Angioplasty (>6 months) ns ns ns No. of diseased vessels
One vessel disease ns ns ns Two vessel disease ns ns ns Three or four vessel
disease
ns ns ns
Location of stenosis
Anterior descending artery ns ns ns Right coronary artery ns ns ns Letf circunflex artery ns ns ns Marginal arteries ns ns ns Diagonal arteries ns ns ns Risk factors
Hipertension ns ns ns
Diabetes mellitus ns ns ns
Dyslipidemia ns ns ns
Familial predisposition to CAD
ns ns ns
Overweight (BMI betwen 25 and 30 kg/m2)
ns ns ns
Obesity (BMI > 30 kg/m2) ns ns ns
Smoking ns ns ns
Drinking ns ns ns
Medications
ACE-inhibitors CAD+ < CAD-*
ns ns
Hypolipidemic ns ns ns
Hypoglycemic ns ns ns
Diuretics ns ns ns
Antiplatelet ns ns ns
Table 3. Multivariate analysis of mean between groups, according heart rate variability variables and the presence of clinical characteristics, risk factors and medications.
SE=Shannon entropy; 0V= patterns with no variation; 2ULV=patterns with two unlike variations; CAD+=patients with significant coronary artery stenosis; CAD-=patients wi-thout significant coronary; Control=control group; ACE=angiotensin-converting enzyme; ns=not statistically significant. *p<0.05.
Discussion
he results of this study, based on SE and symbolic analysis, indicate presence of autonomic heart dysfunction in CAD pa-tients with ≥50% occlusion compared to either CAD papa-tients with <50% obstruction and normal subjects.
SE is a measure of the complexity of the distribution of the sample of a signal17. Our results suggest that the complexity of
autonomic HR modulation is related to the severity of coronary occlusion, given that the CAD+ group presented a reduction in SE compared to CAD- and control groups. A reduction in SE is related to cardiac sympatho-vagal imbalance, which can pre-dict global depression as well as other pathological situations18.
Voss et al.27 observed a decrease in SE patterns in patients after
myocardial infarction, which is related to an increase in the risk of malignant arrhythmias and sudden cardiac death.
In our study, CAD+ patients presented lower SE as well as alterations in symbolic analysis patterns, with a decrease in the 2ULV pattern and an increase in the 0V pattern compared to the CAD- and control groups. he 0V patterns are features of slow waves (LF oscillations), while 2LV and 2ULV patterns are fragments of faster waves (HF oscillations)17. Symbolic patterns
have been linked to sympathetic and vagal cardiac modulation in previous studies with pharmacological blockade and auto-nomic tests in healthy and diseased populations19,26,28,29. he
0V pattern has been associated with sympathetic modulation while 2ULV has been associated with vagal modulation19,29.
herefore, our results suggest that patients from the CAD+ group have increased sympathetic modulation and decreased vagal modulation, which are related to the severity of the coro-nary occlusion.
hese indings agree with previous studies involving linear methods, which observed that coronary insuiciency led to dysfunction of the autonomic modulation of HR characterized by an increase in sympathetic modulation or a decrease in va-gal modulation30-32.
he imbalance in autonomic modulation that accompa-nies CAD is due to increased sympathetic adrenergic tone and reduced parasympathetic activity, which causes augmented ventricular workload and oxygen demand, thus increasing the occurrence of ischemic events, and causes modiication to the ionic currents across the cellular membrane, leading to direct electrical instability of myocytes30. It is known that abnormal
autonomic function predisposes arrhythmias under vari-ous clinical and experimental conditions, particularly during physical stress. herefore, important prognostic information about the appearance of undesirable events, including cardiac mortality, can be obtained from an analysis of HRV indices10,27.
Regarding the relationship between variables obtained from the HRV analysis and clinical characteristics, risk factors and
the use of medication, the results demonstrated that patients from the CAD+ group who had a previous history of myocar-dial infarction and revascularization presented lower SE and higher 0V pattern than the CAD- group. his means that, even six months after AMI and the revascularization period, these two clinical characteristics associated with the degree of coronary occlusion were the ones that most contributed to the decrease of complexity in autonomic modulation and to the increase in sympathetic modulation. his corroborates the inding of longitudinal studies that have evaluated patients after AMI33-35 or myocardial revascularization surgery36,37 that
autonomic dysfunction could be present up to 12 months after a coronary event.
Upon analyzing the relationship between HRV variables and medication use, it was observed that there was a higher SE value for patients from the CAD- group compared to the CAD+ group when subjects who used ACE inhibitors were consid-ered. his relects a greater complexity of RRi series for patients from the CAD- group. Due to the inhibition of angiotensin II functions along with the consequent attenuation of vasocon-striction and sympathetic activity38 ACE inhibitors lead to
signiicant recovery of HRV indices, as observed through linear methods, which implies an improvement in the autonomic modulation of HR and a satisfactory prognosis39.
hus, in general terms, the results of the present study show those patients from the CAD+ group, even after myocardial revascularization and the use of ACE inhibitors, present higher sympathetic autonomic modulation, suggesting that they may be more vulnerable to develop new cardiovascular events.
Limitations
his study was limited by the diiculty in selecting a sample that fulilled the proposed inclusion criteria, as well as by the heterogeneity of the patient sample. Due to such factors, myo-cardial infarction and revascularization inluenced the results.
Clinical and practical implications
he results of this study demonstrate that in CAD patients there is a reduction in the complexity of cardiovascular regula-tion due to a reducregula-tion in autonomic vagal modularegula-tion and an increase in sympathetic autonomic modulation. hus, evalu-ating the autonomic modulation of HR by SE and symbolic analysis contributes to the identiication of alterations in HR autonomic modulation and could provide useful clinical infor-mation without the need for additional sophisticated analysis. Furthermore, HRV analysis becomes relevant for both early screening and risk stratiication for heart disease as well as for the clinical follow-up of patients who are known to have CAD.
Furthermore, the objective of introducing HRV analysis by means of SE and symbolic analysis is to encourage the use of this non-invasive technique in the area of cardiac re-habilitation, making it possible to evaluate and reevaluate HR autonomic modulation before and after physical therapy interventions.
Conclusions
In uncomplicated CAD+, the patterns of HRV presented lower complexity of HR autonomic modulation, higher sympa-thetic modulation and lower parasympasympa-thetic modulation in
basal conditions. hese results indicate that autonomic heart dysfunction is associated with the severity of coronary occlu-sion. However, this issue requires further studies with larger patient populations.
Acknowledgements
To Dr. Alberto Porta for providing program analysis of SE and symbolic analysis. his work was supported by the Con-selho Nacional de Desenvolvimento Cientíico e Tecnológico
(579408/2008-6 and 308348/2009-5) and Coordenação de Aper-feiçoamento de Pessoal de Nível Superior (0021058210).
References
1. Mussalo H, Vanninen E, Ikäheimo R, Laitinen T, Laakso M, Länsimies E, et al. Heart rate variability and its determinants in patients with severe or mild essential hypertension. Clin Physiol. 2001;21(5):594-604.
2. Pehlivanidis AN, Athyros VG, Demitriadis DS, Papageorgiou AA, Bouloukos VJ, Kontopoulos AG. Heart rate variability after long-term treatment with atorvastatin in hypercholesterolaemic patients with or without coronary artery disease. Atherosclerosis. 2001;157(2):463-9.
3. Vaccarino V, Lampert R, Bremner JD, Lee F, Su S, Maisano C, et al. Depressive symptoms and heart rate variability: evidence for a shared genetic substrate in a study of twins. Psychosom Med. 2008;70(6):628-36.
4. Huikuri HV, Jokinen V, Syvänne M, Nieminen MS, Airaksinen KE, Ikäheimo MJ, et al. Heart rate variability and progression of coronary atherosclerosis. Arterioscler Thromb Vasc Biol. 1999;19(8):1979-85.
5. Akselrod S, Gordon D, Ubel FA, Shannon DC, Berger AC, Cohen RJ. Power spectrum analysis of heart rate fluctuation: a quantitative probe of beat-to-beat cardiovascular control. Science. 1981;213(4504):220-2.
6. Liao D, Cai J, Rosamond WD, Barnes RW, Hutchinson RG, Whitsel EA, et al. Cardiac autonomic function and incident coronary heart disease: a population-based case-cohort study. Am J Epidemiol. 1997;145(8):696-706.
7. Tsuji H, Larson MG, Venditti FJ Jr, Manders ES, Evans JC, Feldman CL, et al. Impact of reduced heart rate variability on risk for cardiac events. The Framingham Heart Study. Circulation. 1996;94(11):2850-5.
8. Kleiger RE, Miller P, Bigger JT Jr, Moss AJ. Decreased heart rate variability and its association with increased mortality after acute myocardial infarction. Am J Cardiol. 1987;59(4):256-62.
9. Huikuri HV, Mäkikallio TH. Heart rate variability in ischemic heart disease. Auton Neurosci. 2001;90(1-2):95-101.
10. Wennerblom B, Lurje L, Tygesen H, Vahisalo R, Hjalmarson A. Patients with uncomplicated coronary artery disease have reduced heart rate variability mainly affecting vagal tone. Heart. 2000;83(3):290-4.
11. Bigger JT Jr, Fleiss JL, Steinman RC, Rolnitzky LM, Kleiger RE, Rottman JN. Frequency domain measures of heart period variability and mortality after myocardial infarction. Circulation. 1992;85:164-71.
12. Heart rate variability: standards of measurement, physiological interpretation and clinical use. Task Force of the European Society of Cardiology and the North American Society of Pacing and Electrophysiology. Circulation. 1996;93(5):1043-65.
13. Novais LD, Sakabe DI, Takahashi ACM, Gongora H, Taciro C, Martins LEB, et al. Avaliação da variabilidade da frequência cardíaca em repouso de homens saudáveis, sedentários e hipertensos e de coronariopatas em treinamento físico. Rev Bras Fisioter. 2004;8(3):207-13.
14. Signorini MG, Marchetti F, Cerutti S. Applying nonlinear noise reduction in the analysis of heart rate variability. IEEE Eng Med Biol Mag. 2001;20(2):59-68.
15. Goldberger AL, Amaral LA, Glass L, Hausdorff JM, Ivanov PC, Mark RG, et al. PhysioBank, Physio Toolkit, and PhysioNet: components of a new research resource for complex physiologic signals. Circulation. 2000;101(23):E215-20.
16. Freitas U, Roulin E, Muir JF, Letellier C. Identifying chaos from heart rate: the right task? Chaos. 2009;19(2):028505.
17. Porta A, Di Rienzo MD, Wessel N, Kurths J. Addressing the complexity of cardiovascular regulation. Philos Transact A Math Phys Eng Sci. 2009;367(1892):1215-8.
18. Porta A, Guzzetti S, Montano N, Furlan R, Pagani M, Malliani A, et al. Entropy, entropy rate, and pattern classification as tools to typify complexity in short heart period variability series. IEEE Trans Biomed Eng. 2001;48(11):1282-91.
19. Guzzetti S, Borroni E, Garbelli PE, Ceriani E, Bella PD, Montano N, et al. Symbolic dynamics of heart rate variability: a probe to investigate cardiac autonomic modulation. Circulation. 2005;112(4):465-70.
20. Iglesias R, Jha P, Pinto M, Silva VLC, Godinho J. Controle do tabagismo no Brasil. Washingtoin, DC: Banco Mundial; 2007.
21. Gaziano JM, Hennekens C. Royal colleges’ advice on alcohol consumption: maintaining existing limits seems justified on current evidence. BMJ. 1995;311(6996):3-4.
22. Hallal PC, Victora CG. Reliability and validity of the International Physical Activity Questionnaire (IPAQ). Med Sci Sports Exerc. 2004;36(3):556.
23. Mion Jr D, Kohlmann Jr O, Machado CA, Amodeo C, Gomes MAM, Praxedes JN, et al. V Diretrizes brasileiras de hipertensão arterial. Arq Bras Cardiol. 2007;89(3):e24-79.
24. Diretrizes de doença coronariana crônica angina estável. Arq Bras Cardiol. 2004;83 Supl II:1-43.
25. Gamelin FX, Berthoin S, Bosquet L. Validity of the polar S810 heart rate monitor to measure R-R intervals at rest. Med Sci Sports Exerc. 2006;38(5):887-93.
26. Takahashi ACM, Porta A, Melo RC, Quitério RJ, da Silva E, Borghi-Silva A, et al. Aging reduces complexity of heart rate variability assessed by conditional entropy and symbolic analysis. Intern Emerg Med. 2011; DOI: 10.1007/s11739-011-0512-z.
27. Voss A, Kurths J, Kleiner HJ, Witt A, Wessel N, Saparin P, et al. The application of methods of non-linear dynamics for the improved and predictive recognition of patients threatened by sudden cardiac death. Cardiovasc Res. 1996;31(3):419-33.
28. Maestri R, Pinna GD, Accardo A, Allegrini P, Balocchi R, D’Addio G, et al. Nonlinear indices of heart rate variability in chronic heart failure patients: redundancy and comparative clinical value. J Cardiovasc Electrophysiol. 2007;18(4):425-33.
29. Porta A, Tobaldini E, Guzzetti S, Furlan R, Montano N, Gnecchi-Ruscone T. Assessment of cardiac autonomic modulation during graded head-up tilt by symbolic analysis of heart rate variability. Am J Physiol Heart Circ Physiol. 2007;293(1):H702-8.
30. La Rovere MT, Bigger JT Jr, Marcus FI, Mortara A, Schwartz PJ. Baroreflex sensitivity and heart-rate variability in prediction of total cardiac mortality after myocardial infarction. ATRAMI (Autonomic Tone and Reflexes After Myocardial Infarction) Investigators. Lancet 1998;351(9101): 478-84.
31. Kuo CD, Chen GY. Comparison of three recumbent positions on vagal and sympathetic modulation using spectral heart rate variability in patients with coronary artery disease. Am J Cardiol. 1998;81(4):392-6.
32. Abildstrom SZ, Jensen BT, Agner E, Torp-Pedersen C, Nyvad O, Wachtell K, et al. Heart rate versus heart rate variability in risk prediction after myocardial infarction. J Cardiovasc Electrophysiol. 2003;14(2):168-73.
33. Binkley PF, Orsinelli DA, Nunziata E, Patterson SP, Khot UN, Puri R, et al. Differing autonomic response to dobutamine in the presence and absence of ischemia: implications for the autonomic contribution to positive inotropic intervention. Am Heart J. 1995;130(5): 1054-61.
34. Kleiger RE, Stein PK, Bosner MS, Rottman JN. Time domain measurements of heart rate variability. Cardiol Clin. 1992;10(3):487-98.
35. Perkiömäki JS, Hämekoski S, Junttila MJ, Jokinen V, Tapanainen J, Huikuri HV. Predictors of long-term risk for heart failure hospitalization after acute myocardial infarction. Ann Noninvasive Electrocardiol. 2010;15(3):250-8.
36. Santangeli P, Sgueglia GA, Sestito A, Lamendola P, Mariani L, Infusino F, et al. Different effect of percutaneous and surgical coronary revascularization on cardiac autonomic function and inflammation in patients with stable angina. Int J Cardiol. 2008;127(2):269-70.
37. Laitio TT, Huikuri HV, Koskenvuo J, Jalonen J, Mäkikallio TH, Helenius H, et al. Long-term alterations of heart rate dynamics after coronary artery bypass graft surgery. Anesth Analg. 2006;102(4):1026-31.
38. Dibner-Dunlap ME, Smith ML, Kinugawa T, Thames MD. Enalaprilat augments arterial and cardiopulmonary baroreflex control of sympathetic nerve activity in patients with heart failure. J Am Coll Cardiol. 1996;27(2):358-64.
39. Lewandowski J, Abramczyk P, Dobosiewicz A, Bidiuk J, Sinski M, Gaciong Z. The effect of enalapril and telmisartan on clinical and biochemical indices of sympathetic activity in hypertensive patients. Clin Exp Hypertens. 2008;30(5):423-32.