Article
0103 - 5053 $6.00+0.00*e-mail: hpaula@ufc.br
Lippia sidoides
Essential Oil Encapsulation by Angico Gum/Chitosan Nanoparticles
Haroldo C. B. Paula,*,a Fernanda M. Sombra,a Flávia O. M. S Abreua and Regina C. M. de Paulab
aDepartamento de Química Analítica e Físico-Química, Universidade Federal do Ceará,
60451-970 Fortaleza-CE, Brazil
bDepartamento de Química Orgânica e Inorgânica, Universidade Federal do Ceará,
60455-760 Fortaleza-CE, Brazil
Nanoparticulas de quitosana (CH) e goma do angico (AG), dopadas com óleo essencial de
Lippia sidoides (Ls) foram preparadas e caracterizadas em relação às suas composições, distribuição
de tamanho de partículas, estabilidade térmica, bem como as liberações in vitro e in vivo. Os dados
obtidos revelaram que as nanopartículas preparadas usando razões Ls:AG variando de 1:2 a 1:20, apresentaram dopagens na faixa de 3,3 a 7,7%, com eiciência de encapsulação entre 16,0 e 77,8%. Os tamanhos de partículas icaram na faixa de 10-60 nm, com distribuições independentes do teor de óleo incorporado. FTIR revelou a presença de timol, principal componente de Ls. Análises de TGA e DSC mostraram que a incorporação de óleo na matriz resulta em nanopartículas de menor estabilidade térmica. A amostra Ls:AG = 1:10 apresentou um peril de liberação in vitro mais lento que as demais, exibindo, porém, nos bioensaios, uma maior mortalidade larval.
Chitosan (CH) and angico gum (AG) nanoparticles were loaded with essential oil, Lippia sidoides (Ls), being characterized according to their composition, size distribution, Ls:polymer
ratio, thermal stability and in vitro and in vivo controlled release. Nanoparticles prepared using Ls:AG ratios of 1:2 to 1:20 had loading values of 3.3 to 7.7%, with encapsulation eficiencies in the range of 16.0 to 77.8%. Particle sizes were in the range of 10-60 nm and size distributions were independent of Ls content, for different Ls:AG ratios. Infrared spectroscopy revealed the presence of thymol in the nanoparticles. TGA and DSC revealed that the degradation temperature of AG-CH nanoparticles decreased with an increase in Ls content. Controlled-release data showed a slower release proile for samples with Ls:AG = 1:10 than for the other samples. Bioassays showed that sample Ls:AG = 1:10 has a greater larvicidal effect, with 85 ± 3% mortality.
Keywords: nanoparticles, chitosan, angico gum, essential oil, encapsulation
Introduction
Nanotechnology is currently a very important area of science, mainly due to its widespread application in a broad range of subjects including engineering, medicine, chemistry and biology. The exploitation of biopolymers such as polysaccharides in nanotechnology is receiving increasing interest, being the focus of investigations by scientists all around the world.1-3
Chitosan (CH) is a polysaccharide originated from chitin composed of glucosamine and acetylglucosamine units. Its biocompatible and biodegradable nature is responsible for its widespread use in the biomedical area, particularly as an encapsulating agent or for controlled release of a
myriad of active compounds.4-11 Chitosan has also been
used for the encapsulation of drugs such as clotrimazol and econazol,12 and indomethacin, through tripolyphosphate
and genipin crosslinking,13 as antigens and vaccines14 as
well as adsorbent for the herbicide triluralin.15 Angico
gum (AG) is a branched polysaccharide, obtained from exudates of Anadenanthera macrocarpa trees
(“angico” tree), being composed of arabinose, galactose, rhamnose and glucuronic acid.16 AG carboxymethylated
derivatives have been prepared17 with different degrees of
substitution, as well as nanoparticles of AG and chitosan using different gum:chitosan ratios, and their solution properties were fully characterized.18 Lippia sidoides
fungicidal and bactericidal activity.19 It has also been
demonstrated that this oil has a larvicidal effect against larvae of Aedes or Stegomyiaaegypti,20 the dengue vector
which is responsible for many diseases, and even deaths, in tropical countries such as Brazil. Although having widespread use as controlled-release systems in medicine and pharmacy, nanoparticles have found little usage in agriculture, particularly as carriers for pesticides.21-23 In
another approach, a new chitosan/alginate-based matrix for biodegradable pesticide release has been reported.23 In
a previous study, chitosan/cashew gum microspheres were developed for encapsulation of DDVP (dimethyldivinyl chloride phosphate) aiming at larvae control.24 This paper
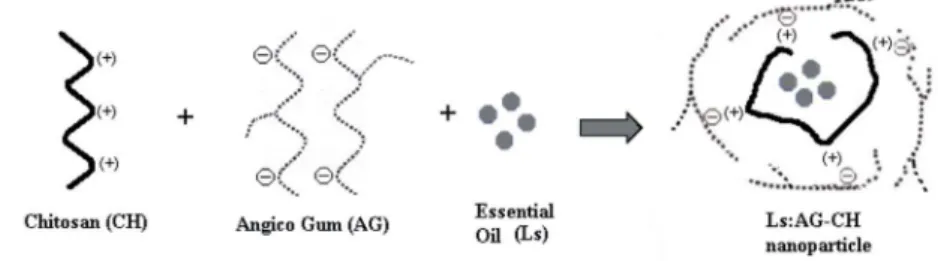
reports on the nanoencapsulation of Ls by spray drying of an emulsiied coacervate, the characterization of resulting angico gum/chitosan nanoparticles (AG-CH NPs) loaded with Ls, as well as on the investigation of their in vitro and in vivo release proiles.
Experimental
Materials
Chitosan samples were donated by a local company (deacetylation degree 82%, Mv = 1.8×10⁵ g mol-1).
Angico gum (Mw = 3.7×10⁶ g mol-1) was collected from
A. macrocarpa native trees in Fortaleza, Ceará, Brazil. It
was puriied using a previously described method.16 Briely,
nodules free of bark were selected and dissolved in distilled water at room temperature to give a 5% (m/v) solution. The solution pH was adjusted to 7.0 by addition of diluted aqueous NaOH. The clear solution was iltered through sintered glass and the puriied polysaccharide precipitated with ethanol, after NaCl addition. Lippia Sidoides essential
oil (Produtos Naturais LTDA-PRONAT, Horizonte, CE) and the surfactant Tween (VETEC-São Paulo, Brazil) were used as received.
AG-CH nanoparticle preparation
AG-CH NPs were prepared by the method previously described by Oliveira et al.,18 with some adaptations.
Solutions of CH at a concentration of 0.75 g L−1 were
prepared by dissolving the desired amount of chitosan in 1% acetic acid. The ionic strength was adjusted to 0.01 with NaCl. Solutions of AG at a concentration of 2.5 g L−1
were prepared by dissolving the gum in deionized water and the ionic strength was adjusted to 0.01 with NaCl. Solutions (CH and AG) were then iltered through a 0.22 μm Millipore ilter.
Polymer complexes were prepared in appropriate proportions, in order to obtain the desired AG:CH = 10:1 ratio, corresponding to a n+/n− = 1:10 molar ratio (molar charge ratio of CH and AG). The AG solution was added to the CH solution, using a peristaltic pump, under low stirring rate and the mixture was left to stand for 24 h. An emulsion was then prepared using Ls and Tween, with different Ls:AG ratios (1:2, 1:4, 1:10, and 1:20), followed by slow addition to the previous mixture solution. The turbid solution was then spray-dried using a Buchi B290 spray dryer, operating at inlet temperature 160 ºC, outlet temperature 70 ºC, pump feed low 5 mL min-1, air
volume low 35 m3 h-1, and aspirator low 84 L h-1. Figure 1
shows the schematic representation of the Ls:AG-CH nanoparticles.
Nanoparticle characterization
AG-CH NPs were characterized by Fourier transform infrared spectroscopy (FTIR) using a Shimadzu IR spectrophotometer (model 8300) operating between 400 and 4000 cm−1. The particle size distribution and zeta
potential were determined in a Malvern Nano Zetasizer, model Zen 3500. Thermal analysis of the NPs was carried out by thermogravimetric analysis (TGA) in a Shimadzu analyzer, model TAG-50, in nitrogen atmosphere applying a heating rate of 10 ºC min-1, from 25 ºC to 900 ºC,
and by differential scanning calorimetry (DSC) in a Shimadzu DSC-50, with a heating rate of 10 ºC min-1,
from 25 to 400 °C.
Essential oil loading was determined by UV-Vis spectroscopy, at 260 nm, in a MICRONAL-Brazil spectrometer (model B582) as follows: a 10 mg sample was crushed in ethanol and its concentration was calculated
with the use of a calibration curve (equation 1) obtained from samples of pure thymol within a certain concentration range. All analysis was carried out in duplicate.
Abs. = 0.02496 + 0.00179 conc. R2 = 0.992 (1)
where Abs. is the absorbance and conc. is the thymol concentration, given in ppm.
Ls encapsulation eficiency (EE) was determined using the following equation:
EE% = M / Mo × 100 (2)
where M is the amount of Ls in the loaded sample, as determined from equation 1 and Mo is the initial Ls amount added to the emulsion.
Samples were also analyzed by gas chromatography (GC), on a SHIMADZU (GC-17A) instrument with a lame ionization detector and a capillary column (DB-5) 30 m × 0.25 mm × 0.25 μm, using injection and detector temperatures of 250 ºC, hydrogen as the carrier gas and a sample injection volume of 1 μL.
In vitro kinetics release
The larvicide in vitro release kinetics was determined
by UV-Vis spectroscopy, where 100 mg samples (AG:CH samples, with different Ls:AG ratios) were dissolved in 10 mL of water and placed in a dialysis bag (molecular weight cut off 14 kDa) which was kept in a beaker containing 100 mL of water. The whole system was kept in a thermostatic bath at 25 ºC, under constant stirring. At certain time intervals, 3.0 mL of sample were withdrawn and analyzed by UV-Vis. All measurements were carried out in duplicate and the data averaged.
Bioassays
In vivo experiments were carried out employing
usual procedures, in order to verify the eficacy of the Ls controlled release. A certain mass of NPs (50 mg) was placed in a 50 mL Becker containing 20 third instar
St. Aegypti larvae which were provided by the Ceará
State Health Secretary. Larvae manipulation was carried out following the Health Secretary rules and procedures. Larvae population was then determined after 24, 48 and 72 h by counting dead specimens which were subsequently removed. A control (blank) sample was used with the same nanoparticle composition and larvae number, however, with no Ls present. All experiments were carried out in duplicate and the data averaged.
Results and Discussion
AG-CH NPs were prepared with the same CH/AG charge ratio (n+/n− = 1:10) but using different Ls:AG ratios, aiming to optimize the loading. The above charge ratio was chosen due to the good particle stability and properties reported elsewhere.18 Table 1 shows the characteristics and
related properties of the AG-CH NPs. Due to the fact that the samples were isolated by spray drying, recovery yields varied from 30.4 to 61.1%, resulting in an average yield of 50%, which can be considered satisfactory. On decreasing the Ls:AG ratio from 1:2 to 1:20 the encapsulation eficiency increases, reaching a maximum at 77.8%. The Ls:AG-CH 1:20 sample exhibits a lower Ls loading value and a satisfactory encapsulation eficiency (around 70%). It can be concluded that the sample with Ls:AG-CH 1:10 presents the best parameters for the biolarvicide encapsulation by AG-CH NPs, with 6.5% of loading and 77.8% of encapsulation eficiency. These values are in agreement with those found by Fernandes et al.,25 where
the encapsulation of Ls by cyclodextrin resulted in loading values of 5.6%. Other authors have reported similar loading values for the encapsulation of pesticides using biopolymers as matrices, with microspheres based on cellulose derivatives loaded with a commercial herbicide presented loading values in the range of 8-11%,26 while
alginate beads loaded with a natural pesticide Neem (Azadirachta Indica A. Juss) showed loading values of 10
to 30%.21
Zeta potential and particle size
measurements. Angico gum seem to be able to aggregate and take a spheroidal shape so that CH can be located at the core,17,18 providing a hydrophobic environment which
is ultimately responsible for Ls incorporation, which seems to occur during spray drying.
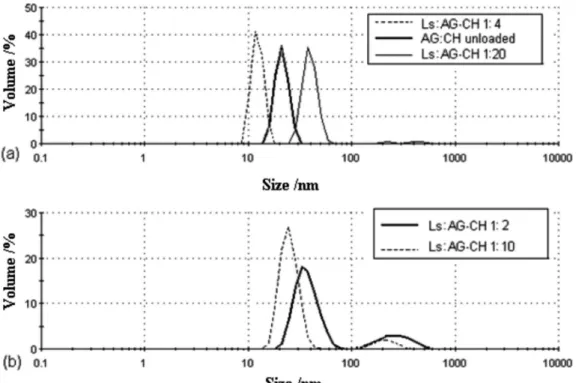
A trend can be observed for AG-CH particle size, where on increasing the Ls content in the initial emulsion larger particle were obtained, with values ranging from 18.7 nm to 37.2 nm. A likely explanation is that the increase in the oil proportion in the emulsion leads to a reduction in the AG-CH interactions, leading to higher nanoparticle sizes. Similar behavior was reported by Papadimitriou et al.,27
where the particle size of the chitosan nanoparticles was found to be drug-dependent, and with increased loading
the NPs presented a larger size compared with the blank (non-loaded) samples.
The relative charges beyond the hydrodynamically stagnant layer were determined by zeta potential measurements, for AG-CH NPs. As seen in Table 1, unloaded and loaded NPs presented negative zeta potential, with values ranging from −14 to −21 mV, which seems to
corroborate the fact that AG carboxylic groups appear to be located in the particle outer shell, and therefore CH and Ls are located in the particle core. Similar behavior was found for chitosan/dextran sulfate (DS) particles loaded with amphotericin B, where the zeta potential of all formulations was in the range of −27 to −37 mV suggesting that the free
sulfate groups of DS were located on the particle surface.28
Table 1. AG:CH nanoparticle characteristics and related properties
Sample Ls:AG Ratio Yield / % Loading / % EE / % Zeta Potential / mV Particle size / nm PDI
AG-CH unloaded
--- 60 --- --- –16.8 ± 0.2 19.6 ± 1.9 (97%)
80.2 ± 3.0 (3%)
0.516 ± 0.04
Ls:AG-CH 1:2 (1:2) 42.2 5.3 ± 0.3 16.0 –21.3 ± 0.4 37.2 ± 5.4 (82%)
271 ± 53 (18%)
0.629 ± 0.03
Ls:AG-CH 1:4 (1:4) 30.4 5.2 ± 0.3 20.8 –19.1 ± 0.3 12 ± 2.3 (98%)
223 ± 37 (2%)
1.0 ± 0.05
Ls:AG-CH 1:10 (1:10) 61.1 6.5 ± 1.0 77.8 –17.3 ±1.5 25 ± 8.7 (91%)
213 ± 41 (9%)
0.370 ± 0.06
Ls:AG-CH 1:20 (1:20) 52.6 3.3 ± 0.1 69.3 –14.7 ± 0.6 18.7 ± 3.2 (98%)
139 ± 35 (2%)
0.330 ± 0.05
FTIR spectroscopy
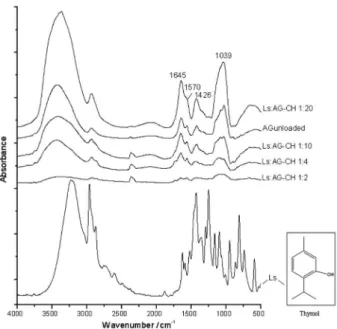
The structural characterization obtained by FTIR spectroscopy for loaded and unloaded NPs is shown in Figure 3. All the samples presented AG absorption bands corresponding to carboxylic ion axial stretching at 1426 cm-1
and C–O–O bond stretching at 1645 cm-1. Also, as reported
by Lawrie et al.,29 the CH symmetric and asymmetric
amino stretching bands are shown at 1645 cm-1 and
1570 cm-1, respectively, and are overlapped with the main
AG vibration modes. The vibration modes of Ls groups, particularly those of stretching of the C=C aromatic groups of thymol, at 1622 cm-1, 1421 cm-1, and around 1100 cm-1,
were overlapped with the main AG and CH bands; however, the presence of thymol can be detected through the increase in the intensities of the CH bands at 1574 cm-1.
Thermal stability
AG-CH NPs unloaded and loaded with Ls were evaluated by differential scanning calorimetry (DSC), and the data obtained can be seen in Figure 4. AG-CH showed an endothermic peak at 144 °C, corresponding to water evaporation and an exothermic peak at 297 °C, due to decomposition processes. Kittur et al.30 compared the
thermal behavior of chitosan and its derivatives, reporting that the displacement of the endothermic peak is associated with the holding capacity and strength of the water-polymer interaction. In this case, the presence of hydrophilic groups favors the binding of water molecules to the polymer network, increasing the content of bound water. Loaded AG-CH
NPs in general presented lower temperatures (92-130 ºC) at the endothermic transition than unloaded ones, indicating a lower afinity between the polymers and water, maybe due to a higher interaction of the CH polymer chains with Ls oil. For a Lippia-cyclodextrin inclusion complex,
loss of adsorbed water has been detected at 105 °C.25
Ls:AG-CH NPs thermograms also revealed clear evidence of a shifting in the polymer degradation temperatures towards lower values, with the increase in the oil proportion in the initial emulsion. This seems to indicate interaction between the CH and Ls molecules, which ultimately leads to a decrease in the AG-CH thermal stability. This feature was also observed in a study on Lippia-cyclodextrin
inclusion complexes,25 where the guest molecule seemed to
lead to the formation of complexes with different thermal stabilities, below the polymer decomposition temperatures.
The thermogravimetric curves of AG-CH NPs are displayed in Figure 5. Samples loaded with Ls exhibit similar degradation proiles, which are different from the unloaded samples. Their thermograms exhibit three main decomposition events. Table 2 shows the TGA peak temperature and residual mass for AG-CH NPs. As previously reported,31,32 gum decomposition occurs in three
stages, the irst being attributed to desorption of moisture, and the second and third stages to decomposition, probably due to depolymerization with the formation of water, CO, and CH4. The initial mass loss occurred in the range from 41 to 54 ºC, corresponding to water evaporation. There is then a further mass loss at 272 ºC and a third mass loss at 507 ºC. Samples of Ls:AG-CH 1:10 presented the most noticeable change in the dTG of the third event, likely due to the fact that it presents highest EE and loading. This seems to indicate to a weakening of the AG-CH interaction, leading to a less stable nanoparticle. Moreover, the residual mass of this sample is the highest, which means that it exhibits a low level of thermal degradation, in comparison Figure 3. Infrared spectra of thymol, unloaded and loaded AG-CH NPs
with Ls:AG-CH ratios of 1:20, 1:10, 1:4 and 1:2.
to the blank AG-CH nanoparticle. These indings are in good agreement with the results reported by Fernandes et al.33 as discussed above.
In vitro release
In vitro kinetic studies on samples of Ls:AG-CH 1:10
and Ls:AG-CH 1:20 were performed, and the results are
shown in Figure 6. The release proiles of the NPs indicate that the encapsulation of Ls was successful and the system can effectively sustain Ls release under the test conditions. Sustained release is important due to the increase in the availability, prolonging the larvicide effect. In the irst ive hours, in vitro release was similar for Ls:AG-CH 1:10 and
Ls:AG-CH 1:20. However, after 24 h, it is observed that sample Ls:AG-CH 1:10 showed a slower release proile than Ls:AG-CH 1:20, resulting in 26.7% and 52.6% of the oil being released, respectively.
The release proile was determined using equation 3:
Mt /M
∞= K t
n (3)
where Mt/M
∞ denotes the fraction of drug released, t is the
release time, and K represents a constant characteristic of the system. The diffusion exponent (n) is an indication of the mechanism of drug release and its value is dependent on the geometry of the release device. A plot of ln Mt/M
∞
against ln t provides a linear equation (equation 4) where nis the angular coeficient and K is the linear coeficient. Table 3 shows the data obtained.
ln Mt/M∞= ln K + n ln t (4)
In both cases the nexponent was equal to 1.1, which corresponds to non-Fickian behavior (case II transport), where the release can be associated with a relaxation Figure 5. TGA analysis (a) and dTG (b) for AG-CH NPs unloaded and
loaded with Ls.
Table 2. TGA peak temperature and residual mass for unloaded and loaded
AG-CH NPs with Ls:AG-CH ratios of 1:20, 1:10, 1:4 and 1:2
Sample Events dTG / °C mass / %Residual
AG-CH 1º 41 9.0
2º 272 43.2
3º 507 17.2
Residual mass at 800 ºC 27.4
Ls:AG-CH 1:20 1º 41 9.2
2º 272 43.2
3º 507 17.1
Residual mass at 800 ºC 27.5
Ls:AG-CH 1:10 1º 54 8.9
2º 273 39.8
3º 460 17.1
Residual mass at 800 ºC 32.2
Ls:AG-CH 1:4 1º 44 14.9
2º 267 44.9
3º 502 16.7
Residual mass at 800 ºC 22.3
Ls:AG-CH 1:2 1º 46 8.8
2º 274 46.9
3º 491 13.3
Residual mass at 800 ºC 27.3
Figure 6. In vitro release proile for AG-CH NPs loaded with Ls with
relative ratios of Ls:AG-CH 1:20 () and 1:10 ().
Table 3. Parameters for release kinetics of AG-CH NPs with Ls:AG-CH ratios of 1:20 and 1:10
Sample Release kinetic parameters
k n R2
Ls:AG 1:10 0.0620 1.10 0.9996
constant. This result is in agreement with those of similar studies,34 where the authors found n values of 0.74 to 0.94
for alginate beads crosslinked with glutaraldehyde, while others22 found that the diffusion coeficient increases from
0.46 to 0.78, indicating a change in the transport mechanism from Fickian to non-Fickian, following an increase in the crosslinker density in beads made from guar gum and polyacrylamide.
Bioassay
AG-CH NPs loaded with Ls were evaluated with respect to their mortality kinetics against St. aegypti larvae, and
the results are shown in Figure 7. It can be seen that the increase in the larval mortality was proportional to the loading. The sample Ls:AG-CH 1:10 showed the highest loading (6.5%) and consequently the highest mortality, with 85 ± 3% after 24 h and 92 ± 2% after 48 h. Sample Ls:AG-CH 1:20 showed 52 ± 3% and 60 ± 3% mortality after 24 and 48 h, respectively, probably due to the lower loading (3.3%). A 50 mg sample of NPs has a corresponding Ls concentration of 63 and 34 ppm for Ls:AG-CH = 1:10 and Ls:AG-CH = 1:20 ratios, respectively. Considering that 36 ppm is the LC 50 (lethal concentration for 50% mortality) of the free Ls oil, the Ls encapsulated inside the beads maintains the larvicide effect and reaches mortality rates compatible with that obtained by the pure Ls oil, generating good larval control for up to 3 days.
Conclusions
The nanoencapsulation of Ls by spray drying of an emulsiied coacervate and its subsequent release were investigated using various compositions of essential oil and matrix components (Ls:AG-CH). The loading and encapsulation eficiency of Ls were optimized at values
of 6.7 and 77%, respectively, for the Ls:AG-CH 1:10 sample. The NP sizes ranged from 10 to 60 nm, exhibiting similar distribution proiles, independently of Ls inclusion. AG-CH NPs presented negative zeta potential values, probably due to the presence of the AG carboxylic acid group in its structure. In vitro release proiles revealed
markedly non-Fickian behavior, and showed prolonged release for the samples Ls:AG-CH 1:10 and 1:20. The thermal analysis showed clear evidence of a shift in the degradation temperature towards lower values with an increase in the Ls content in the NPs, which indicated some kind of interaction between the CH and Ls molecules. The AG-CH NPs loaded with Ls presented a larvicide effect, where the mortality rate increased according to the Ls loading. In particular, the sample Ls:AG-CH 1:10 showed 85 and 92% of mortality after 24 and 48 h, respectively. These results showed that the AG-CH NPs were successfully produced and represent a promising tool for dengue control.
Acknowledgments
The authors are grateful to the Brazilian Governmental Founding Agencies CNPq and CAPES for inancial support.
References
1. Chairam, S.; Poolperm, C.; Somsook, E.; Carbohydr. Polym.
2009, 75, 694.
2. Kim, H. W., Kim, B. R; Rhee, Y. H.; Carbohydr. Polym. 2010,
79, 1057.
3. Silva, A. R.; Zaniquelli, M. E. D.; Baratti, M. O.; Jorge, R. A.;
J. Braz. Chem. Soc. 2010, 21, 214.
4. Gao, Y.; Xu, Z.; Chen, S.;Gu, W.; Chen, L.; Li, Y.; Int. J. Pharm.
2008, 359, 241.
5. Huang, H.; Yang, X. Carbohydr. Res. 2004, 339, 2627.
6. Sarmento, B.; Ribeiro, A., Veiga, F.; Ferreira, D.; Colloids Surf., B2006, 53, 193.
7. Sarmento, B.; Ferreira, D.; Jorgensen, L.; van de Weert, M.;
Eur. J. Pharm. Biopharm.2007, 65, 10.
8. Gan, Q.; Wang, T.; Cochrane, C.; McCarron, P.; Colloids Surf., B2005, 44 65.
9. He, X.; Yuan, R.; Chai, Y.; Shi, Y.; J. Biochem. Biophys. Methods
2008, 70, 823.
10. Nam, H. Y.; Kwon, S. M.; Chung, H.; Lee, S. Y.; Kwon, S. H.; Jeong, H.; Kim, Y; Park, J. H.; Kim, J.; Her, S.; Oh, Y.K.; Kwon, I. C.; Kim, K. S.; Jeong, Y.; J. Controlled Release 2009, 135, 259.
11. Tan, Y. L.; Liu, C. G.; Colloids Surf., B2009, 69, 178. 12. Pandey, R.; Ahmad, Z.; Sharma, S.; Khuller, G. K.; Int. J.
Pharm. 2005, 301, 268.
13. Mi, F. L.; Kuan, C. Y.; Shyu, S. S.; Lee, S. T.; Chang, S. F.;
Carbohydr. Polym. 2000, 41, 389.
14. Borges, O.; Borchard, G.; Verhoef, J.C.; de Sousa, A.; Jungingeret, H. E.; Int. J. Pharm.2005, 299, 155.
15. Melo, A. M. S.; Valentim, I. B.; Goulart, M. O. F.; Abreu, F. C.;
J. Braz. Chem. Soc.2008, 19, 704.
16. Paula, R. C. M.; Budd, P. M; Rodrigues, J. F.; Polym. Int.1997,
44, 55.
17. Oliveira, M. A.; Silva, D. A.; Uchoa, D. E.; Maciel, J. S.; Feitosa, J. P.; Paula, H. C. B.; Paula, R. C. M.; J. Appl. Polym. Sci.2007,
103, 2985.
18. Oliveira, M. A.; Ciarlini, P. C.; Feitosa, J. P. A.; de Paula, R. C. M.; Paula, H. C. B.; Mater. Sci. Eng., C2009, 29, 448. 19. Camurça-Vasconcelos, A. L. F.; Bevilaqua, C. M. L; Morais, S.
M.; Maciel, M. V.; Costa, C. T. C.; Macedo, I. T. F.; Oliveira, L. M. B.; Braga, R. R.; Silva, R. A.; Vieira, L. S.; Vet. Parasitol.
2007, 148, 288.
20. Carvalho, A. F. U.; Melo, V. M. M.; Craveiro, A. A.; Machado, M. I. L.; Bantim, M. B.; Rabelo, E. F.; Mem. Inst. Oswaldo Cruz2003, 98, 569.
21. Kulkarni, A. R.; Soppimath, K. S.; Aminabhavi, T. M.; Mehta, M. H.; Dave, A. M.; J. Appl. Polym. Sci.1999, 73, 2437.
22. Soppirmath, K. S.; Aminabhavi, T. M.; Eur. J. Pharm. Biopharm. 1999, 53, 87.
23. Guan, H.; Chi, D.; Yu, J.; Li, X.; Pestic. Biochem. Physiol.2008,
92, 83.
24. Paula, H. C. B.; de Paula, R. C. M.; Bezerra, S. K. F. J. Appl. Polym. Sci.2006, 102, 395.
25. Fernandes, L. P.; Oliveira, W. P.; Sztatisz, J.; Szilagyi, I. M.; Moura,T. F.; Novák, Cs.; J. Therm. Anal. Calorim.2009, 95,
855.
26. El Bahri, Z.; Taverdet, J. L.; Polym. Bull. 2007, 59, 709.
27. Papadimitriou, S.; Bikiaris, D.; Avgoustakis, K.; Karavas, E.; Georgarakis, M.; Carbohydr. Polym. 2008, 73, 44.
28. Tiyaboonchai,W.; Limpeanch, N.; Int. J. Pharm. 2007, 329, 142.
29. Lawrie, G.; Keen, I.; Drew, B.; Chandler-Temple, A.; Rintoul, L.; Fredericks P.; Grøndahl, L.; Biomacromolecules2007, 8,
2533.
30. Kittur, F. S.; Prashanth, K. V. H.; Sankar, K. U.; Tharanathan, R. N.; Carbohydr. Polym.2002, 49, 185.
31. Maciel, J. S.; Silva, D. A.; Paula, H. C. B.; Paula, R. C. M.; Eur. Polym. J. 2006, 41, 2726.
32. da Silva, D. A.; Feitosa, J. P.A; Paula, H. C. B.; de Paula, R. C. M.; Mater. Sci. Eng., C 2009, 29, 437.
33. Fernandes, L. P.; Éhen, Zs.; Moura, T. F.; Novák, Cs. ; Sztatisz, J.; J. Therm. Anal. Calorim.2004, 78, 557.
34. Kulkarni, A. R.; Soppimath, K. S.; Aminabhavi, T. M.; Dave, A. M.; Mehta, M. H.; J. Controlled Release2000, 63, 97.
Submitted: May 25, 2010