Article
J. Braz. Chem. Soc., Vol. 22, No. 9, 1758-1764, 2011. Printed in Brazil - ©2011 Sociedade Brasileira de Química 0103 - 5053 $6.00+0.00
A
*e-mail: [email protected]
Analytical Methods in Photoelectrochemical Treatment of Phenol
Paulo R. M. Lopes, Renato N. Montagnolli and Ederio D. Bidoia*
Departamento de Bioquímica e Microbiologia, Instituto de Biociências, Universidade Estadual Paulista, Rio Claro-SP, Brazil
O presente estudo visou o tratamento de eluente simulado, contendo fenol por processos fotocatalítico e fotolítico com análise toxicológica das soluções fenólicas. Dois sistemas de tratamento foram propostos com radiação UV, eletrodos maciços e potencial elétrico. No primeiro sistema (S1), a concentração de fenol foi determinada por espectrofotometria direta em 269 nm e o segundo (S2) por meio do método fotométrico direto (4-aminoantipirina). Testes de toxicidade foram realizados com dois microrganismos: Escherichia coli e Saccharomyces cerevisiae. Os resultados de S1 demonstraram que conclusões errôneas podem ser retiradas em relação ao aumento de absorbância no pico do fenol de acordo com o tempo de tratamento. Contudo, o método fotométrico direto foi capaz de identiicar a redução do fenol em S2 e observou-se que os tratamentos propostos degradaram as moléculas de fenol em solução. Também, no tratamento com fonte ultravioleta de alta energia (UVC), a degradação fenólica deve-se principalmente à fotólise.
The aim of the study was to propose a treatment of simulated wastewater containing phenol by photocatalytic and photolytic processes and analyze the toxicity of these phenolic solutions. Two treatment systems were performed with UV radiation, solid electrodes and electric potential. In the irst system (S1) phenol concentration was determined by UV direct spectrophotometry (269 nm) and in the second (S2) by direct photometric method (4-aminoantipyrine). Toxicological tests were carried out using two microorganisms: Escherichia coli and Saccharomyces cerevisiae. S1 results showed that erroneous conclusions can be drawn by absorbance values increase at phenol peak. Nevertheless, direct photometric method was able to identify phenol reduction in S2 and the proposed treatments degraded phenol in solution. Also, in treatment using high energy ultraviolet radiation (UVC), the phenol degradation was mainly due to the photolytic process.
Keywords:phenol, photocatalysis, photolysis, TiO2, toxicity
Introduction
Industrial efluents are formed by a variety of substances such as organic and/or inorganic compounds, which can be highly dangerous when released improperly in environment. Among such wide range of pollutants, phenolic compounds have attracted attention due to their large number and diversity of species with a high deleterious potential in aquatic biota.1,2
Phenolic compounds contamination in drinking water is a serious public health problem. Their easy penetration into skin and cell membranes induces a food chain accumulation which leads to mutagenic and hepatotoxic effects, besides affecting reactions in photosynthesis and respiration processes.3
According to USEPA4 phenolic compounds are
persistent, bioaccumulative and potentially toxic when released in the environment. Furthermore, Wu and Zhou5
reported that even at low concentration these substances are toxic to biota. Hence proper treatment of phenolic efluents presents high importance in environmental protection.
The use of advanced technologies in catalytic oxidation has been consolidated during development of treatment systems for toxic and refractory compounds. Advanced oxidation processes (AOPs) are characterized by hydroxyl radicals (OH•) generation, responsible for oxidizing organic
compounds.6-8 Thus, heterogeneous photocatalysis appears
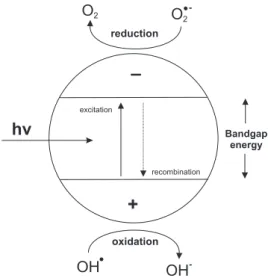
When TiO2 particles are irradiated by wavelengths
shorter than 390 nm (UV), an electron/hole pair (e−
/h+) is
formed, as demonstrated in Figure 1. Electrons are excited and move from valence band to conduction band. Thereby, valence band becomes positively charged owing to electron movement that creates a hole positively charged (h+). This
hole is able to promote water or hydroxide ion oxidation in semiconductor surface leading to hydroxyl radicals formation (highly oxidants). Also, electrons can bind to oxygen resulting in a superoxide ion.9
Still, the practical application of this technology has been limited due to some drawbacks mainly related to inal separation of TiO2 particles in suspension,10 and the low
quantum yield, which is usually less than 5%.11 Moreover,
in absence of electric ield, most e−
/h+ pairs recombine
(Figure 1), causing an over than 95% loss of light energy to heat.12
The application of a positive potential on the titanium electrode coated with TiO2 decreases its Fermi level (EF).
Thus, photogenerated electrons (e−
) are carried to the counter electrode and the holes (h+) remain on the TiO
2
surface due to the electronic drainage by the current. Therefore, applying an electric potential reduces the e−
/h+ pairs recombination. According to this, the formation
OH• radical increases when TiO
2 is irradiated by UV13 and
provides a higher eficiency in treatment process.14
It was demonstrated that phenolic wastes treated by AOPs undergo a partial degradation of molecule by opening aromatic ring into organic acids that are nutrients for microorganisms. Thereby, phenol partial degradation provides a low cost pretreatment for biological process.5
This study examined a phenol solution degradation by photolytic and photocatalytic methods evaluating the effect
of different operational parameters, such as solid electrodes coated with semiconductor oxides and electric potential. Both electric potential and ultraviolet lamp were with low power aiming to a low cost photocatalysis treatment.
Treatments were performed by using UVC and following electrodes: thermal (TiO2), commercial (CE)
and plastic (PE), in absence or in presence of electric potential (e). Furthermore, toxic potential of samples treated was investigated using two microorganisms as test organisms.
Experimental
Phenol solution
Phenol solution was prepared by diluting 0.100 g of phenol PA in 1.000 L of Milli-Q water (Millipore®) that
established an initial concentration (conc. phenol0) of
0.100 g L-1. It was added 2.000 g of sodium sulfate as
supporting electrolyte (2.000 g L-1 Na 2SO4).
Electrodes
Different electrodes were analyzed with same dimension: 0.050 m high, 0.050 m wide and 0.001 m thick.
Titanium electrode coated with titanium dioxide (TiO2)
Titanium electrode coated with a thin titanium dioxide (TiO2) film was formed after thermal treatment by a
metal plate base (Ti) and TiO2 ilm. It was used due to its
photocatalytic ability when irradiated by a UV source. The electrodes were sanded and washed with Milli-Q water and acetone before thermal treatment. Afterwards, Ti plate remained in preheated mufle furnace for 10 min at 750 ºC in air presence to the thermal titanium dioxide ilm formation.15 The thermal TiO
2 ilm prepared was about
2.50 µm thick.16,17
Commercial electrode (CE)
Commercial electrode (CE) supplied by De Nora17 was
composed by titanium base plate coated with titanium and ruthenium oxides (Ti/70%TiO2-30%RuO2).
This electrode has a high efficiency in organic compounds degradation by electrolysis in electrolytic treatments.8,19,20 However, it had not yet been studied for
the proposed system.
Plastic electrode coated with aluminum foil (PE)
Plastic electrode coated with aluminum foil (PE) was studied as a control experiment with no effect of electrode in phenol concentration.
Figure 1. e−/h+ pair formation in semiconductor surface under UV
Characterization of the electrodes
The thermal electrode prepared was analyzed using X-ray diffraction spectrometry. This technique was used to identify and characterize the formation of ilms of pure titanium dioxide (TiO2).
The characterization was performed using a SIEMENS® -
D5000-kristallolex model X-ray diffraction spectrometer, coupled to a texture goniometer and 40 kV, 30 mA copper tube.
Ultraviolet radiation
The UV radiation used in treatment system was originated from a germicidal lamp Starlux® 15 W with
emission spectrum in UVC range (100-290 nm). The use of lower wattage and more economical lamp becomes a viable option in photocatalytic oxidation treatment.
Figure 2 shows the UVC lamp emission spectrum, in which there are no deined emission bands. On the other hand, it can be observed emission peaks with a high intensity (λ
max) in 250 nm.
Determination of phenol concentration
Phenol quantiication was performed by UV direct spectrophotometry and direct photometric method. Both methodologies used spectrophotometer Shimadzu® - Model
2401 PC.
UV direct spectrophotometry (method 1)
First method analyzed 269 nm absorbance. This wavelength refers to the phenol absorbance peak and thus the more concentrated sample the greater the absorbance.21
Initially, standard samples with known phenol concentrations were prepared to obtain the following
equation: Abs269 = (0.01582×[phenol]) – 0.00189;
R = 0.9999.
Direct photometric method (method 2)
Method 2 was based on method D 5530 - Standard Methods for the Examination of Water and Wastewater,22
also used by Lathasree et al.23 Phenolic compounds reacts
with 4-aminoantipyrine at pH 7.9 ± 0.1 forming a brownish-orange compound. Subsequently sample absorbance was measured at 500 nm.
Similar to method 1 an equation involving phenol concentration and absorbance values was determined: Abs = (0.005315×[phenol]) + 0.00337; R = 0.9998.
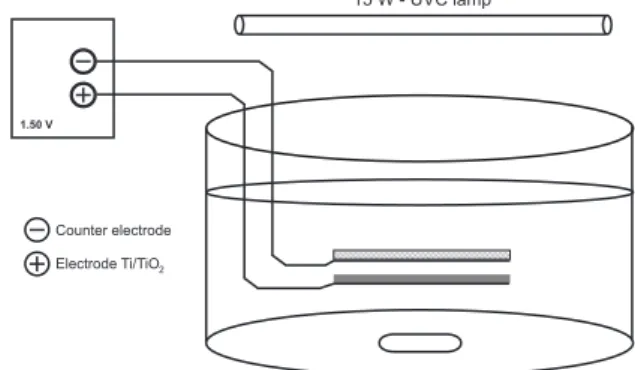
Treatment system
Treatment system components were: glass cell, UV lamp, working electrode, counter electrode, electric potential and magnetic stirrer (Figure 3).
The counter electrode corresponds to a 0.085 m diameter nickel mesh (Ni) only used when the potential was applied to TiO2 electrode. The counter electrode was
connected to negative pole in electric potential (cathode) and TiO2 to positive pole (anode).
The electric potential (e) used in treatment system was only a 1.500 V power supply – 200 mA and its utilization produces an electronic drainage in the anode. Moreover, it was used a UV lamp with emission spectrum in UVC range.
Phenol degradation was carried out in a batch reactor containing 0.240 L of phenol solution. UVC lamp was located above glass cell of 0.250 L and the electrodes were into phenol solution.
Assays composition
Two treatments were carried out with distinct methods of phenol concentration quantiication.
First treatment (T1) examined phenol degradation for 23 h by method 1 in three assays: lamp (UVC only),
Figure 2. Emission spectrum of UV lamp 15 W.
lamp-electrode (UVC + TiO2) and lamp-electrode-electric
potential (UVC + TiO2 + e). The sample measurements
were done in t0, t5 and t23 h and analyzed in duplicates. T2 was composed by UV radiation and three different working electrodes. The treatment was performed for 6 h and the determination of phenol concentration in solution used method 2. Thus, four assays were prepared: plastic electrode (UVC/PE), commercial electrode (UVC/CE), titanium electrode (UVC/TiO2) and titanium electrode
coupled to electric potential (UVC/TiO2 + e). The sample
measurements were done in t0, t1, t2, t3, t4, t5 and t6 h and analyzed in duplicates.
Toxicity tests
Toxicity tests used two different test organisms: Gram-negative eubacteria (Escherichia coli) and yeast (Saccharomyces cerevisiae). These different groups were chosen for toxicological analysis of phenol solutions based on their difference in cell envelope structure.
The irst toxicological test used Escherichia coli (ATCC 8739). Inhibition percentage that indicates cellular toxicity was determined using ToxTrack Toxicity Test Kit (Hach Company®) and spectrophotometer Odyssey Hach® -
model DR/2500 (Method 10017). The method is based on reduction of a redox indicator dye (resazurin) by bacterial respiration. Thus, color variations were measured at 603 nm absorbance and inhibition percentage was determined for the samples.
Furthermore, toxicological test with Saccharomyces cerevisiae were made according to Régis and Bidoia24 and
Inazaki et al.25S. cerevisiae cell suspension was exposed to
phenolic samples. Test tubes were incubated at 28 ºC for seven days. Cells were counted in a Neubauer chamber with erythrosine. Living cells remained translucent (no color) and dead cells stained in red under the microscope.26 Results were
expressed on cell viability ([living cells/total cells] × 100).
Results and Discussion
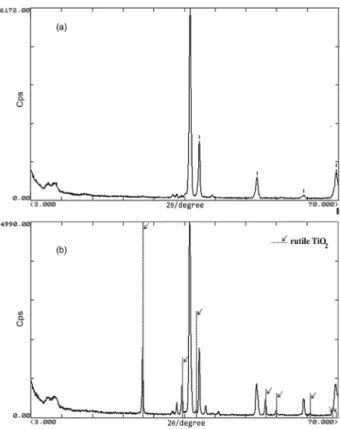
X-ray diffraction
It was analyzed with X-ray diffraction the titanium electrode covered with a thin layer of TiO2 to characterize
and identify the crystalline structures present. The examined electrodes were: Ti plate (Figure 4a) and TiO2 (Figure 4b).
The diffraction patterns interpreted by the software Diffrac-At Siemens® revealed that the thermally produced
semiconductor TiO2 ilm is found in rutile form (Figure 4).
The anatase and brookite forms were not identiied in the electrodes used in the photocatalytic treatment.
The same results were found when the thermal electrode was prepared at 700 ºC for 10 min.13,15,27 Similarly,
Castañeda et al.28 reported that the rutile phase is formed at
high temperatures and the anatase phase is formed at lower temperatures (about 450 ºC).
Treatment 1
It was evaluated in treatment 1 (T1) UVC effect in phenol solution in presence or absence of TiO2 electrode
and electric potential. Results were determined by method 1 in initial time (t0), after 5 and 23 h treatment (Figure 5).
Figure 5. Phenol concentration in treatment 1 (method 1).
According to Figure 5, absorbance values of samples treated by photolysis (UVC only) increased with time. Therefore, erroneous conclusions can be drawn regarding phenol concentration because such phenol increase is not feasible. There was no change in operational parameters and solution composition after experiment beginning.
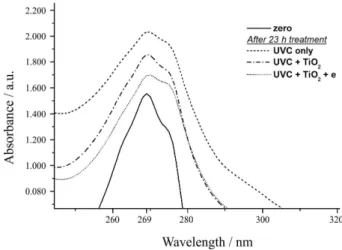
An absorbance increase at 269 nm in all assays irradiated by UVC (Method 1) can be observed in Figure 6. The higher values observed were due to a color change in phenol solution, which was colorless at the beginning (t0) and became orange after UVC radiation. Phenol degradation by UVC photolysis formed byproducts in solution and some of these compounds interfered in results due to the increase of absorbance in 269 nm.
Treatment 2
The second treatment (T2) determined the effect of different electrodes under UVC radiation, but in this case phenol concentration was quantiied by method 2 (Figure 7).
Figure 7 demonstrates absorbance decrease in function of time in all assays, i.e., phenol concentration reduction in relation to treatment time. Thus, Method 2 was able to quantify the real phenol concentration in solution unlike method 1 (Figure 5).
In T2 phenol reduction was about 30.0-35.0%, as shown in Figure 7. All four assays presented similar values of concentration after 6 h treatment ranging from: 0.07129 g L-1 (UVC/TiO
2) and 0.07481 g L-1 (UVC/CE).
Toxicity
Results of toxicological tests showed that all samples were toxic neither to bacteria (E. coli), nor for yeast (S. cerevisiae).
Tests conducted with ToxTrack Toxicity Test Kit (Hach Company®) and Escherichia coli presented pink color
and absorbance similar to control assay, pointing that no inhibition in bacterial metabolism was promoted by phenol in solution. The inhibition percentage of 0% was obtained in accordance with ToxTrack® method.
Besides, phenol solutions treated in T1 and T2 did not present toxicity to Saccharomyces cerevisiae cells. Regarding toxicological tests on yeast cell viability,
S. cerevisiae cells were not stained by erythrosine even after a week of exposure to phenol samples. Their translucent appearance under microscope indicated that cells remained alive. The results observed in control assay (S. cerevisiae
cells and water) were similar to phenol samples assays. In all toxicological assays yeast living cells were presented above 95%.
Discussion
Phenol degradation begins when the aromatic ring is hydroxylated to produce intermediate compounds as hydroquinone and/or catechol followed by the formation of p-benzoquinone and/or o-benzoquinone. Finally, opened ring originates organic acids.29
Among these compounds some may possess chromophores groups. These organic molecules in samples presented absorbance values in visible spectrum and also increased UV absorbance. Consequently, higher absorbance values were found at 269 nm phenol peak, as shown in T1 (Figures 4 and 5). Within these compounds, catechol and hydroquinone are highlighted.30
In photocatalysis, byproducts are formed and some has chromophore groups can absorb UV radiation in a wavelength near phenol peak 269 nm.30 Thus, absorbance
curves may be added and promoted higher values at 269 nm absorbance. Therefore, the UV direct spectrophotometry
Figure 6. Absorbance spectra in treatment 1 (method 1).
(method 1) was not able to determine the phenol concentration in this case. Moreover, method 2 became the most suitable because it eliminated the inluence of various byproducts formed from the phenol degradation in UV absorbance.
Chun et al.31 observed that phenol solution is colorless
and under UVC this solution gradually acquired an orange color in TiO2 and O2 absence, accordingly to results obtained.
Phenol molecules suffered excitation by high energy radiation and reacted hence forming a polymeric residue in suspension which colored to the aqueous solution.
Moreover Johnson et al.32 demonstrated that phenol
was degraded into intermediate compounds (benzoquinone and carboxylic acids) during the photoelectrochemical degradation. They observed that the solution color changed to light brown with benzoquinone generation and returned to its original colorless appearance with the gradual conversion of this substance into carboxylic acids.
Under high energy radiation, such as UVC, the phenol solution assumed a brownish-orange color that relected the absorbance increase of samples at 269 nm. Thereafter, method 1 was unable to determine phenol concentration and method 2 could only be used in this case since there is formation of an orange compound with 500 nm wavelength absorbance.
There was a decrease in phenol concentration using 4-aminoantipyrine reaction methodology. It demonstrated that method 2 was able to quantify phenol reduction due to the treatment (Figure 7), unlike the analysis presented by method 1 (Figure 5).
In Figure 7 it was observed that phenol degradation is not dependent of the electrode and of electric potential application. Gimeno et al.33 corroborated saying that
phenols were degraded mainly by photolytic action when solution was under small wavelengths radiation at 254 nm (UVC spectrum).
The toxicological tests did not establish the inhibition percentage for the microorganisms used when exposed to phenol solutions. This is because in both cases there was no death or cellular inhibition. Results contradict some studies mentioning the biocidal character of phenol.34
Also Tiburtius et al.35 said that phenol concentrations
above 0.070 g L-1 were considered toxic to some microbial
populations. Thus, it was conclude that methods employed in this study were not able to evaluate the phenol toxicity for E. coli and S. cerevisiae cells.
Conclusions
The present study showed that treatment of phenol solutions in systems consisted by UVC radiation and
different electrodes with or without application of electric potential was effective. However, concentration reduction was not detected by UV direct spectrophotometry (269 nm) due to formation of intermediate compounds. Their molecules present some chromophore groups that provide coloration to solution and, therefore, the direct photometric method was indicated. Moreover, it was determined that in treatment with high energy radiation (UVC) phenol degradation was only owing to photolysis.
Acknowledgments
CAPES, CNPq, FUNDUNESP, FAPESP and PRH-05 (UNESP/Rio Claro) are gratefully acknowledged.
References
1. Houk, V. S.; Mutat. Res. 1992, 227, 91.
2. Baird, C.; Química Ambiental, 2nd ed.; Bookman: Porto Alegre,
RS, Brasil, 2002.
3. Lewis, T. E.; Wolinberg, T. F.; Barta, M. L.; Environ. Int. 2004,
30, 1119.
4. USEPA - United States Enviromental Protection Agency;
Release and Pollution Prevention Report; Washington DC, 2000. <http://www.epa.gov/ttnatw01/hlthef/phenol.html>. 5. Wu, Z.; Zhou, M.; Environ. Sci. Technol. 2001, 35, 2698. 6. Litter, M. I.; Appl. Catal., B 1999, 23, 89.
7. Munter, R.; Proc. Est. Acad. Sci., Chem. 2001, 50, 59. 8. Inazaki, T. H.; de Moraes, P. B.; Régis, G.; Lopes, P. R. M.;
Montagnolli, R. N.; Pião, A. C. S.; Bidoia, E. D.; J. Waste Water Treatment Analysis2010, 1:101, doi:10.4172/2157-7587.1000101.
9. Butterield, I. M.; Christensen, P. A.; Hamnett, A.; Shaw, K. E.; Walker, G. M.; Walker, S. A.; J. Appl. Electrochem. 1997, 27, 385.
10. Quan, X.; Chen, S.; Su, J.; Chen, J.; Chen, G.; Sep. Purif. Technol. 2004, 34, 73.
11. Li, X. Z.; Li, F. B.; Fan, C. M.; Sun, Y. P.; Water Res. 2002, 36, 2215.
12. Gerischer, H.; Electrochim. Acta 1993, 38, 3.
13. Harper, J. C.; Christensen, P. A.; Egerton, T. A.; Curtis, T. P.; Gunlazuardi, J.; J. Appl. Electrochem. 2001, 31, 623. 14. Walker, S. A.; Christensen, P. A.; Shaw, K. E.; Walker, G. M.;
J. Electroanal. Chem.1995, 393, 137.
15. Christensen, P. A.; Curtis, T. P.; Egerton, T. A.; Kosa, S. A. M.; Tinlin, J. R.; Appl. Catal., B 2003, 41, 371.
16. Palombari, R.; Ranchella, M.; Rol, C.; Sebastiani, G. V.; Sol. Energy Mater. Sol. Cells 2002, 71, 359.
17. Krýsa, J.; Zlámal, M.; Waldner, G.; J. Appl. Electrochem.2007,
37, 1313.
19. Gusmão, I. C. P.; de Moraes, P. B.; Bidoia, E. D.; Braz. J. Microbiol. 2009, 40, 649.
20. Claro, E. M. T.; Otenio, M. H.; Bidoia, E. D.; Silva, N. M. M. G.; Santos V.; Quim. Nova 2010, 33, 557.
21. Ksibi, M.; Zemzemi, A.; Boukchina, R.;J. Photochem. Photobiol., A 2003, 159, 61.
22. APHA; Standard Methods for the Examination of Water and Wastewater, 17th ed.; American Public Health Association:
Washington, 1989.
23. Lathasree, S.; Nageswara Rao, A.; Siva Sankar, B.; Sadasivam, V.; Rengaraj, K.; J. Mol. Catal. A: Chem. 2004, 223, 101. 24. Régis, G.; Bidoia, E. D.; Salusvita 2001, 20, 53.
25. Inazaki, T. H.; Pião, A. C. S.; Bidoia, E. D.; Braz. Arch. Biol. Technol. 2004, 47, 983.
26. Sharf, J. M.; Exame Microbiológico de Alimentos;Polígono: São Paulo, Brasil, 1972.
27. Christensen, P. A.; Egerton, T. A.; Kosa, S. A. M.; Tinlin, J. R.; Scott, K.; J. Appl. Electrochem. 2005, 35, 683.
28. Castañeda, L.; Alonso, J. C.; Ortiz, A.; Andrade, E.; Saniger, J. M.; Bañuelos, J. G.; Mater. Chem. Phys.2003, 77, 938.
29. Andrade, L. S.; Laurindo, E. A.; Oliveira, R. V.; Rocha-Filho, R. C.; Cass, Q. B.; J. Braz. Chem. Soc. 2006, 17, 369. 30. Tryba, B.; Morawski, A. W.; Inagaki, M.; Toyoda, M.; Appl.
Catal., B 2006, 63, 215.
31. Chun, H.; Yizhong, W.; Hongxiao, T.; Chemosphere 2000, 41, 1205.
32. Johnson, S. K;, Houk, L. L.; Feng, J.; Houk, R. S.; Johnson, C.; Environ. Sci. Technol. 1999, 33, 2638.
33. Gimeno, O.; Carbajo, M.; Beltrán, F. J.; Rivas, J.; J. Hazard. Mater. 2005, B119, 99.
34. Rajeshwar, K.; Ibanez, J. G.; Swain, G. M.; J. Appl. Electrochem. 1994, 24, 1077.
35. Tiburtius, E. R. L.; Peralta-Zamora, P.; Leal, E. S.; Quim. Nova 2004, 27, 441.
Submitted: March 30, 2011
Published online: June 28, 2011