Article
J. Braz. Chem. Soc., Vol. 22, No. 9, 1662-1668, 2011. Printed in Brazil - ©2011 Sociedade Brasileira de Química 0103 - 5053 $6.00+0.00
A
*e-mail: [email protected]
Determination of Efavirenz in Diluted Alkaline Electrolyte by Cathodic Adsorptive
Stripping Voltammetry at the Mercury Film Electrode
Arnaldo A. Castro,a,b Marcus V. N. de Souza,c Nicolás A. Rey*,a and Percio A. M. Fariasa
aDepartmento de Química, Pontifícia Universidade Católica do Rio de Janeiro,
Rua Marquês de São Vicente no. 225, 22453-900 Rio de Janeiro-RJ, Brazil
bFacultad de Química, Química Analítica, Universidad de La Habana, CP 10400,
Ciudad de la Habana, Cuba
cInstituto de Tecnologia em Fármacos-FarManguinhos, Fundação Oswaldo Cruz,
Av. Comandante Guaranys no. 447, Jacarepaguá, 22775-903 Rio de Janeiro-RJ, Brazil
Um método de redissolução para a determinação do agente anti-retroviral efavirenz em concentrações submicromolares e meio eletrolítico alcalino diluído é descrito. As condições
experimentais ótimas encontradas são: NaOH 2,0 × 10⁻³ mol L-1, potencial de acumulação −0,10 V,
amplitude de pulso 50 mV e velocidade de varredura 50 mV s-1. A resposta é linear sobre a faixa
de concentrações 0,01-0,25 ppm. Para um tempo de acumulação de 10 min, o limite de detecção
encontrado foi igual a 1,0 ppb (3,0 × 10⁻⁹ mol L-1). As condições mais convenientes para a medida
da concentração de efavirenz na presença de ATP, DNA, diversos metais e outros antivirais foi também investigada. A utilidade do método é demonstrada pela determinação de efavirenz em uma mistura sintética contendo lamivudina e zidovudina, drogas frequentemente usadas na clínica em associação com o efavirenz como parte da terapêutica anti-retroviral de alta ação (HAART).
A stripping method for the determination of the antiretroviral drug efavirenz at the submicromolar concentration levels in diluted alkaline electrolyte is described. Optimum
experimental conditions were: 2.0 × 10⁻³ mol L-1 NaOH, accumulation potential of −0.10 V, pulse
amplitude of 50 mV and scan rate of 50 mV s-1. The response is linear over the concentration
range of 0.01-0.25 ppm. For an accumulation time of 10 min, the limit of detection was 1.0 ppb
(3.0 × 10⁻⁹ mol L-1). The most convenient conditions to measure the efavirenz concentration in
the presence of ATP, DNA, several metals, and other antiviral drugs was also investigated. The utility of the method is demonstrated by the determination of efavirenz in a synthetic mixture containing both lamivudine and zidovudine, which are frequently used in the clinic in association with efavirenz as part of highly active antiretroviral therapy (HAART).
Keywords: efavirenz determination, antiviral drugs, metals, thin-ilm mercury electrode, differential pulse scan stripping voltammetry
Introduction
Efavirenz (brand names Sustiva™ and Stocrin™, Figure 1) is a non-nucleoside reverse transcriptase inhibitor (NNRTI) and is used as part of highly active antiretroviral therapy for the treatment of human immunodeiciency virus (HIV) type 1. These drugs stop HIV from multiplying by preventing the reverse transcriptase enzyme from working. This enzyme transcribes HIV genetic material (single-stranded RNA) into double-(single-stranded DNA. This step has to occur before HIV genetic code gets inserted into the
genetic code of an infected cell. Efavirenz is also used in combination with other antiretroviral agents as part of an expanded post-exposure prophylaxis regimen to reduce the
H N
O Cl
O
F F
F
hazard of HIV infection in people exposed to a signiicant risk (e.g. needlestick injuries, certain types of unprotected sex etc). Current guidelines for the management of HIV patients suggest the use of two nucleoside reverse transcriptase inhibitors (NRTIs), such as lamivudine and zidovudine, in combination with a NNRTI, such as efavirenz.1-3 Lamivudine and zidovudine are present in the popular HIV medication Combivir™. Recently, efavirenz began to be produced in Brazil on request of the Ministry of Health.
Several chromatographic4-15 and spectrophotometric16 analytical methods have been developed for the determination of efavirenz, but only one electroanalytical work was reported to date.17 With the recent advancements in properties of the adsorptive stripping voltammetry, new methodologies have been developed for adenine, thymine, guanine, ATP and DNA determinations employing alkaline solution with lower ionic strength as the supporting electrolyte.18-21 Using this alkaline electrolyte, the present work reports a new stripping voltammetric procedure for trace detection of efavirenz based on its adsorption at a thin-ilm mercury electrode. The advantages, instrumental parameters and possible limitations of this procedure are also explained in this work. Furthermore, the effects of a wide range of potentially interfering compounds, such as the antiviral drugs didanosine, acyclovir, nevirapine, indinavir, nelinavir, saquinavir, lamivudine, zidovudine, some metal ions and ATP or DNA were examined.
Experimental
Apparatus
Differential pulse or cyclic voltammograms were obtained with an EG&G PAR model 384-B Polarographic Analyser (Princeton Applied Research, Princeton, NJ, USA), equipped with an external cell and a Houston Ametek-DMP-40 series digital plotter. The working electrode was a glassy carbon electrode (GCE, 3.0 mm diameter, BAS-Bioanalytical Systems, Inc., West Lafayette, Indiana 47906, USA) with thin-ilm mercury, an Ag/AgCl reference electrode with vycor tip and a platinum auxiliary electrode. A magnetic stirrer and stirring bar (Nalgene Cat. No. 6600-0010, Rochester, NY, USA) provided convective transport during the accumulation step.
Preparing the thin-ilm mercury electrode
The thin mercury ilm was deposited from a 10-2 mol L-1 Hg(NO3)2 solution, prepared by dissolution of 0.4 g of mercury(II) nitrate in 100 mL of an acidiied Milli-Q water (5% HNO3).
A glassy carbon electrode (GCE, BAS) was initially polished with alumina (PK-4, BAS) and then mounted with the help of a Telon holder in a voltammetric cell provided with an Ag/AgCl reference electrode, a platinum auxiliary electrode, and containing 1 mL of mercury(II) nitrate solution, 1 mL of 10-1 mol L-1 potassium nitrate solution and 8 mL of puriied water. The solution was purged with nitrogen for 240 s to eliminate the oxygen initially present. Mercury plating was carried over for 5 min at a cell of −0.9 V. After checking that the electrode was plated properly, the set of electrodes was rinsed with water and a new clean cell containing the analyte solution was itted.
Reagents
Water purified in a Milli-Q purification system (Millipore, Billerica, MA, USA) was used for all dilutions and sample preparations. All chemicals were analytical reagent grade. Efavirenz standard was used as received by the FarManguinhos-FIOCRUZ (Fundação Oswaldo Cruz, Rio de Janeiro-RJ). Stock solutions of 1000 ppm were prepared dissolving 50 mg of the target reagent efavirenz into 5 mL of 2 mol L-1 NaOH, 5 mL of ethyl alcohol and water until a volume of 50 mL was reached. Diluted efavirenz solutions of 100 or 10 ppm were prepared daily using 5 mL of 1000 or 100 ppm efavirenz into 5 or 25 mL of ethyl alcohol and water until 50 mL was reached. Stock solutions of other HIV drugs were prepared according to the procedure described for efavirenz. The didanosine and acyclovir stock solutions were prepared without the presence of ethyl alcohol. The solutions were stored in the dark at 4 oC. A 1000 ppm copper and other metals stock solutions (atomic absorption standard solution, Sigma-Aldrich Brasil Ltda.) were used, and diluted as required for standard additions. Stock solutions of 1000 ppm of adenosine 5’-triphosphate, disodium salt hydrate (ATP) were prepared by dissolving 10 mg of the reagent in 2 mL of diluted perchloric acid (10-1 mol L-1) with a subsequent solution heating at 70 oC during 30 s. After heating, the sample was cooled down and diluted to 10 mL with water. Single-stranded calf thymus DNA (Cat. No. D-8899; Lot 43H67951) was used as received from Sigma. A 500 µg DNA/mL stock solution (around 5 mg per 10 mL,
lyophilized powder containing 63% DNA) was prepared according to the procedure described for ATP. The inal solution was stored at 4 oC.
Procedure
(and for 60 s before each adsorptive stripping cycle). Initially, the condition potential (usually −0.9 V) was applied to the electrode for a selected time (usually 60 s). Afterwards, the initial potential (usually −0.10 V) was applied to the electrode with a selected time (usually 240 s), while the solution was slowly stirred. The stirring was then stopped, and after 30 s, the voltammogram was recorded by applying a negative-going potential scan. The scan (usually at 50 mV s-1) was inished at −0.90 V, and the adsorptive stripping cycle was repeated with the same thin-film mercury. After the background stripping voltammograms had been obtained, aliquots of the efavirenz standards were introduced. The entire procedure was automated, as controlled by 384-B Polarographic Analyser. Throughout this operation, nitrogen was passed over the solution surface. All data were obtained at room temperature (25 oC).
Results and Discussion
Parameters affecting the adsorptive stripping behavior of efavirenz
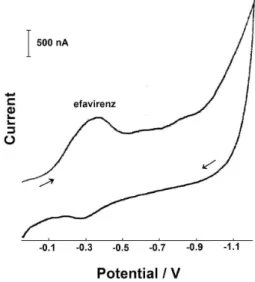
Figure 2 shows the linear adsorptive cyclic voltammogram for 0.1 ppm of efavirenz in a 2.0 × 10⁻³ mol L-1 NaOH solution, using a pre-concentration time of 360 s, with stirring, at +0.05 V. After equilibrium time of 30 s, the linear cathodic cyclic voltammogram was recorded at 200 mV s-1. The efavirenz cathodic peak (Ip) with half-width (b½) of 200 mV appears at –0.36 V (Ep) and a single anodic peak is observed at –0.28 V in the irst scan.
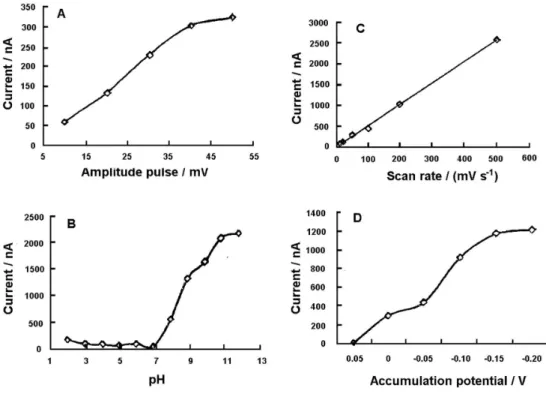
In Figure 3, several chemical and instrumental parameters for the development of efavirenz determination
analytical method in 2.0 × 10⁻³ mol L-1 NaOH at the mercury ilm electrode are shown. The effect of the amplitude pulse on the efavirenz differential pulse stripping peak current was examined over the 10-50 V range and the pH of electrolyte solution between 2-12 (adjusted by the addition of HCl or NaOH solutions). An increasing peak current was observed in the higher amplitude pulse and in a more alkaline medium solution. A careful control of the pH is necessary to examine efavirenz adsorptive stripping measurements. The peak current (Ip) for the surface- adsorbed efavirenz is directly proportional to the scan rate (v). A plot of Ipvs.v was linear over the 10-500 mV s
-1
range (correlation coeficient equal to 0.999) with a slope of 5.2 nA s mV-1. Thus, the analytical signal increases with the increase of the scan rate. However, at the scan rate of 500 mV s-1, the efavirenz peak becomes too broad. Consequently, a scan rate of 50 mV s-1 was chosen as an optimum value. The effect of accumulation potential was investigated and an increasing efavirenz peak current was observed from +0.05 to −0.20 V.
Figure 4 shows the dependence of the differential pulse current peak with the pre-concentration time. With 60 s of pre-concentration, the peak current for a 0.25 ppm efavirenz solution was about 46 times larger than the corresponding peak obtained with a direct (0 s) response. The resulting plot of peak current vs. accumulation time (0-60 s) is linear (slope 10.31 nA s-1 and correlation coeficient equal to 0.997).
Quantitative utility
The effective pre-concentration associated with the adsorption process results in a signiicant lowering of the limit of detection compared to the corresponding solution measurements. A limit of detectiont of 1.0 ppb (3.0 × 10⁻⁹ mol L-1) was estimated from quantiication of 0.01 ppm after a 10 min accumulation (S/N = 2). Thus, 10 ng of efavirenz could be detected in the 10 mL of solution used.
The reproducibility was estimated by ten successive measurements on a stirred 0.25 ppm efavirenz solution (other conditions: supporting electrolyte of 2.0 × 10⁻³ mol L-1 NaOH, condition time of 60 s at −0.9 V, accumulation time of 240 s at −0.1 V, inal potential of −0.9 V, scan rate of 50 mV s-1, equilibrium time of 30 s and thin-ilm mercury electrode). The mean peak current was 74.5 nA with a range of 70.4-78.0 nA and a relative standard deviation of 2.1%. Such precision compares similarly with that reported for other compounds measured by adsorptive stripping analysis.18-21 The cathodic peak potential (E
p) with half-width (b½) remained the same at –0.36 V and 200 mV, respectively.
Figure 2. Linear adsorptive cyclic voltammogram of a 0.1 ppm efavirenz solution in 2.0 × 10⁻³ mol L-1 NaOH. Parameters: condition time of 60 s
Figure 5 displays voltammograms for increasing efavirenz concentrations ((A) 0.02, (B) 0.10 and (C) 0.20 ppm) after 240 s of accumulation. Well-defined stripping peaks (at −0.38 V) were observed between the efavirenz concentrations of 0.02 and 0.25 ppm. A non additive post-peak also was observed in approximately −0.68 V. The resulting plot of peak current vs. concentration is linear (slope equal to 4081 nA ppm-1, correlation coeficient of 0.999). Such linearity prevails as long as linear isotherm conditions (low surface coverage) exist. A separate experiment was performed to test linearity at the low concentration range resulting in well-deined stripping peaks between 0.01 and 0.06 ppm of efavirenz concentration (accumulation time of 360 s, inal potential of −0.9 V and other conditions are the same for results in Figure 5). The resulting plot of peak current vs. concentration also showed linearity (slope equal to 12044 nA ppm-1, correlation coeficient of 0.998).
Table 1 shows a summary of the optimized conditions for efavirenz determination by differential pulse adsorptive stripping voltammetry at the mercury ilm electrode.
Practical applications of differential pulse adsorptive stripping analysis may be affected by interferences due to the presence of metal ions and/or surface active compounds. With respect to the surface reaction, double layer changes
Figure 3. (A) Effect of amplitude pulse on the differential pulse adsorptive stripping voltammograms of 0.10 ppm efavirenz solution in 2.0 × 10⁻³ mol L-1
NaOH. Parameters: condition time of 60 s at −0.90 V, accumulation time of 240 s at −0.10 V, scan rate of 50 mV s-1, equilibrium time of 30 s and thin-ilm
Hg electrode (5 min at −0.9 V). (B) Effect of pH on the differential pulse adsorptive stripping voltammograms of 1.0 ppm efavirenz solution. Parameters: pulse amplitude of 20 mV and other conditions as the same for (A). (C) Effect of scan rate on the linear cyclic voltammograms of 0.25 ppm efavirenz in 2.0 × 10⁻³ mol L-1 NaOH. Parameters: accumulation time of 240 s at +0.05 V, inal potential of –1.2 V and other conditions as the same for (B);
(D) Effect of accumulation potential on the differential pulse adsorptive stripping voltammograms of 0.20 ppm efavirenz solution in 2.0 × 10⁻³ mol L-1
NaOH. Parameters: pulse amplitude of 50 mV and other conditions as the same for (A).
Figure 4. Effects of accumulation time at −0.10 V on the differential pulse adsorptive stripping voltammograms of 0.25 ppm of efavirenz in 2.0 × 10⁻³ mol L-1 NaOH. The (A), (B) and (C) curves are relative
to accumulation times of 0, 30 (50 nA scale) and 60 (100 nA scale) s, respectively. Parameters: condition time of 60 s at −0.90 V, scan rate of 50 mV s-1, pulse amplitude of 50 mV, equilibrium time of 30 s and
or direct interactions deriving from these substances may inhibit or aid the accumulation of the analyte. Measurements of 0.10 or 0.15 ppm of efavirenz (conditions: supporting electrolyte of 2.0 × 10⁻³ mol L-1 NaOH, condition time of 60 s at −0.9 V, accumulation time of 240 or 360 s at −0.10 V, inal potential of −0.9 V, amplitude pulse of 50 mV, scan rate of 50 mV s-1, equilibrium time of 30 s and thin-ilm mercury electrode) were not affected by addition of up to 0.02 ppm of iron(III) or cobalt(II), up to 0.12 ppm of lead(II), up to 0.15 ppm of cadmium(II), up to 0.16 ppm of nickel(II) and up to 0.5 ppm of zinc(II). At higher metal concentrations, the efavirenz peak increases in presence of iron(III) or cobalt(II) and indicates a possible formation of a Fe or Co-efavirenz complex. The zinc(II) or cadmium(II) in efavirenz solution presents a new and well-deined peak at −0.63 V. The more dramatic interference was observed with copper(II). The addition of 0.01 ppm of copper(II) resulted in an increase of 4 times in efavirenz peak height.
Preliminary studies were developed for the determination of efavirenz in presence of other antiretroviral drugs for the treatment of human immunodeiciency virus (HIV): didanosine, acyclovir, nevirapine, indinavir, nelfinavir, saquinavir, lamivudine and zidovudine. It is worth noting that the latter two drugs constitute the medication Combivir™, administered in combination with efavirenz in HAART. Measurements of 0.10 ppm efavirenz (conditions: supporting electrolyte of 2.0 × 10⁻³ mol L-1 NaOH, condition time of 60 s at −0.9 V, accumulation time of 360 s at −0.10 V, inal potential of −0.9 V, amplitude pulse of 50 mV, scan rate of 50 mV s-1, equilibrium time of 30 s and thin-ilm mercury electrode) were not affected by the addition of up to 0.10 ppm of didanosine, acyclovir, nevirapine, indinavir, nelinavir and saquinavir. A linear adsorptive cyclic voltammogram for 0.1 ppm of free didanosine in a 2.0 × 10⁻³ mol L-1 NaOH solution showed a cathodic peak at −0.56 V. Measurements of 0.05 ppm efavirenz (supporting electrolyte, 2.0 × 10⁻³ mol L-1 NaOH with 1% v/v of ethyl alcohol, accumulation time of 240 s at −0.10 V) were not affected by addition of up to 0.06 ppm of lamivudine or zidovudine. After the addition of 0.08 ppm of lamivudine or zidovudine, a new well-deined cathodic peak appears at −0.62 V. A synthetic mixture sample constitutive of 10 ppm of efavirenz, 10 ppm of zidovudine and 10 ppm of lamivudine also was analyzed. The efavirenz (0.05 ppm) cathodic peak appears at −0.22 V, while zidovudine (0.05 ppm) with lamivudine (0.05 ppm) appears at −0.58 V. The zidovudine and lamivudine peak is not affected by the presence of copper(II) (0.05 ppm).
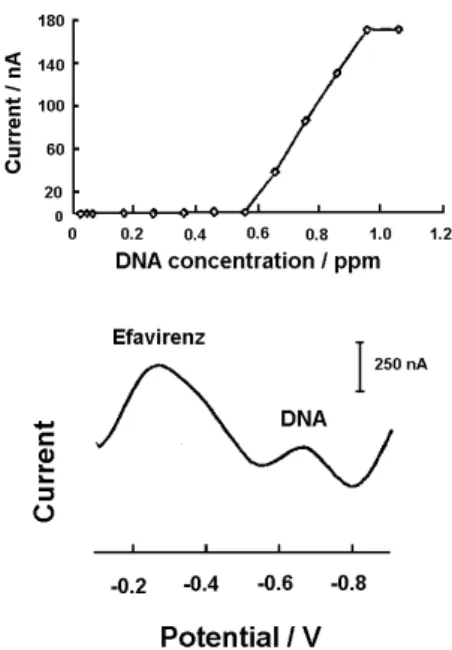
Preliminary studies were also developed for the determination of efavirenz in the presence of DNA (Figure 6). The current measurements of 1.0 ppm efavirenz (conditions: supporting electrolyte of 2.0 × 10⁻³ mol L-1
Table 1.Optimized conditions for efavirenz determination by differential pulse adsorptive stripping voltammetry at the mercury ilm electrode
Parameters Optimized conditions
Thin-ilm mercury electrode 5 min at −0.9 V Efavirenz concentration range 0.01-0.25 ppm Electrolyte 2.0 × 10⁻³ mol L-1 NaOH
Scan mode differential pulse
Initial potential −0.1V
Final potential −0.9 V
Amplitude pulse 50 mV
Scan rate 50 mV s-1
Condition potential −0.9 V
Condition time 60 s
Accumulation potential −0.1 V
Accumulation time 240 s
Equilibrium time 30 s
Figure 5. Differential pulse scan adsorptive stripping voltammograms obtained after increasing the efavirenz concentration in a solution of 2.0 × 10⁻³ mol L-1 NaOH. The (A), (B) and (C) curves are relative to 0.02,
0.10 and 0.20 ppm of efavirenz, respectively. Parameters: accumulation time of 240 s at −0.10 V, condition time of 60 s at −0.9 V, scan rate of 50 mV s-1, inal potential at −0.9 V, equilibrium time of 30 s and thin-ilm
NaOH, condition time of 60 s at −0.9 V, accumulation time of 240 s at −0.1 V, inal potential of −0.9 V, scan rate of 50 mV s-1, amplitude pulse of 50 mV, equilibrium time of 30 s and thin-ilm mercury electrode) were not affected by addition of up to 0.86 ppm of DNA. A small positive shift of the efavirenz peak potential (from −0.38 to −0.28 V) was observed in presence of DNA. After the addition of 0.66 ppm of DNA to a solution containing 1.0 ppm of efavirenz, a DNA peak was also observed at −0.67 V. Well-deined stripping DNA peaks (at −0.67 V) were observed over the 0.66-0.96 ppm concentration range. The resulting plot of DNA peak current vs. concentration (also shown in Figure 6) is linear (slope equal to 431.7 nA ppm-1, correlation coefficient of 0.999). Preliminary studies were also developed for the determination of efavirenz in presence of ATP. The current measurements of 0.05 ppm of efavirenz (accumulation time of 240 s at −0.2 V, conditions are the same for the DNA experiment) were not affected by addition of up to 0.08 ppm of ATP.
Conclusions
An effective method for the determination of trace levels of the antiretroviral drug efavirenz was developed. The use of the simple and diluted alkaline electrolyte provided a sensitive and selective adsorptive stripping voltammetric method for efavirenz determination. An important point
Figure 6. Differential pulse adsorptive stripping voltammogram of efavirenz (1.0 ppm) in the presence of DNA (0.96 ppm) in a solution of 2.0 × 10⁻³ mol L-1 NaOH. Parameters: accumulation time of 240 s at
−0.10 V, time of 60 s at −0.9 V, scan rate of 50 mV s-1, amplitude pulse
of 50 mV, inal potential at −0.9 V, equilibrium time of 30 s and thin-ilm Hg electrode (5 min at −0.9 V). A plot of DNA current peak at −0.67 V
vs. DNA concentration is also shown. The experiment was carried out in the absence of oxygen.
of difference with respect to the only electroanalytical work on efavirenz published to date is that the detection is made in the cathodic region (−0.38 V), instead of the anodic peak (1.40 V) used by Dogan-Topal et al.17 Furthermore, the previously reported methodology is appropriated for acidic media determinations (pH 3.0 was deemed an optimal value), while our system was designed to work in alkaline conditions. Interference studies indicate possible determination of efavirenz in the presence of other antiretroviral drugs used for the treatment of human immunodeiciency virus (HIV), like didanosine, nevirapine, indinavir, nelinavir, saquinavir, lamivudine and zidovudine. These potential interferents were not taken into account by Dogan-Topal et al.17 The efavirenz peak increases in the presence of iron(III) or cobalt(II), indicating a possible formation of Fe or Co-efavirenz complexes. The efavirenz and lamivudine or zidovudine stripping peaks are separated by 0.36 V, and the efavirenz and DNA peaks by 0.39 V. New methods using diluted alkaline solution as the supporting electrolyte and ilm mercury electrode modiied
in situ by metallic ions can be used for the detection of other drugs and DNA-intercalating dyes, as well as for amino-acids, peptides and proteins determinations. A similar study involving the bismuth ilm electrode22 is in progress.
Acknowledgments
The authors gratefully acknowledge CAPES (Coordenação de Aperfeiçoamento de Pessoal de Nível Superior, Brazil) and Ministério de Educación Superior of Cuba Republic (MES-Cuba) for their support to this work.
References
1. Young, S. D.; Britcher, S. F.; Tran, L. O.; Payne, L. S.; Lumma, W. C.; Lyle, T. A.; Huff, J. R.; Anderson, P. S.; Olsen, D. B.; Carroll, S. S.; Pettibone, D. J.; Obrien, J. A.; Ball, R. G.; Balani, S. K.; Lin, J. H.; Chen, I. W.; Schleif, W. A.; Sardana, V. V.; Long, W. J.; Byrnes, V. W.; Emini, E. A. L.; Antimicrob. Agents Chemother.1995, 39, 2602.
2. Gotte, M.; Li, X. G.; Wainberg, M. A.; Arch. Biochem. Biophys.
1999, 365, 199.
3. Gallant, J. E.; Jesus, E.; Arribas, J. R.; Pozniak, A. L.; Gazzard, B.; Campo, R. E.; Lu, B.; McColl, D.; Chuck, S.; Enejosa, J.; Toole, J. J.; Cheng, A. K.; N. Engl. J. Med.2006, 354, 251. 4. Villani, P.; Pregnolato, M.; Banfo, S.; Rettani, M.; Burroni, D.;
Seminari, E.; Maserati, R.; Regazzi, M. B.; Ther. Drug Monitor.
1999, 21, 346.
5. Marzolini, C.; Telenti, A.; Buclin, T.; Biollaz, J.; Decosterd, L. A.; J. Chromatogr., B: Anal. Technol. Biomed. Life Sci.2000,
6. Matthews, C. Z.; Woolf, E. J.; Mazenko, R. S.; Haddix-Wiener, H.; Chavez-Eng, C. M.; Constanzer, M. L.; Doss, G. A.; Matuszewski, B. K.; J. Pharm. Biomed. Anal.2002, 28, 925. 7. Takahashi, M.; Yoshida, M.; Oki, T.; Okumura, N.; Suzuki, T.;
Kaneda, T.; Biol. Pharm. Bull.2005, 28, 1286.
8. Lemmer, P.; Schneider, S.; Schuman, M.; Omes, C.; Arendt, V.; Tayari, J. C.; Fundira, L.; Wennig, R.; Ther. Drug Monitor.
2005, 27, 521.
9. Ramachandran, G.; Kumar, A. K. H.; Swaminathan, S.; Venkatesan, P.; Kumaraswami, V.; Greenblatt, D. J.;
J. Chromatogr., B: Anal. Technol. Biomed. Life Sci.2006,
835, 131.
10. Sailaja, A. L.; Kumar, K. K.; Kumar, D. V. R. R.; Kumar, C. M.; Yugandhar, N. M.; Srinubabu, G.; Chromatographia2007, 65, 359.
11. Kankaanpaa, A.; Turtiainen, S.; Meririnne, E.; Arinierm, K.; Ristola, M.; Kuoppasalmi, K.; Ther. Drug Monitor.2007, 29, 513.
12. Dogan-Topal, B.; Ozkan, S. A.; Uslu, B.; Chromatographia
2007, 66, S25.
13. Notari, S.; Mancone, C.; Alonzi, T.; Tripodi, M.; Narciso, P.; Ascenzi, P.; J. Chromatogr., B: Anal. Technol. Biomed. Life Sci.
2008, 863, 249.
14. Barassi, A.; Pateri, F.; Musazzi, L.; d’Eril, G. M.; Clin. Chem.
2009, 55, A258.
15. Martin, J.; Deslandes, G.; Dailly, E.; Renaud, C.; Reliquet, V.; Rafi, F.; Jolliet, P.; J. Chromatogr., B: Anal. Technol. Biomed. Life Sci.2009, 877, 3072.
16. Sankar, D. G.; Kumar, J. M. R.; Reddy, M. V. V. N.; Asian J. Chem.2003, 15, 1856.
17. Dogan-Topal, B.; Uslu, B.; Ozkan, S. A.; Biosens. Bioelectron.
2009, 24, 2358.
18. Farias, P. A. M.; Wagener, A. de L. R.; Castro, A. A.; Anal. Lett.
2001, 34, 1295.
19. Farias, P. A. M.; Wagener, A. de L. R.; Castro, A. A.; Anal. Lett.
2001, 34, 2125.
20. Farias, P. A. M.; Wagener, A. de L. R.; Junqueira, A. A.; Castro, A. A.; Anal. Lett.2007, 40, 1779.
21. Farias, P. A. M.; Castro, A. A.; Wagener, A. de L. R.; Junqueira, A. A.; Electroanalysis2007, 19, 1207.
22. Wang, J.; Lu, J. M.; Hocevar, S. B.; Farias, P. A. M.; Oqorevc, B.; Anal. Chem.2000, 72, 3218.
Submitted: September 23, 2010
![Figure 1. Chemical structure of efavirenz, [(4S)-6-chloro-4-(2- [(4S)-6-chloro-4-(2- cyclopropylethynyl)-4-(triluoromethyl)-2,4-dihydro-1H-3,1-benzoxazin-2-one].](https://thumb-eu.123doks.com/thumbv2/123dok_br/18995030.461927/1.892.563.688.927.1055/figure-chemical-structure-efavirenz-cyclopropylethynyl-triluoromethyl-dihydro-benzoxazin.webp)