SEASONAL PROBABILITY FORECASTS OF DECEMBER-JANUARY-FEBRUARY
PRECIPITATION IN NORTHERN URUGUAY AND RIO GRANDE DO SUL OBTAINED WITH
THE COUPLED FORECAST SYSTEM V2 OF NOAA AND STATISTICAL DOWNSCALING.
GABRIEL CAZES BOEZIO, STEFANIE TALENTO, GABRIEL JORGE PISCIOTTANO JALABERT
Universidad de la República, Facultad de Ingeniería (IMFIA), Montevideo, Uruguay
[email protected], [email protected], [email protected]
Received May 2011 - Accepted March 2012
ABSTRACT
The present work analyses the inter-seasonal predictability of precipitation during the austral summer in a subregion of Southeastern South America that includes Rio Grande do Sul and Northern Uruguay (RGS-NU), and proposes a methodology to produce probabilistic precipitation forecasts for this region, based on the use of NOAA CFS v2. It is found that the correlation between ENSO and the precipitation over RGS-NU during December-January-February is statistically signiicant after the late 70’s, but not before. Considering that this relationship changes in different multidecadal periods, it is useful to explore a forecast system based on numerical models. We studied the hindcasts from NOAA CFS v2 initialized during October of the years 1983 to 2009, and found that the hindcasts of meridional wind at 850 hPa averaged over certain region of South America have statistically signiicant skill, in terms of correlation, to predict the observed precipitation over RGS-NU. The proposed forecasts are based on this relationship.
The CFS v2 hindcasts also show realistic anomalous circulation patterns associated with the anomalous precipitation in the region and the season considered. This suggests that the forecasts may be further improved by using regional models combined with the CFS v2 outputs.
Keywords: Seasonal forecast, Statistical downscaling, Southeastern South America, Hindcasts
RESUMO: PREVISÃO PROBABILISTICA SAZONAL DA PRECIPITAÇÃO DE DEZEMBRO-JANEIRO-FEVEREIRO NO NORTE DO URUGUAI E RIO GRANDE DO SUL OBTIDA COM O MODELO ACOPLADO DE PREVISÃO DA NOAA E DOWNSCALING ESTATÍSTICA: O presente trabalho analisa a previsibilidade inter-sazonal da precipitação durante o verão austral em uma sub-região do Sudeste da América do Sul, que inclui Rio Grande do Sul e o Norte do Uruguai (RGS-NU), e propõe uma metodologia para produzir previsões probabilísticas da precipitação baseada no uso do CFS v2 da NOAA. Veriica-se que a correlação entre o ENOS e a precipitação sobre RGS-NU em dezembro-janeiro-fevereiro é estatisticamente signiicativa nos últimos 30 anos, mas não nos 30 anos anteriores a estes. Em vista desta mudança na relação em diferentes períodos multi-decenais, consideramos útil explorar um sistema de prognósticos baseados em modelo numérico, o CFS v2 da NOAA. Estudamos as previsões retrospectivas do CFS v2 iniciadas em outubro dos anos 1983 a 2009, e achamos que o valor médio das previsões retrospectivas de vento meridional em 850 hPa sobre determinada região da América do Sul, têm habilidade estatisticamente signiicativa, em termos de coeiciente de correlação, de prever a precipitação observada em RGS-NU. Esta relação é a base da metodologia para produzir previsões da precipitação.
As previsões retrospectivas do CFS v2 também mostram padrões de circulação anômala realistas, associados com as precipitações na região e na época considerada. Isto é encorajador, no sentido de que há potencial para melhorar ainda mais as previsões através do uso de modelos regionais combinados com as saídas do CFS v2.
1. INTRODUCTION
During recent years there have been several studies that documented physical mechanisms relevant to the interannual climatic variability of Southeastern South America (SESA) during austral summer: regional anomalies of atmospheric circulation (Robertson and Mechoso 2000), impact of ENSO on the regional climate (Ropelewski and Halpert 1987, 1989, Aceituno 1988 and 1989, Pisciottano et al. 1994, Grimm et al. 1998, 2000, Grimm 2003, 2004, Cazes Boezio et al. 2003, Silva et al. 2009, Kayano et al. 2008), inluence of sea surface temperature (SST) anomalies in the Atlantic Ocean (Robertson et al. 2003, Barreiro et al. 2002, 2005, Barreiro and Tippmann 2008), effects of soil conditions in regions close to SESA (Grimm at al. 2007, Grimm and Zilli 2009), and effects of low level circulation (Nogués and Mo 1997, Salio et al. 2002, Liebmann et al. 2004, Silva et al. 2009). Despite this variety of studies, the potential for seasonal predictability in this region is better documented for austral spring and fall, since in these seasons the impact of El Niño-Southern Oscillation (ENSO) is more clear (Pisciottano et al. 1994, Grimm et al. 1998, 2000).
A potentially relevant aspect of several of these studies is that they consider data that reach only to the mid 90’s or before. (Grimm et al. 1998, Grimm et al. 2000, Pisciottano et al. 1994, Cazes Boezio et al. 2003, Robertson and Mechoso 2000). On the other hand, Kayano et al. (2008) analyze inter-annual relationships between precipitation over South America and SST indices deined in certain oceanic regions, for two periods: 1948-1976 and 1977-2002. They ind that the most pronounced differences between these periods occur in an area centered around 10ºS-50ºW and in Southern Brazil and Uruguay. The main differences are that the negative (positive) relationship of El Niño (La Niña) with precipitation in northeastern South America and positive (negative) relationship of El Niño (La Niña) with precipitation in southeastern South America are stronger in the second period. Silva et al. (2009) investigate the relationship between ENSO and the summer climate in SESA, and they also consider data from a recent period. These authors analyze the effect of ENSO on the variability of the low level jet of South America (SALLJ), during the austral summers of the 1977-2004 period. They ind that during El Niño years SALLJ tends to occur with a frequency from normal to above normal (and from normal to below normal during La Niña events). They also propose a possible physical mechanism that can explain the modulation of SALJJ produced by ENSO during austral summer: during El Niño events: stronger Atlantic trade winds at the northeast enter into the equatorial part of the continent, and are conducted toward northern Argentina and southern Brazil, channeled between the Andes Mountains and the Brazilian plateau. The baroclinic environment of the basic
low associated with a strengthening of the subtropical jet (SJ) over the continent helps to intensify the SALLJ. The warm tropical air brought by the SALLJ encounters the colder extra tropical air over La Plata Basin, increasing the atmospheric instability and favoring greater precipitations. In the case of La Niña events, the opposite mechanism (consistent with less precipitation over the region) is proposed.
In short, the precipitation predictability in SESA during the austral summer, as well as the variation of its relationship with ENSO before and after the late 70’s, are open to be studied. Pezzi et al. (2000) develop a seasonal climate forecast model, based on statistical techniques. The predictors for this model are SST in areas of the Paciic and the Atlantic oceans, and the predictand is precipitation over Southern Brazil. The use of the two oceans together improves the precision of the predictions as compared to the individual ocean cases. The authors consider data from 1950 to 1980 to develop the forecast model. Zamboni et al. (2010) develop an empirical method to produce long-range forecasts of bimonthly mean precipitation over SESA, based on correlations between upper-level winds and precipitation. The method is tested in hindcast and experimental modes, for the period 1951-2001. The hindcast mode shows potential for reliable predictions during the southern spring, summer, and fall. The experimental mode uses wind hindcasts from “Development of a European Multimodel Ensemble System for Seasonal-to-Interannual Prediction” (DEMETER), and obtains skillful forecasts during spring only, with highest skill during El Niño–Southern Oscillation years. During summer and fall, the DEMETER forecasts of wind anomalies limit the method’s ability to make reliable real predictions. Coelho et al. (2006) propose an objective integrated seasonal forecasting system for producing well-calibrated probabilistic rainfall forecasts for South America. This system has two components, an empirical model that uses Paciic and Atlantic SST anomalies as predictors for rainfall, and a multimodel system composed of three European coupled ocean–atmosphere models. The authors found that when empirical and coupled multimodel predictions are combined and calibrated using forecast assimilation, more skillful integrated forecasts are obtained than with either empirical or coupled multi-model predictions alone. The Tropics and the region comprising southern Brazil, Uruguay, Paraguay, and northern Argentina are found to be the two most predictable regions of South America during November-December-January (NDJ), and skillful rainfall forecasts are generally only possible during El Niño or La Niña years, rather than in neutral years.
the CFS v2 that are initialized with oceanic and atmospheric conditions assimilated during the October months from 1982 to 2009 (which implies one-month lead respect to the target season). We propose a statistical downscaling technique that allows obtaining a forecast of probabilities for the precipitation in the region and the season of interest, and we analyze in which cases the forecast of probabilities proposed can be distinguished from a climatological forecast with some level of statistical signiicance. In a forthcoming work we will analyze physical processes that may have contributed to changes in the correlation between the precipitation in SESA and ENSO, as the ones observed by Kayano et al. (2008).
In section 2 of this paper we describe the main characteristics of the CFS v2 and the available hindcasts, and we refer the data from analyses of observations that we used. In section 3 we show the changes occurred in the late 70’s in the correlation between an index of ENSO and the precipitation in SESA, speciically during the austral summer. In section 4 we analyze the hindcasts of CFS v2 with emphasis on determining the usefulness of the CFS v2 to produce precipitation forecasts in a sub region of SESA. We propose a statistical downscaling technique that allows expressing the forecast in terms of probabilities, and we determine the conditions for which this technique produces better results than a climatological forecast, making this comparison with a metrics and a statistical signiicance level which are deined. In section 5 we present the conclusions.
2. DESCRIPTION OF THE CFS V2 AND THE DATA SETS USED
The CFS v2 was recently released by NOAA. It consists of a coupled general circulation model (CGCM) that includes oceanic, atmospheric, land and sea ice components. The details of this system, and its upgrades with respect to the previous version (CFS, Saha et al. 2006) are described in the CFS website (http://cfs.ncep.noaa.gov/CFS v2.info). The atmospheric model is the NOAA GFS, which has a T126 horizontal resolution (equivalent to 100 km.), and 64 layers in the vertical direction. The oceanic component is the global MOM4 ocean model; its horizontal resolution is 0.25 degree from 10ºN to 10ºS latitudes. Northward and southward to the poles, the resolution is 0.5 degree. The land surface model is the 4-level NOAH (Ek et al. 2003). A 3-layer interactive global sea ice model is also included in the coupled system.
The initialization system includes the assimilation of sea ice and land data, beside oceanic and atmospheric data. The atmospheric data is assimilated by the Atmospheric Climate Data Assimilation Version 2 (CDAS2), which has a T574 horizontal resolution (27 km) with 64 levels in the vertical
direction. The CDAS2 system includes the direct assimilation of satellite radiances. The oceanic data is assimilated by the Global Ocean Data Assimilation (GODAS). The CFS v2 includes a new Global Land Data Assimilation (GLDAS) which uses precipitation data from the Climate Prediction Center (CPC) as forcing for the NOAH land model.
The available hindcasts data include monthly means of 85 commonly used variables, for all the simulations initialized in each calendar month of the year, covering a period of 28 years from 1982-2009. There are 4 simulations every 5th day of each month. The forecast lead is 0 to 9 months. The hindcasts considered here are initiated on October 1st, 6th, 11th, 16th, 21st, 26th and 31th each year; there are 4 simulations initiated at each one of these days (and therefore 28 simulations for each year).
In order to characterize the observed precipitation over South America during long periods we use the prec-l analysis from NOAA, which are monthly totals that extend from 1948 to the present (Chen et al. 2002). This data is global but is provided only over land. It is based on rain gauge data, and is ordered in a 2.5º by 2.5º grid. We also used the CMAP analysis (Xie and Arkin, 1997), in order to study the global precipitation. The CMAP analysis includes precipitation estimates in the oceans, but it does not cover the years before 1978.
In order to compare atmospheric circulation fields obtained from the hindcasts with estimations from observed data, we use the NCEP-NCAR reanalysis (Kalnay et al. 1996). The SST for computing the N3.4 index is from the Reynolds SST analysis version 2. (Reynolds et al. 2002).
3. RELATIONSHIP BETWEEN ENSO AND SUMMER CLIMATE IN SOUTH AMERICA
period. It is found that in northern South America there are negative statistically signiicant correlations (at least at the 5% level) during both periods, while for SESA, its northern half has positive statistically signiicant correlations during the second period, but not during the irst one. The statistical signiicance is evaluated through a Student test with 30 (Figure 1a) or 31 (Figure1b) degrees of freedom. We deine the region “Rio Grande do Sul and North of Uruguay” (RGS-NU) as the region that lies between 32ºS and 27.5ºS, and between 60ºW and the Atlantic coast (indicated with thick lines in Figures 1a and 1b). The values of N3.4 and the prec-l precipitation in RGS-NU for all the DJF seasons from 1949 to 1978 and from 1979 and 2010 are shown in Figures 1c and 1d respectively. The correlation between N3.4 and precipitation is 0.25 for the irst period, and 0.48 for the
second. The correlation during the second period is statistically signiicant at least at the 1% level. If the 1998 case is included, the correlation for the 1979-2010 period rises to 0.57.
So the increase of correlation that has occurred since the late 70’s suggests that ENSO contributed to the predictability of the precipitation in RGS-NU during summer. It is possible to propose an inter-seasonal climatological forecast based straightly on the relationship shown in Figures 1b and 1d. However, we consider desirable to also count on a forecast technique for this season and this region based on the use of some CGCM, since a purely statistical technique requires that the statistical relationships considered remain stable at least during the period in which the forecast systems is used. The change in the correlation between index N3.4 and the prec-1
data in RGS-NU shown in Figures 1a and 1b suggests that the stability of the correlation found in the second period is an issue still open to be studied.
4. FORECAST SYSTEM
In this section we analyze the possibility of making forecasts of precipitation during DJF in RGS-NU, using the CFS v2. First we study the ability of the CFS v2 to reproduce processes relevant to the climatic variability in RGS-NU during summer. Secondly, we propose a statistical downscaling technique, based on the selection of some variable that is at the same time correctly simulated by the CFS v2 and well correlated with the precipitation in the region and the season of interest. The proposed technique includes a procedure to express the precipitation forecast in terms of probabilities.
4.1 Ability of the CFS v2 to simulate physical processes relevant to RGS-NU
In order to explore the capacity of the CFS v2 to reproduce the processes relevant to the interannual variability of the precipitation in RGS-UN during summer, we study the relationship of the time series of such precipitation with other atmospheric variables. This study is performed with analyses, in which observational data are assimilated, and with the CFS v2 hindcasts.The respective results are compared. The selected atmospheric variables are the global precipitation ield, the geopotential height at 200 hPa and the meridional wind at 850 hPa. The global precipitation is important since precipitation anomalies in remote areas can force teleconnections to the region of interest. The 200 hPa circulation is associated with divergence anomalies at high levels above SESA and the South Atlantic Convergence Zone (SACZ) (Robertson and Mechoso 2000), while the meridional circulation at 850 hPa is associated with moisture transport toward SESA (Nogués and Mo 1997, Salio et al. 2002, Liebmann et al. 2004, Silva et al. 2009).
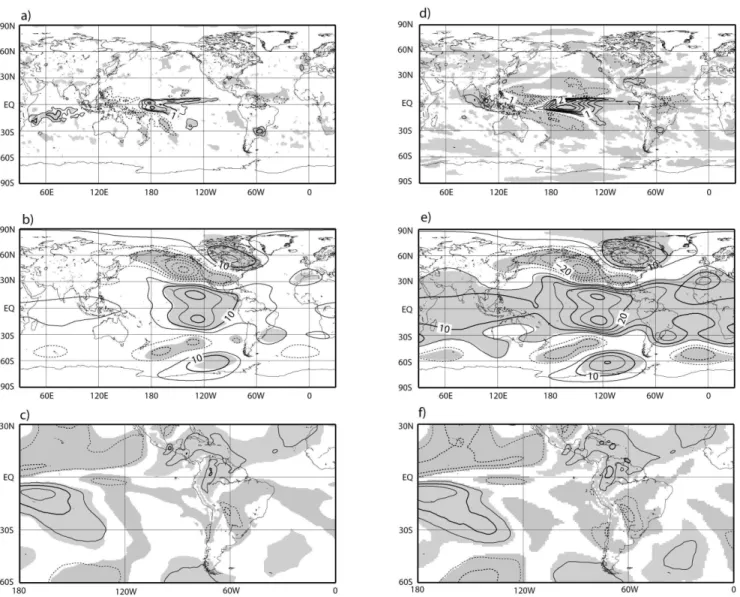
First we show results obtained from analysis of observations. Following the methodology described at Robertson and Mechoso (2000), we deine a precipitation index that consists of the standardized prec-l precipitation in RGS-NU (prec-l index). We compute the ields of linear regression coeficients between this index and the anomalies of the atmospheric variables chosen, at each grid point of their data sets. These computations are done for the 1982-2009 period. Note that since the precipitation anomaly is standardized, at each grid point the regression coeficient represents the anomaly of the atmospheric variable in question that is associated with one standard deviation of precipitation anomaly in a linear adjustment. We use the CMAP analysis for the global precipitation, and the
NCEP-NCAR reanalysis for the 200 hPa geopotential height and the 850 hPa meridional wind. Figure 2a shows the ield of regression coeficients for the CMAP precipitation, Figure 2b for the NCEP-NCAR 200 hPa geopotential height and Figure 2c for the NCEP-NCAR 850 hPa meridional wind. Figure 2a shows that RGS-NU anomalous precipitation is associated with precipitation anomalies of the same sign over the central tropical Paciic, and with opposite anomalies over the western tropical Paciic and the Southern Paciic Convergence Zone. This pattern is characteristic of ENSO, and hence is consistent with the correlation found between N34 index and summer precipitation in RGS-NU after the late 70’s. Figure 2b shows an anomalous vortex eastward SESA that, in its anticyclonic phase, is correlated with positive precipitation anomalies over RGS-NU. At the tropical Paciic there are symmetric anomalies with respect to the Equator, which are also characteristic of ENSO. Figure 2c shows negative anomalies of meridional wind at SESA associated with greater precipitation in RGS-NU.
Figures 2d, 2e and 2f are analogous to Figures 2a, 2b and 2c respectively, but computed with a precipitation index for RGS-NU and atmospheric ields from the CFS v2 hindcasts. The patterns obtained from hindcast and analysis data have very similar geographic structures, showing the capacity of the CFS v2 to reproduce the physical processes related to the variability of the precipitation in the region of interest.
The patterns found both from analyses and from hindcasts agree with the leading mode of interannual climate variability around SESA, documented in several of the referred studies. At upper levels, this leading mode consists of a vortex centered on 30ºS and 30ºW, which is associated with upper level divergence anomalies over SESA (Robertson Mechoso 2000, Cazes Boezio et. al. 2003). The leading mode is also associated with anomalies of low-level moisture inlux and precipitation at SESA (Nogués and Mo 1997, Zamboni et al. 2010, Robertson Mechoso 2000, Cazes Boezio et. al. 2003, Salio et al. 2002, Liebman et al. 2004). The anticyclonic (cyclonic) phase of the upper-level vortex corresponds with positive (negative) anomalies of upper level divergence, low level moisture inlux and precipitation at great part of SESA. We would like to point out that Robertson Mechoso (2000) and Cazes Boezio et al. (2003) ind that during austral summer, this mode is not teleconnected with ENSO. Nevertheless, the data considered by these authors mostly cover the period just before the late 70’s, and therefore, their results are not strictly comparable to those in Figure 2b (and Figure 2d), as far as the inluence of ENSO in SESA is concerned.
4.2 Statistical Downscaling and forecast of probabilities
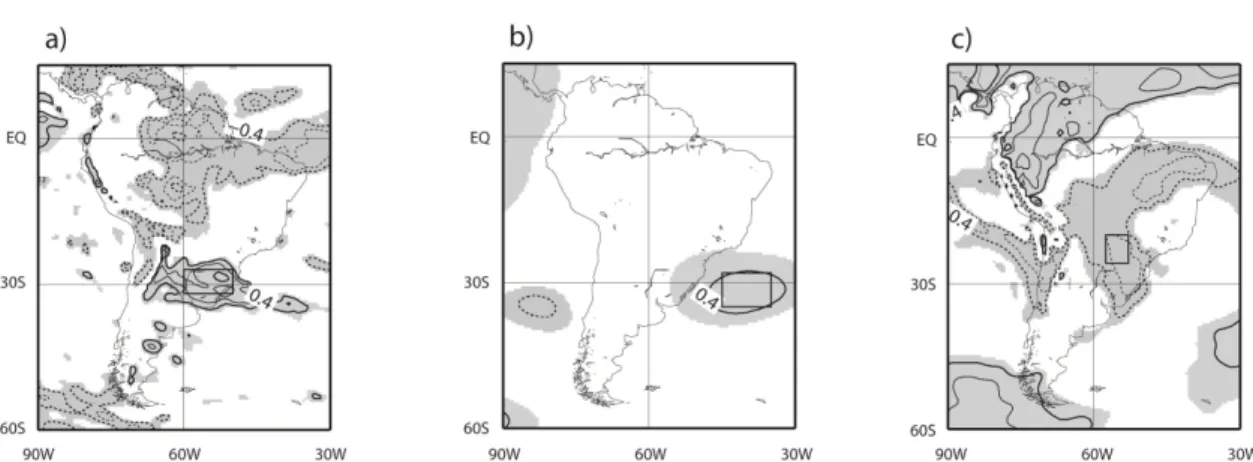
actual precipitation simulated in this region. However, the simulated precipitation might be affected by systematic errors of the model, whereas there can be other variables forecasted in a realistic manner by the CFS v2 that predict the regional precipitation better. For the purpose of identifying possible predicting variables, Figure 3 shows the correlation ields between the prec-l index and the hindcasts of the atmospheric ields considered in Figure 2. All the three hindcasted ields show regions with signiicant correlation with the prec-l index, in agreement with the results shown in Figure 2. Each panel of Figure 3 shows a box that deines a predictor index (which is the average within the box of the correspondent hindcasted
variable). The box is chosen so that the predictor index has maximum correlation with the prec-l index, (which is the predictand). Table 1 gives the deinitions of these predictor indexes and their correlations with the prec-l index. We choose as the best predictor index the “v850 index”, deined as minus the average of the meridional wind at 850 hPa between 25º S and 20ºS and between 58ºW and 53ºW. This index is related with the low-level anomalies of the regional leading mode described above. It is preferred to the other predictors considered in Table 1 because it has the highest correlation with the prec-l index, and it was found that it produced forecasts of probabilities with better skill (in the sense that will be described below).
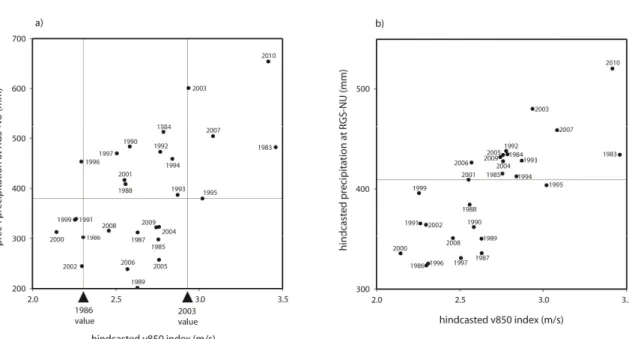
Next we deine a methodology to produce forecasts of probabilities. We deine categories for the values of precipitation observed in RGS-NU, and for any given year, we estimate the probabilities that the precipitation can be found in each one of these categories. Since the size of the hindcasts sample is relatively small (27 cases) and the correlation between the predicted variable and the predictor chosen is moderate (0.58), we propose to make probability estimations for only two categories: (i) observed precipitation above or equal the median of the whole sample of 27 years and (ii) observed precipitation below this median. Figure 4a shows the value of the v850 index for each year of the 1983-2010 period and the correspondent value of the prec-l index. It can be noted that the cases with larger (smaller) hindcasted v850 index have a moderate tendency to be associated with observed precipitation above (below) the median, while the cases with intermediate hindcasted values do not have any clear shift. As a consequence, we can make forecasts different to the climatological one only in those cases in which the forecasted v850 index is relatively extreme. Figure 4b shows the values of v850 index and the correspondent precipitation at RGS-NU from the hindcasts, rather than from the prec-l analysis as Figure 4a. The correlation
between v850 index and simulated precipitation is 0.77, higher than the correlation found between the predictor and prec-l index. It should be noted that the simulated precipitation is the average of an ensemble, which may ilter noise from sources such as the internal variability of the atmosphere, and this may contribute to the increase the correlation.
In order to estimate the probabilities for each category during a particular year, we proceed as follows:
1. we compute the forecast of the v850 index for that year; 2. we consider the 7 cases in the 1983-2010 period that have values of the v850 index closer to the one of the year in question; this is a population of “analogues” to that year, 3. the probability of categories (i) and (ii) (deined above) will be estimated as the correspondent proportion in the analogues sample.
As an example we compute the probabilities estimated for a particular year, 2002. The 7 years that have values of the v850 index closer to this year (without counting the 2002 case itself) are 1986, 1991, 1996, 1997, 1999, 2000 and 2008 (Figure 4a). Of these, 2 are in category (i) (1996 and 1997) and 5 are in category (ii) (1986, 1991, 1999, 2000 and 2008). Consequently, the a priori estimates for the year 2002 are a
Predictor Correlation with prec-l index
Hindcasted precipitation averaged between 60ºW-50ºW and 32ºS-27ºS (precipitation index)
0.51
Hindcasted 200 hPa geopotential averaged between 45ºW-38ºW and 35ºS-27ºS (z200 index)
0.42
Hindcasted 850 hPa meridional wind averaged between 25º S and 20ºS, and between 58ºW and 53ºW; and multiplied by -1. (v850 index)
0.58
Table 1 - Deinition of predictor indexes and their correlations with prec-l index.
probability equal to 5/7 of being in category (ii) and 2/7 of being in category (i).
The selection of the number 7 as the size of the subset of analogues is based on a compromise. A smaller number would produce a subset of analogue cases not large enough to achieve signiicant inferences, even if the DJF precipitation in RGS-NU shows a clear shift. If a number much larger than 7 is chosen, many dissimilar cases may be included, and it can become dificult to observe any shift.
Figure 4a shows that for cases with hindcasted v850 index equal or larger to that of 2003 (2.9 m/s), there is an important shift of the probabilities (estimated as described above) toward category (i). In an analogous way, there is clear shift of the probabilities toward category (ii) for the cases in which the v850 index is equal to or less than that of 1986 (2.3 m/s). Consequently, we will issue real-time forecasts based on the analogue technique when the forecasted v850 index is above 2.9 m/s or below 2.3 m/s. If the forecasted v850 index is between these thresholds, we propose a climatological forecast, which consist in a probability of 0.5 for each category.
The skill of probabilistic forecasts of categorical predictands can be assessed by the Brier Score (BS, Wilks 1995), which is deined as
where N is the amount of cases of a sample of forecasts, pi the forecasted probability for a chosen category (in our case it is
category (i) for the cases of large forecasted v850 index, or category (ii) for the cases of low v850 index), and ri is an event-indicator index, equal to one if the focused category actually occurred, and zero if not. The value of the BS index is between zero and one, and the smaller it is, the better the forecast skill is. If very large probabilities pi are estimated, and the condition actually occurs, the BS index will approach to zero, while if large probabilities are estimated, but the likely condition does not occur, the BS index will approach to 1. For a climatological forecast that proposes probabilities equal to 0.5 for each category, the BS is 0.25. We deine this value as a reference Brier Score (BSref). A forecast is meaningful if it has a better (smaller) BS than this reference value, and this condition must be satisied with some minimum level of statistical signiicance. It is useful to deine the Brier Skill Score (BSS) as:
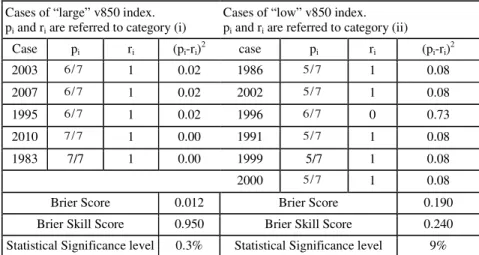
Note that if the BS equals BSrefthe BSS is zero, and for better (worse) BS than the reference, BSS is positive (negative). We compute the BS and the BSS for the hindcasts of large and low v850 index (equal or larger to that of 2003, and equal or lower than that of 1986, respectively). In Table 2 we present the individual cases with larger (left) and lower (right) v850 index, and for each case, the correspondent probability pi, the ri index of occurrence and the contribution of the individual case to the sum of Equation 1. In each case, the 7 analogues used to compute the probability pi do not include the case in
BSS=1−BS
BSref
. . (2) Figure 4 - a, hindcasted v850 index (abcissas, m/s) and the respective prec-l precipitation at RGS-NU (ordinates, mm), for each year in the period
1983 to 2010 (the 1998 case is excluded). The horizontal line indicates the median of the observed precipitation. The vertical lines indicate the 1986 and 2003 values of the v850 index. b, as a, for the hindcasted precipitation in RGS-NU at the ordinates.
BS= 1
N
i=1N
(
pi− ri)
2 , i=1,question. It is found that for the cases of large v850 index, BS is 0.012, while for the cases of low v850 index it is 0.190. The respective BSS are 0.951 and 0.240. The statistical signiicance of these BS and BSS values is computed as in Cazes Boezio et al. (2008). For the cases of high v850 index the BS and BSS are signiicant at the 0.3% level, and for the cases of low v850 index, at the 9% level.
5, DISCUSSION AND CONCLUSIONS
The observed DJF precipitation in RGS-NU shows statistically signiicant correlations with ENSO indices after the late 70’s, but not before. This increase of the correlation is consistent with the results of Kayano et al. (2008), and contributes to the potential of inter seasonal predictability of the summer precipitation in this region. However, the observed changes in this correlation in different decades imply that climatic forecasts purely based on statistical techniques are not a completely dependable alternative for this season and this region, at least while it is not clear if the change of the correlation is due to climatic trends of likely persistence in the next years, or to low frequency oscillatory processes.
Considering this, we propose a methodology to produce probabilistic precipitation forecasts for DJF in RGS-NU, based on a CGCM, the CFS v2 from NOAA (Saha et al. 2011). To this purpose, we analyze one-month-lead hindcasts from the CFS v2. The hindcasts consist of ensembles of simulations obtained with coupled atmospheric, oceanic, land and sea ice models, initialized with analyses produced by assimilation of observations. These hindcasts show that several simulated variables can predict with some skill the DJF precipitation
in RGS-NU. We selected the meridional wind at 850 hPa averaged over a speciied region as the best predictor. We ind a skill of 0.58, computed in terms of correlation between this predictor index and the observed precipitation in RGS-NU. This correlation can be considered as moderate, but at least is statistically signiicant at the 1% level.
The size of the hindcasts sample considered (27 cases), and the moderate correlation between the predictor and predicted variables (0.58) make it dificult to produce very detailed probability forecasts. As a consequence we propose to consider only two categories for the forecast of probabilities, (i), that the observed precipitation is larger or equal than its historical median, or (ii), that it is smaller. Apart from this, it is intended to determine the conditions in which the probability forecast surpasses in skill the climatological forecast (that proposes a 0.5 of probabilities for each category) with some level of statistical signiicance. We propose a technique based on analogue cases to estimate the probabilities in each category. For rather extreme cases (that occurred 11 times in the 27 hindcasts sample) the Brier skill (Wilks 1995) of the prediction is better than that of a climatological forecast with a statistically signiicance at least at the 10% level.
We would like to highlight that the hindcasted patterns of anomalous atmospheric circulation related to precipitation anomalies in RGS-NU are very realistic in their geographical structure, since they compare very well to analogous patterns obtained from analyses of observations (Figure 2). Beside this, the hindcasted patterns also agree with patterns documented in several studies and shown to be strongly associated with the variability of precipitation in SESA (Robertson Mechoso 2000, Cazes Boezio et al. 2003, Zamboni et al. 2010). It is quite
Cases of “large” v850 index. pi and ri are referred to category (i)
Cases of “low” v850 index. pi and ri are referred to category (ii)
Case pi ri (pi-ri) 2
case pi ri (pi-ri) 2
2003 6/7 1 0.02 1986 5/7 1 0.08
2007 6/7 1 0.02 2002 5/7 1 0.08
1995 6/7 1 0.02 1996 6/7 0 0.73
2010 7/7 1 0.00 1991 5/7 1 0.08
1983 7/7 1 0.00 1999 5/7 1 0.08
2000 5/7 1 0.08
Brier Score 0.012 Brier Score 0.190
Brier Skill Score 0.950 Brier Skill Score 0.240
Statistical Significance level 0.3% Statistical Significance level 9%
likely that the relative success of the CFS v2 in predicting these patterns is the base of the predictive skill found. Besides this, the forecasts may be further improved by using regional models combined with the CFS v2 outputs.
A forthcoming work explores processes involved in the change of correlation between ENSO indices and the climate of SESA after the late 70’s.
6. ACKNOWLEDGEMENTS
This work was founded by the Programa de Desarrollo Tecnológico (PDT), of the Consejo de Investigación Cientíica y Tecnológica (CONICYT), Ministerio de Educación y Cultura, Uruguay, round 63, project 281. We thank the reviewers of this article for their helpful comments.
7. REFERENCES
ACEITUNO, P. On the functioning of the Southern Oscillation. Part I: Surface Climate. Monthly Weather Review, v.116, n. 3, p.504-524, 1988.
ACEITUNO, P. On the functioning of the Southern Oscillation, Part II: Upper air circulation. Journal of Climate.v. 2, n. 4, p. 341-355, 1989.
BARREIRO, M.; CHANG, P.; SARAVANAN, R. Variability of the South Atlantic Convergence Zone as Simulated by a General Circulation Model. Journal of Climate.v. 15, n.7, p. 745-763, 2002.
BARREIRO, M.; CHANG, P.; SARAVANAN, R. Simulated precipitation response to SST forcing and potential predictability in the region of the South Atlantic Convergence Zone. Climate Dynamics, v. 24, p. 105-114, DOI: 10.1007/ s00382-004-0487-9, 2005.
BARREIRO, M; TIPPMANN, A. Atlantic modulation of El Niño inluence on summertime rainfall over Southeastern South America. Geophysical Research Letters, n. 35, L16704 doi 10.1029/2008GL035019, 2008.
CAZES, G.; ROBERTSON, A.W.; MECHOSO, C.R. Seasonal Dependence of ENSO Teleconnections over South America and Relationships with Precipitation in Uruguay. Journal of Climate. v. 16, n. 8, p. 1159-1176, 2003.
CAZES, G; MENEMENLIS, D; MECHOSO, C. Impact of ECCO Ocean-State Estimates on the Initialization of Seasonal Climate Forecasts. Journal of Climate. v. 21, n. 9, p. 1929-1947, 2008.
CHEN, M.; XIE, P.; JANOWIAK, J. E. Global Land Precipitation: A 50-yr Monthly Analysis Based on Gauge Observations. Journal of Hydrometeorology. v. 3, n. 3, p. 249-266, 2002.
COELHO C.A.S.; STEPHENSON D.B.; BALMASEDA M.;
DOBLAS-REYES, F.J.; van OLDENBORGH, G. Toward an integrated seasonal forecasting system for South America. Journal of Climate. v. 19, n. 15, p. 3704-3721, 2006. EK, M. B.; MITCHELL, K. E.; LIN, Y.; ROGERS, E.;
GRUNMANN, P; KOREN, V; GAYNO, G; TARPLEY, J. D.; Implementation of Noah land surface model advances in the National Centers for Environmental Prediction operational mesoscale Eta model, Journal of Geophysical Ressearch, v. 108 (D22), p. 8851, doi:10.1029/2002JD003296, 2003. GRIMM, A. M.; FERRAZ, S. E.; GOMES, J. Precipitation
Anomalies in Southern Brazil Associated with El Niño and La Niña Events. Journal of Climate, v. 11, n. 11, p. 2863- 2880, 1998.
GRIMM, A. M.; BARROS, V. R.; DOYLE, M. E. Climate variability in Southern South America associated with El Niño and La Niña events. Journal of Climate. v. 13, n. 1, p. 35-58, 2000.
GRIMM, A. M. The El Niño impact on the summer monsoon in Brazil: regional processes versus remote inluences. Journal of Climate, v. 16, n. 2, p. 263-280, 2003.
GRIMM, A. M. How do La Niña events disturb the summer monsoon system in Brazil? Climate Dynamics, v. 22, n.2-3, p. 123-138, 2004.
GRIMM, A. M., PAL, J.; GIORGI, F. Connection between spring conditions and peak summer monsoon rainfall in South America: Role of soil moisture, surface temperature, and topography in eastern Brazil. Journal of Climate, v. 20, n.24, p. 5929-5945, 2007.
GRIMM, A. M.; ZILLI, M. T. Interannual variability and seasonal evolution of summer monsoon rainfall in South America. Journal of Climate, v.22, n. 9, p. 2257-2275, 2009. KALNAY, E.. et al. The NCEP/NCAR 40-Year Reanalysis
Project. Bulletin of the American Meteorology Society, v. 77, n. 3, p. 437–47, 1996.
KAYANO, M. T.; DE OLIVEIRA, C. P.; ANDREOLI, R. V. Interannual relations between South American rainfall and tropical sea surface temperature anomalies before and
after 1976. International Journal of Climatology, v.
29, n. 10, p. 1439-1448, 2008.
LIEBMANN, B.; CARVALHO, L.; KILADIS, G.; VERA, C.; SAULO, C. 2004: Subseasonal Variations of
Rainfall in South America in the Vicinity of the Low-Level Jet East of the Andes and Comparison to Those
in the South Atlantic Convergence Zone. Journal of Climate, v. 17, n. 19, p. 3829-3842, 2004.
NOGUÉS-PEAGLE, J. K.; MO, K. Alternating Wet and Dry Conditions over South America during summer. Monthly Weather. Review, v. 125, n. 2, p. 279-291, 1997.
Sul do Brasil. Brazilian Journal of Geophysics, v. 18, n. 2, p. 129-146, 2000.
PISCIOTTANO, G. J.; DIAZ, A.; CAZES, G.; MECHOSO, C. R. El Niño–Southern Oscillation impact on rainfall in Uruguay. Journal of Climate, v. 7, n. 8, p. 1286-1302, 1994. REYNOLDS, R. W; RAYNER, N. A.; SMITH, T. M.; STOKES,
D. C.; WANG, W. An improved in situ and satellite SST analysis for climate. Journal of Climate, v. 15, n. 13, p. 1609-1625, 2002.
ROBERTSON, A. W.; MECHOSO, C. R. Interannual and interdecadal variability of the South Atlantic Convergence Zone, Monthly Weather Review, v. 128, n. 8, p. 22947-2957, 2000.
ROBERTSON, A. W.; FARRARA, J. D.; MECHOSO, C. R. Simulations of the Atmospheric Response to South Atlantic Sea Surface Temperature Anomalies. Journal of Climate, v.16, n. 15, p. 2540-2551, 2003.
ROPELEWSKI, C.; HALPERT, M. Global and regional scale precipitation patterns associated with El Niño-Southern Oscillation, Monthly Weather Review, v. 115, n. 8, 1606-1626, 1987.
ROPELEWSKI, C.; HALPERT, M. Precipitation patterns associated with the high index phase of the Southern Oscillation, Journal of Climate, v 2, n. 3 p. 268–284, 1989.
SAHA, S; and list of coauthors: The NCEP Climate Forecast System. Journal of Climate, v. 19, n. 15, p. 3483-3517, 2006.
SAHA, S., et al. The NCEP Climate Forecast System Version 2. To be submitted to the Journal of Climate, 2011. SALIO, P.; NICOLINI, M.; SAULO, A. C. Chaco low-level jet
events characterization during the austral summer season, Journal of Geophysical Research, 107, NO. D24, 4816, doi:10.1029/2001JD001315, 2002
SILVA, A. M.; AMBRIZZI, T.; MARENGO, J. A. Observational evidences on the modulation of the South American low level jet east of the Andes according to ENSO variability. Annales Geophysicae, v. 27, n. 2, p. 645-657, 2009. WILKS, D. S. Statistical Methods in the Atmospheric
Sciences. Academic Press, 1995. 464 p.
XIE, P.; ARKIN, P. A. Global precipitation: A 17-year monthly analysis based on gauge observations, satellite estimates, and numerical model outputs. Bulletin of the American Meteorological Society, v. 78, p. 2539 – 2558, 1997. ZAMBONI, L.; MECHOSO, C.; KUCHARSKI, F. Relationships