O
RIGINALA
RTICLE Revista Brasileira de FisioterapiaAssessment of resistance torque and resultant
muscular force during Pilates hip extension
exercise and its implications to prescription
and progression
Análise do torque de resistência e da força muscular resultante durante exercício
de extensão de quadril no Pilates e suas implicações na prescrição e progressão
Mônica O. Melo, Lara E. Gomes, Yumie O. Silva, Artur Bonezi, Jefferson F. Loss
Abstract
Background:The understanding of the external mechanics of Pilates exercises and the biomechanics of the joints may guide the
prescription of rehabilitation exercises. Objectives:Toevaluatethe resistance torque (ΓR) during hip extension (HE) exercises performed
on the Pilates Cadillac. To perform a biomechanic analysis of the ΓR and the weighted mean moment arm (WMMA) in order to calculate
the resultant muscle force (FMR) of the hip extensors and flexors. To present a mechanical criteria for progression of HE exercise on
the Pilates Cadillac. Methods: Fourteen participants performed HE exercises on the Cadillac in four randomly assigned situations –
using two springs (blue and red), which were attached in two positions (high and low). Angular positions were measured using an
electrogoniometer. In order to calculate ΓR, the muscle torque (ΓM) and FMR, free-body diagrams and movement equations were used.
The WMMA of the hip extensors and flexors were estimated from the literature. Results:The ΓR and FMR presented a similar behavior
during all situations; however, the maximum ΓR values did not occur at the same joint position as the FMR maximum values. The WMMA
of the hip flexors presented an increased- decreased behavior with greatest values around 55° of flexion, while the hip extensors
presented a similar behavior with greatest values around 25° of flexion. Conclusion: Biomechanic analysis of HE exercises and the
evaluation of mechanical features in relation to the hip joint may be used as an objective criteria for the prescription and progression of HE exercise in Pilates.
Key words: hip extension; Pilates; torque; moment arm.
Resumo
Contextualização:A análise damecânica externa dos exercícios de Pilates e da biomecânica das articulações pode subsidiar a
prescrição de exercícios na reabilitação. Objetivos:Avaliar o comportamento do torque de resistência (ΓR) do exercício de extensão de
quadril (EQ) realizado no Cadillac; realizar uma análise biomecânica a partir do comportamento do ΓR e das distâncias perpendiculares
médias ponderadas (DPMPs) para estimar a força muscular resultante (FMR) dos extensores e flexores e propor critérios mecânicos
para progressão do exercício de EQ realizado no Cadillac. Métodos:Catorze praticantes de Pilates realizaram EQ no aparelho Cadillac
em quatro situações em ordem aleatorizada – usando duas molas (vermelha e azul) fixadas em duas posições (alta e baixa). As
posições angulares foram coletadas por meio de eletrogoniometria. Para o cálculo do ΓR, torque muscular (ΓM) e da FMR foram
usados diagramas de corpo livre e equações de movimento. Os valores de DPMP dos músculos flexores e extensores do quadril
foram quantificados usando dados da literatura. Resultados: O ΓR e a FMR apresentaram comportamentos semelhantes em todas as
situações, entretanto os valores máximos de ΓR não ocorrem na mesma posição articular que a FMR máxima. A DPMP dos flexores
de quadril apresentou um comportamento crescente-decrescente, com máximo próximo aos 55º de flexão, enquanto os extensores
de quadril apresentaram comportamento semelhante, com máximo próximo aos 25º de flexão. Conclusão:A análise biomecânica do
exercício e a avaliação das características mecânicas associadas à articulação do quadril podem ser usadas como critérios objetivos de prescrição e progressão do exercício de EQ no Pilates.
Palavras-chave: extensão do quadril; Pilates; torque; braço de momento.
Received: 05/09/2009 – Revised: 10/03/2010 – Accepted: 03/09/2010
Laboratory of Research in Exercise, Universidade Federal do Rio Grande do Sul (UFRGS), Porto Alegre, RS, Brazil
Introduction
Developed by Joseph Pilates (1880-1967), the Pilates method has a general purpose to develop the power house
muscles (anterior abdominals, spinal extensors, hip extensors, hip lexors and the deep pelvis muscles)1,2. In physical therapy,
the Pilates method has been used for several purposes, such as: restoration of joint function3,4, lumbar-pelvic stabilization1,5,
ibromyalgia control6 and the treatment of low back pain3,7.
To reach these objectives, therapists can count on land based exercises and exercises perfomed on special equipments, such as the Reformer, the Barrel and the Cadillac. On the tradicional Cadillac, one of the movements commonly used to promote trunk stabilization and the recovery of functional and ana-tomic integrity of the hip joint is the hip extension (HE) with extended knees3,8,9. When HE is performed with the subjects
positioned in supine on the equipment, the external load is obtained mainly from the external springs with diferent constants of strain and from the variation of the equipment’s spring vertical regulation ( ixed height)10.
In genneral, it has been recommended that rehabilita-tion programs use the exercises with progressive intensities according to the necessities of each patient11-12. However,
when Pilates’ exercises are used in clinical practice, it is ob-served that the external loads are chosen based on subjec-tive information, such as the substitution of a less resistent spring to another with higher resistance, without noticing the amount of resistance offered in both situations10.
There-fore, when the process is performed this way, the definition of intensity used in the exercise is almost exclusively based on patient’s feedback and on professional experience. Aim-ing to enrich the prescription of Pilates exercises, Silva et al.10 showed that for the HE exercise performed on the
Ca-dillac, it is possible to combine the constant of the spring’s strain and its positioning on the equipment as an objective criteria for the selection of the intensities of the exercises. The reason for this is that the sping’s strength (given by the constant of strain and the variation of its length) in addition to its respective perpendicular distance (directly determined by the fixation site of the spring) compose the resistance torque (TR) offered by this exercise, during the
ex-ercise range of motion (ROM). Thus, in clinical practice, ΓR
assessment (which considers the variations in the constant of strain and the fixation height of the spring) may provide useful quantitative data for progressing the intensity of the program over the course of the treatment and also indicate in which joint position the external load is maximum11,13-15,
allowing clinicians to prioritize strength gains in specific ranges of motion.
In spite of the importance of determining the ΓR ofered by the exercises, its quantiication alone is not enough to in-dicate the level of muscle efort resulting from the exercises. Another important factor is the mechanical characteristic of the muscles involved in the exercise (perpendicular distance of the muscle), which composes the muscle torque (TM) which then counteracts the ΓR13-16. he muscle perpendicular
distance or muscle moment arm is the distance between the action line of the muscle (on tendon insertion) and the joint rotation center15,16. he size of the perpendicular distance of a
muscle represents a “mechanical advantage” of the muscle in a joint, and its measurement can assist in the understanding of muscle function17. hus, considering that the T
M does not
always increase in the same proportion of ΓR and that the ΓR
ofered by an equipment may not comply with the mechani-cal characteristics of the involved muscles, it is believed that the combined analysis of these factors can avoid the risk of excessive overload of human structures and/or enhance the speciicity of the efort planned.
In spite of the popularity of the exercises performed on the Cadillac equipment, in physical therapy, there is a lack of scien-tiic research focusing on biomechanical analysis (TR analysis) of the equipment and its relation to the mechanical characteristics of joints (perpendicular distance)8,10,18,19. In this context, the
pur-poses of the present study were: a) to assess the behavior of the TR ofered by HE exercises on the Cadillac, using springs with dif-ferent constants of strain and ixed heights; b) to perform a bio-mechanical analysis of the ΓR behavior and the weighted mean moment arm (WMMA) of the muscles in order to estimate the resultant muscle force (FMR) of the hip extensors and lexors during the exercise and c) to propose a mechanical criteria for the progression of HE exercises on the Cadillac.
Methods
Sample
he sample was composed of 14 female subjects (30,9±8,6 years-old; 1,60±0,04 m; 55,5±4,3 kg). he inclusion criteria were the current practice of Pilates, for at least six months, and the absence of musculoskeletal injuries (current or treated), which were informed by the participants. All par-ticipants signed a consent form. his study was approved by the Research Ethics Committee of the Universidade Federal do Rio Grande do Sul (UFRGS), Porto Alegre, RS, Brazil, under the protocol nº 2007903, approved in the meeting nº 43, registra-tion protocol nº 123 of January 22th of 2009.
Data acquisition and analysis
Assessment Protocol
The Cadillac allows the use of springs of different colors. Each color represents a level of resistance or the spring’s constant of strain. In the present study, the springs were calibrated before data collection20. The constant of strain
found were 0,30 kg/cm for the blue spring and 0,39 kg/cm for the red spring. Since the springs can be positioned in several heights, for the exercise of interest, two heights were chosen: high (86 cm in relation to the subject’s level) and low (20 cm in relation to the subject’s level) (Figure 1). Each series of the HE exercises were performed with one spring and one height randomly selected. Data acquisition consisted of the execution of four series of five trials of HE exercises on the Cadillac, initiating from a angle of hip flexion of 90° degrees until 0° degrees, after a stretch ses-sion of the trunk and lower limbs performed on the same device.
Electrogoniometry
The angular positions of the hip during data collection were recorded by an electronic goniometer (Miotec Bio-medical Equipments Ltda, POA, Brazil), with a sampling rate of 2000 Hz. The signals of electrogoniometry were fil-tered by a band-pass digital filter butterworth, third order, with a cutoff rate of 3 Hz, with the support of the software SAD32, version 2,61. 07mp, previously used by Loss and Candotti13.
Resistance and muscle torques
The analysis of ΓR and ΓM were conducted according to recommendations from Loss e Candotti13, based on the
construction of free-body diagrams (FBD) from the body segments during movement. Figure 2a illustrates the FBD in an intermediate position of the ROM, designed in the plane of execution of the exercise. The weight is repre-sented in the center of mass of the lower limb21; the springs’
strength is represented acting in the distal extremity of the segment; the resulting joint strength, acting on hip joint axis and the resultant muscle torque, acting on hip joint. Casual movements of the pelvis or even the lumbar spine were considered to be irrelevant, limiting the analysis to the hip, both at the joint and the muscle levels. Although this simplification may be considered a limitation of this model, the low load chosen for the exercises associated to the level of training and to the healthy condition of the participants are mitigating factors that support this approach.
Based on the FBD, the following equations of translation, (Equation 1) and rotation (Equation 2) that governs the move-ments were written:
F maCM ==>
AR CM
MO P F ma
F
I
==>
I
MO P M
(1)
(2)
in which, on equation 1,
F represents the sum of allthe forces (FMO - spring strength;
P - weight of the segment;
AR
F - resultant joint strength) that act on the mass (m) leading
to an acceleration aCM of the center of mass. On equation
2,
represents the sum of all the torques (M- muscletorque; P - torque of the segment weight;
MO - torque of
spring strength) which equal to the inertial moment (I) of the segment, generating an angular acceleration I.
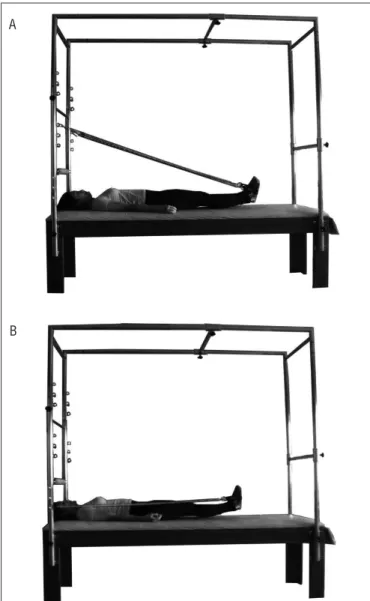
Figure 1. Hip extension exercise on the Cadillac at final position. (a) Spring at high position; (b) Spring at low position.
A
According to Loss and Candotti13, when the exercise is
executed slowly (<30º/s), the inertial efects can be irrelevant. Considering the extension torque as positive, the equation 2 can be rewrite in its scalar form, as equation 3:
0 =
,
−
,
+
,M P MO or ,M =,MO−,P (3)
where the diference between the ΓMO and the ΓP is the
ΓR10. According to Winter21
, when the movement is performed
at low velocities without reaching the extremes of the joint range of motion, the efects of the passive structures, such as ligaments or tendons, under the ΓM can be disregarded. How-ever, in situations when the co-contraction of antagonist mus-cle groups happens, the ΓM represents the net efect of muscle activity. In this perspective, and according to the convention adopted, when ΓM is positive, there will be a predominance
of extensors activity and, when negative, a predominance of lexors activity.
he perpendicular distances of the spring strength (D MO
┴)
and of the segment weight (D P
┴) were obtained from
trigono-metric relationships (Figure 2b) by the direct measurement of the hip angle through the entire ROM and the measurement of the angle between the spring and the human segment and of the corresponding distances at the begining and at the end of the movement. To assess the FMO through the entire ROM, trig-onometric relationships associated to the coeicients of sprain from the springs determined by the calibration were used. he inertial parameters used (weight and position of the center of mass of the segments involved in the segments thigh-leg-foot segment) were estimated through anthropometric tables ob-tained in the literature21.
Resultant muscular force and weighted mean moment arm
The WMMA is the result from the sum of the products between the perpendicular distance of each muscle (d┴) and its respective physiological cross-sectional area (PCSA) divided by the sum of the cross-sectional areas of the muscles13,14 (Equation 4). In the present study, HE muscles
included: biceps femoris, semitendinosus, semimembra-nosus and gluteus maximus and flexor muscles included: rectus femoris, psoas, iliacus, sartorius and tensor fasciae latae. The WMMA and the PCSA were determined from the literature22-25:
DPMP =
di ┴ ASTFi
∑
ni =1 ASTFi
∑
ni =1
(4)
where:
dM┴ = weighted mean of the muscle perpendicular distance
di┴= perpendicular distance of the muscle i
ASTFi = physiological transverse section área of the muscle i n = number of muscles included
Since the ΓR is equal to the ΓM, the FMR was determined dividing the ΓR by the WMMA of the muscular group in-volved, for example, when the ΓM was extensor, the ΓR was divided by the WMMA of the hip flexors (Equation 5). The calculation necessary for the quantification of the ΓR and theFMR were developed using Excel (version 2007, Microsoft Windows). For further statistical analysis, the mean of the values corresponding to each 10°of the assessed ROM were calculated.
FMR = DPMP
R (5)
Figure 2. (a) Free-body diagram of the thigh-leg-foot segment. (b) Trigonometric deduction used for calculating of the moment arm of weight force and of spring force.
B A
Statistical analysis
he equivalence of the variances (Levene Test) and the nor-mality of data (Shapiro-Wilk) were both veriied and conirmed. Analysis of variance (ANOVA) of the three factors (spring, spring height and angle) were performed to verify diferences for the results of ΓR and FMR. he main efects were examined by the post hoc Bonferroni test. For all analysis performed, the level of signiicance adopted was 0,05.
Results
Since the exercise of interest starts at an angle of 90° de-grees of hip lexion and goes until 0° dede-grees, all graphs must be observed from right to left. Figure 3 shows the average behavior of the ΓR along the angle of hip lexion for both springs used (blue and red), at high and low heights. Considering equation 3, ΓM is equal to ΓR, but with opposite signals (negative). he WMMA was calculated using equation 4, and values presented along the hip lexion angles are shown on Figure 3c. Figure 3b shows the average behavior of the FMR along the angles of hip lexion for both the springs, at high and low heights.
Table 1 presents mean and standard-deviation values of
ΓR for each 10 degrees of ROM assessed and the result of the comparisons. Table 2 presents mean and standard-deviation values of the FMR for each 10 degrees of ROM assessed and the result of the comparisons.
Discussion
he methodological approach used in the present study aimed to identify the external demand imposed on the muscles from a mechanical point of view and to estimate the resultant muscle efort, based on the theoretical information associ-ated to WMMA from the most important muscles acting on the movement studied. In spite of the limitations from this approach, described on the methodological section of the present study, previous studies, not related to Pilates, showed that a mechanical analysis of the external demand ofered by an exercises and the estimative of the resultant muscle efort made from biomechanical techniques, as a representation of the acting strengths through FBD and the use of movement equations, can be used objectively for the prescription of exer-cises during training and rehabilitation programs11-16.
he analysis and investigation of the biomechanics of Pi-lates exercises gained great value, given the wide spread of this modality in clinical practice. From a physical therapy point of view, the evaluation of the behavior of external loads along the
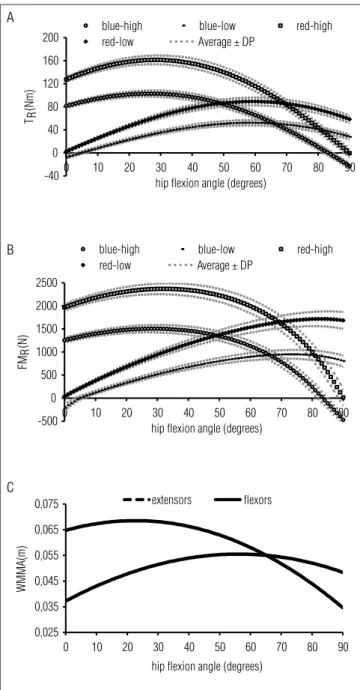
Figure 3. (a) Behaviour of the ΓR in relation to hip flexion angles obtained with blue and red springs at low and high positions. (b) Behaviour of the FMR in relation to hip flexion angles obtained with blue and red springs at low and high positions. (c) Behavior of the WMMA of the hip extensors and flexors in relation to hip flexion angles. The exercise starts when the hip flexion angle is 90°, while 0° refers to maximum extension of the hip.
-40 0 40 80 120 160 200
0 10 20 30 40 50 60 70 80 90
TR (Nm)
hip flexion angle (degrees)
blue-high blue-low red-high
red-low Average ± DP
-500 0 500 1000 1500 2000 2500
0 10 20 30 40 50 60 70 80 90
FM
R (N)
hip flexion angle (degrees)
blue-high blue-low red-high
red-low Average ± DP
0,025 0,035 0,045 0,055 0,065 0,075
0 10 20 30 40 50 60 70 80 90
WMMA(m)
hip flexion angle (degrees)
extensors flexors
A
B
C
In general, the results from the present study corrobo-rate the literature, since the maximum FMR were not always
reached when the ΓR reached maximum values during HE
exercises on the Cadillac11,12,14,15. he explanation for this
ind-ing is that by deinition, the ΓM also depends on the behavior
and size of the WMMA involved in the analysis. According to Chain, Anderson and Martin26, during dynamic situations, as
the joint angle changes, the perpendicular distance from the muscle also changes.
In the present study, it was observed that when the ex-ercise was performed with the springs (red and blue) in the high position, the ΓR increased sharply, reaching a plateau
next to the angles of 20º and 30º (Figure 3a), and then de-creased until the end of HE; whereas the FMR seemed to
pres-ent a plateau at the angles of 30º and 40º (Figure 3b). his behavior was conirmed with statistical signiicance in the comparison that was performed for each 10 degrees (Tables 1 and 2). hese diferences observed between joint position and occurrence of peak values of ΓR and FMR probably happened
because of the behavior of the WMMA from the extensors,
which is crescent from the start of the extension and reaches its maximum value at the same range observed for the ΓR,
which can lead to a lower necessity of muscle efort in this region. However, it is still important to note that the HE exercises performed with the high spring will not always be easiest in the ranges where the WMMA is maximal, since the
ΓM will also depends on the capacity of muscle strength
pro-duction. Among other factors, muscle strength production will depend on the relation strength-length27,28, which states
that the production of muscle strength depends on the length of the muscle ibers and their constituting sarcomeres. hus, although this relationship was not assessed experimentally in the present study, it is reasonable to suggest that, close to complete extension, because of the contraposition of thin ilaments in shortened muscle regions, there is lower capac-ity to produce strength29,30, which can or not be compensated
by an advantage in WMMA.
When the exercise is performed with the spring ixed at low height, it is observed that the ΓR increases a little at the
begin of the movement until an angle close to 60° and, then,
Table 2. Average and standard deviation of resultant muscle force (FMR), in N, during all evaluated situations (different springs and positions) and the results of statisticc comparisons.
Different letters indicate significant differences between the angles for each condition (same column); Different Roman numerals indicate significant differences between different conditions of exercise for the same angle (same row).
Angles (degrees) Blue Spring Red spring
High position Low position High position Low position
10 I1326.68 (±63.83)a II -13.58 (±107.48)a III1978.73 (±356.05)a IV212.89 (±35.62)a
20 I1437.53 (±78.94)b II234.03 (±36.30)b III2250.13 (±92.39)b IV532.20 (±44.01)b
30 I1491.65 (±87.46)c II431.59 (±43.07)c III2345.2 (±814.66)c IV814.66 (±58.22)c
40 I1489.04 (±85.79)c II602.19 (±52.42)d III2362.33 (±121.47)c IV1063.27 (±74.15)d
50 I1409.85 (±94.32)d II744.60 (±62.83)e III2292.93 (±134.17)d IV1278.46 (±134.17)e
60 I1245.53 (±102.23)e II855.18 (±73.72)f III2121.11 (±146.08)e IV1458.39 (±107.16)f
70 I969.78 (±109.96)f I926.76 (±85.08)g II1817.88 (±157.88)f III159.45 (±124.42)g
80 I532.90 (±5.67)g II945.17 (±97.36)g III1328.29 (±171.05)g IV1689.08 (±143.36)h
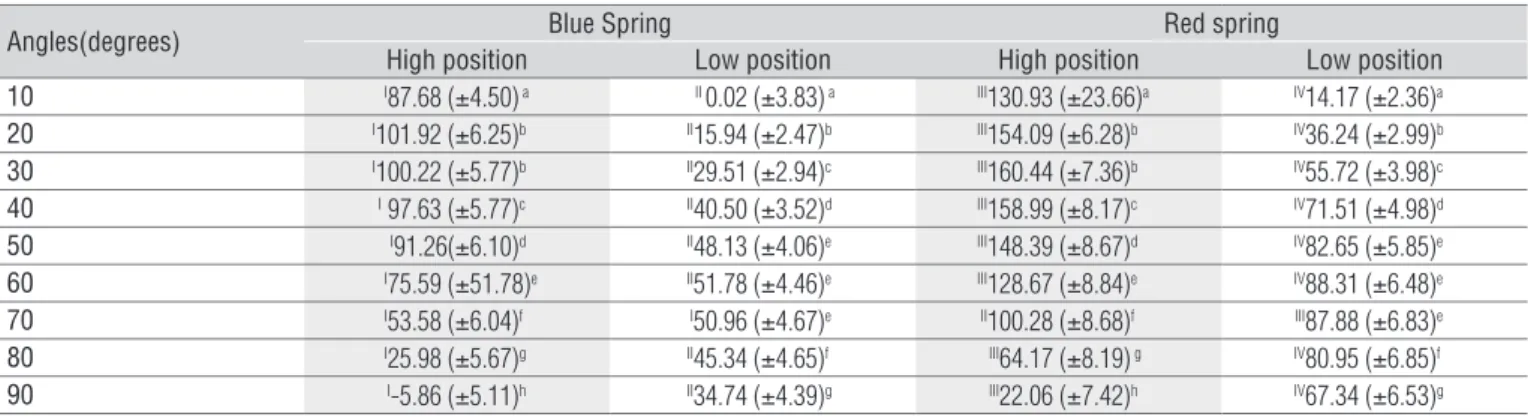
90 I-111.87 (±235.14)h II878.89 (±111.95)h III539.60 (±329.07)h IV1708.77 (±166.45)h Table 1. Average and standard deviation of resistance torque (ΓR), in Nm, during all evaluated situations (different springs and positions) and the
results of statistic comparisons.
Different letters indicate significant differences between the angles for each condition (same column); Different Roman numerals indicate significant differences between different conditions of exercise for the same angle (same row).
Angles(degrees) Blue Spring Red spring
High position Low position High position Low position
10 I87.68 (±4.50)a II 0.02 (±3.83)a III130.93 (±23.66)a IV14.17 (±2.36)a
20 I101.92 (±6.25)b II15.94 (±2.47)b III154.09 (±6.28)b IV36.24 (±2.99)b
30 I100.22 (±5.77)b II29.51 (±2.94)c III160.44 (±7.36)b IV55.72 (±3.98)c
40 I 97.63 (±5.77)c II40.50 (±3.52)d III158.99 (±8.17)c IV71.51 (±4.98)d
50 I91.26(±6.10)d II48.13 (±4.06)e III148.39 (±8.67)d IV82.65 (±5.85)e
60 I75.59 (±51.78)e II51.78 (±4.46)e III128.67 (±8.84)e IV88.31 (±6.48)e
70 I53.58 (±6.04)f I50.96 (±4.67)e II100.28 (±8.68)f III87.88 (±6.83)e
80 I25.98 (±5.67)g II45.34 (±4.65)f III64.17 (±8.19)g IV80.95 (±6.85)f
90 I-5.86 (±5.11)h II34.74 (±4.39)g III22.06 (±7.42)h IV67.34 (±6.53)g
decreases in a sharper form. In this situation, the statistical analysis also revealed a plateau between the angles of 50º, 60º and 70º (Table 1). As the crescent behavior of the WMMA is determinant in the production of ΓM, the maximum values of FMR occurred in longer muscle lengths than those of the ΓR, near 70-80º for the blue spring and 80-90º for the red spring (Table 2), sites where in theory there is a higher contribution of the elastic components of the musculoskeletal system for the production of muscle strength29. On the other hand, at the
end of the ROM (close to complete extension), the WMMA increased and reached a signiicant plateau, whereas the ΓR
and the FMR decreased (Figure 3). In the situation, in which the external demand at the end of the ROM is low (reduction of the ΓR), there is an apparent reduction in the external load over the muscles and joints. However, in clinical practice, it is not known how far the WMMA will compensate for a pos-sible lower capacity of strength due to the smaller muscle lengths at this ROM.
Typically, the recovery of ROM and muscle strength are rehabilitation goals, derived from muscle weakness from joint degenerative and chronic processes, or even from the recovery after a surgery31,32. Irrespective of the condition,
exercises must have progressive loads and respect joint mechanics. Considering the hip case, it is important to use knowledge of the capacity of production of FMR and WMMA, which, together, execute the movement of extension (ham-strings and gluteus maximums), as criteria for the prescrip-tion and progression of exercises. The administraprescrip-tion of resistance in ranges with higher mechanical advantages can promote a lower overload of musculoskeletal structure. On the other hand, if the peak of resistance is administered in ranges where the perpendicular distance is disadvantaged, there will be a higher overload. In addition to the evaluation of the WMMA, the present study suggest therapists to also consider the capacity of torque production associated to the joint ranges involved, considering the theoretical assump-tions in which the relaassump-tionship strength-length is based27-30.
However, these analysis shall be done cautiously, since the relation strength-length is a static and discrete property of the muscles and shall be used only to support the compre-hension of muscle strength during dynamic tasks33.
In general, when performing HE exercise on the Cadil-lac, therapist can vary the spring heights with the purpose to focus the work at the angular patch in which the higher external demand occurs and, posteriorly, vary the spring colors to modulate the intensities in specific joint ampli-tude. Thus, for example, if the objective is ROM recovery
and the patient has little flexion ROM (about 60), it is recommended to initiate the treatment with the high spring, using the blue color at first , and then change the color to red, a variation that promotes a gradual increase of FMR (Table 2). The option for the high spring presents an advantage to generate a higher load on patient’s available ROM and also to act on the muscles in a more stretched position, which may stimulate the addition of sarcomeres in serie34. This change on the structure of the muscle tissue
has been pointed out as an imported factor for the increase in ROM and the higher capacity of force production in lon-ger muscle lengths35. In the next phase of treatment, when
the patient reaches ranges of motion close to 80º degrees, it would be possible to choose the spring at lower posi-tions, since these positions loads to a higher resistance to extension.
Another possibility for the use of the present results can be illustrated in situations of rehabilitation of athletes with speciic demands according to the sports modalities. In this perspective, at the inal stages of rehabilitation of muscle inju-ries , such as muscle strain or muscle spasms, it is possible to prescribe exercises that aim to prioritize the gain of strength in speciic ROM31,32. hus, athletes that by the imposition of
their sport require a higher efort close to extreme angles of hip lexion, such as in cycling36, could exercise with low
spring heights, initiating with the blue spring and, posteriorly, changing to the red spring. In the case where the sport re-quired activities at higher HE angles, such as for runners, the proposal would be to perform the exercises with the spring in higher positions36.
Conclusion
References
1. Muscolino JE, Cipriani S. Pilates and the ‘‘powerhouse’’. J Bodyw Mov Ther. 2004;8(1):15-24.
2. Latey P. The Pilates method: history and philosophy. J Bodyw Mov Ther. 2001;5(4):275-82.
3. Rydeard R, Leger A, Smith D. Pilates-based therapeutic exercise: effect on subjects with nonspecifc chronic low back pain and functional disability: a randomized controlled trial. J Orthop Sports Phys Ther. 2006;36(7):472-84.
4. Levine B, Kaplanek B, Scafura D, Jaffe WL. Rehabilitation after total hip and knee arthroplasty: a new regimen using Pilates training. Bull NYU Hosp Jt Dis. 2007;65(2):120-5.
5. Queiroz BC, Cagliari MF, Amorim CF, Sacco, IC. Muscle activation during four pilates core stability exercises in quadruped position. Arch Phys Med Rehabil. 2010;91(1):86-92.
6. Altan L, Korkmaz N, Bingol U, Gunay B. Effect of pilates training on people with fibromyalgia syndrome: a pilot study. Arch Phys Med Rehabil. 2009;90(12):1983-8.
7. Donzelli S, Di Domenica F, Cova AM, Galletti R, Giunta N. Two different techniques in the rehabilitation treatment of low back pain: a randomized controlled trial. Eura Medicophys. 2006;42(3):205-10.
8. Bernardo LM. The effectiveness of Pilates training in healthy adults: An appraisal of the research literature. J Bodyw Mov Ther. 2007;11(2):106-10.
9. Herrington L, Davies R. The influence of Pilates training on the ability to contract the transversus abdominis muscle in asymptomatic individuals. J Bodyw Mov Ther. 2005;9(1):52-7.
10. Silva YO, Melo MO, Gomes LE, Bonezi A, Loss JF. Analysis of the external resistance and electromyographic activity of the hip extension performed according to the Pilates method. Rev Bras Fisioter. 2009;13(1):82-8.
11. Toledo JM, Ribeiro DC, Loss JF. Critérios mecânicos para progressão de exercícios de rotação interna e externa do ombro no plano sagital. Rev Bras Fisioter. 2007;11(1):49-56.
12. Ribeiro DC, Loss JF, Cañeiro JPT, Lima CS, Martinez FG. Electromyographical analysis of the quadríceps during knee extension at different speeds. Acta Ortop Bras. 2005;13(4):189-93.
13. Loss J, Candotti CT. Comparative study between two elbow flexion exercises using the estimated resultant muscle force. Rev Bras Fisioter. 2008;12(6):502-10.
14. BiniRPR, Carpes FP, Toledo JM, Loss JF. Estimativa das forças na articulação tibio-femoral no exercício de extensão dos joelhos em cadeia cinética aberta realizado em máquina de musculação. Rev Bras Cineantropom Desempenho Hum. 2008;10(1):35-42.
15. de Toledo JM, Krug RC, Castro MP, Ribeiro DC, Loss JF. Torque and force production during shoulder external rotation: differences between transverse and sagittal planes. J Appl Biomech. 2008;24(1):51-7.
16. Nigg BM, Herzog W. Biomechanics of the musculo-skeletal system. 2nd.West Sussex: John Wiley
& Sons Ltd; 1999.
17. Liu J, Hughes RE, Smutz WP, Niebur G, Nan-An K. Roles of deltoid and rotator cuff muscles in shoulder elevation. Clin Biomech (Bristol, Avon). 1997;12(1):32-8.
18 La Touche RL, Escalante K, Linares MT. Treating non-specific chronic low back pain through the Pilates method. J Bodyw Mov Ther. 2008;12(4):364-70. Epub 2008 Feb 1.
19. Souza MVS, Vieira CB. Who are the people looking for the Pilates method? J Bodyw Mov Ther. 2006;10(4):328-34.
20. Loss JF, Koetz AP, Soares DP, Scarrone FF, Hennemann V, Sacharuk VZ. Quantificação da resistência oferecida por bandas elásticas. Rev Bras Ciênc Esporte. 2002;24(1):61-72.
21. Winter DA. Biomechanics and Motor Control of Human Movement. 3ª ed. New York: John Wiley Professio; 2004.
22. Németh G, Ohlsén H. In vivo moment arm lengths for hip extensor muscles at different angles of hip flexion. J Biomechanics. 1985;18(2):129-40.
23. Visser JJ, Hoogkamer JE, Bobbert MF, Huijing PA. Length and moment arm of human leg muscles as a function of knee and hip-joint angles. Eur J Appl Physiol Occup Physiol. 1990;61(5-6):453-60.
24. Delp SL, Loan JP, Hoy MG, Zajac FE, Topp EL, Rosen JM. An interactive graphics-based model of the lower extremity to study orthopaedic surgical procedures. IEEE Trans Biomed Eng. 1990;37(8):756-67.
25. Brand RA, Pedersen DR, Friederich JA. The sensivity of muscle force predictions to changes in physiologic gross-sectional area. J Biomech. 1986;19(8):589-96.
26. Chaffin DB, Anderson GBJ, Martin B. Biomecânica Ocupacional. Belo Horizonte: Ergo; 2001.
27. Granzier HLM, Akster HA, TerKeurs HE. Effect of thin filament length on the force-sarcomere length relation skeletal muscle. Am J Physiol. 1991;260(5 Pt 1):C1060-70.
28. Gordon AM, Huxley AF, Julian FJ. The variation in isometric tension with sarcomere length in vertebrate muscle fibres. J Physiol. 1966;184(1):170-92.
29. Huxley AF, Niedergerke R. Structural changes in muscle during contraction; interference microscopy of living muscle fibres. Nature. 1954;173(4412):971-3.
30. Rassier DE, MacIntosh BR, Herzog W. Length dependence of active force production in skeletal muscle. J Appl Physiol. 1999;86(5):1445-57.
31. Torry MR, Schenker ML, Martin HD, Hogoboom D, Philippon MJ. Neuromuscular hip biomechanics and pathology in the athlete. Clin Sports Med. 2006;25(2):179-97.
32. Paluska SA. An overview of hip injuries in running. Sports Med. 2005; 35(11):991-1014.
33. Astrand PO, Rodahl K, Dahl HA, Sromme SB. Tratado de Fisiologia do Trabalho – Bases Fisiológicas do Exercício. São Paulo: Artmed; 2006.
34. Reeves ND, Maganaris CN, Narici MV. Effect of strength training on human patella tendon mechanical properties of older individuals. J Physiol. 2003;548(3):971-81.
35. Reeves ND, Narici MV, Maganaris CN. Effect of resistance training on skeletal muscle-specific force in elderly humans. J Appl Physiol. 2004;96(3):885-92. Epub 2003 Oct 24.
36. Herzog W, Guimaraes AC, Anton MG, Carter-Erdman KA. Moment-length relations of rectus femoris muscles of speed skaters/cyclists and runners. Med Sci Sports Exerc. 1991;23(11):1289-96.