Artigo
*e-mail: [email protected]
GROUNDWATER QUALITY COMPARISON BETWEEN RURAL FARMS AND RIPARIAN WELLS IN THE WESTERN AMAZON, BRAZIL
Nei K. Leite*, Alex V. Krusche, Giovana M. Cabianchi, Maria Victoria R. Ballester e Reynaldo L. Victoria
Centro de Energia Nuclear na Agricultura, Universidade de São Paulo, Av. Centenário, 303, 13416-903 Piracicaba - SP, Brasil Margarida Marchetto e Judes G. dos Santos
Universidade Federal de Rondônia, Campus de Ji-Paraná, Rua Rio Amazonas, 351, 76900-726 Ji-Paraná - RO, Brasil
Recebido em 28/10/09; aceito em 30/7/10; publicado na web em 17/11/10
Groundwater quality of a riparian forest is compared to wells in surrounding rural areas at Urupá River basin. Groundwater types were calcium bicarbonated at left margin and sodium chloride at right, whereas riparian wells exhibited a combination of both (sodium bicarbonate). Groundwater was mostly solute-depleted with concentrations within permissible limits for human consumption, except for nitrate. Isotopic composition suggests that inorganic carbon in Urupá River is mostly supplied by runoff instead of riparian groundwater. Hence, large pasture areas in addition to narrow riparian forest width in this watershed may have an important contribution in the chemical composition of this river.
Keywords:hydrochemistry; shallow and artesian wells; Rondônia.
INTRODUCTION
Since ancient times groundwater has been the main source of potable water in regions suffering drastic surface water deicit as well as those lacking water treatment units. Several authors have emphasized that groundwater chemistry is highly variable, either seasonally or spatially and, in general, is adequate for both human and animal consumption and irrigation purposes.1-4 With increasing potable water scarcity the use of groundwater as an alternate resour-ce in several countries have turned this into an extremely exploited source of drinking water.5 The consequences of this process brought not only beneits (for social and economical purposes) but also signiicant resource sustainability problems as ineficient use of this natural resource, social inequity in access to groundwater, irreversible aquifer damage, etc.6
Deforestation in the Amazon region has resulted in the fast shifting of natural vegetation into other land uses, mostly extensive pasture ields.7,8 In this process a large number of settlers have occu-pied regions where precarious conditions prevail (e.g. no electricity, piped water, sewage disposal, etc). Rondônia State in Brazil clearly portrays this situation, mainly after massive migrations during the 70’s, when a large amount of farmers (especially from southern re-gions) was stimulated by government to move to this state in order to start the occupation of the new “agricultural frontier”.9
Since the early stages of these new settlements, water supply in rural areas of Rondônia was usually obtained by pumping groundwa-ter from both shallow and semi-artesian wells (tubular). The wells were usually selected according to the phreatic surface level, with the latter being drilled to much deeper depths.10
Little information is available on groundwater quality in the Amazon region, most of it focusing on urban wells and a few on forest and pasture areas. 11-16
The lack of reliable data on groundwater quality is currently a serious limiting in rural water-supply project designs and an effective monitoring program should be developed in order to improve rural drinking-water supply.17
Hence, in order to increase the knowledge about the chemistry of this important water resource, this study focused the comparison of groundwater chemistry dynamics in more pristine riparian wells against those located in rural areas, both located in an intensively deforested area in the Amazon region.
EXPERIMENTAL
Site description
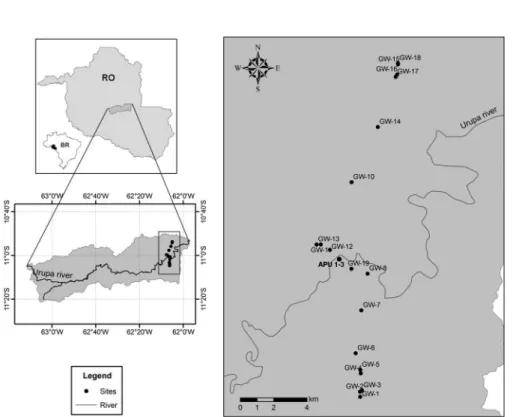
The study was performed at the Urupá River basin in the state of Rondônia, Western Amazonia (Figure 1S, supplementary material). Climate in the region is characterized by a mean annual temperature of 25.6 ºC and a mean annual precipitation of approximately 2,000 mm, based on measurements from 2000 to 2008 at Ji-Paraná city,18 most of which falls as rain between November and April; this value is close to reported in other studies in Rondônia.19,20
Ballester et al. provides a detailed description of the Urupá basin. According to these authors, the total area is 4,209 km2, with 49.9% occupied by forest and 42.6% with pasture. In general, this watershed exhibit eutrophic soils, with high cation content, and these characteristics are also relected in Urupá River, which is one of the rivers with highest ionic content and electrical conductivities in the Ji-Paraná basin.21,22
January-February 2008, corresponding to a rainy period of the wet season and also during a single week in July 2008, which corresponds to the driest month along the dry season (precipitation < 50 mm).
Additional information about the rural wells such as age, ins-tallation, protective covering, distance from the closest source of contamination and maintenance were obtained by ield observation and from local farm owners.
Experimental design
In forest wells, a peristaltic pump was employed to draw water to the surface, and sub-samples were taken for analysis after 30-min lushing to ensure sampling of fresh groundwater.23 At the rural wells, a Niskin bottle was used for the shallow wells and the arte-sian wells (tubular) were sampled directly from pumping systems, usually at taps installed before the tubes connected to domestic water storage tanks.
While in the ield an aliquot was taken to measure electrical conductivity (using an Amber Science meter, model 2052), pH and temperature (using an Orion meter, model 250A). Additional aliquots were then iltered through glass iber ilters (GF/F, 0,7 µm nominal pore size), and stored in high density polyethylene (HDPE), preser-ved with thymol and in polyethylene lasks, preserpreser-ved with mercury chloride, for the analysis of dissolved inorganic carbon isotope (δ13C-DIC). Ion chromatography (Dionex DX-500) was employed to determine the concentrations of cations (Na+, Ca2+, Mg2+, K+, NH
4 +) and anions (Cl-, SO
4 2-, NO
3
-). Carbon isotope was analyzed using a mass spectrometer (Finnigan – Model DeltaPlus).
Analytical performance was checked using certiied water sam-ples (Trois-94, NWRI, Canada) and also by calculating charge balance for each sample, as expressed by the equation:24
Ion Percent Difference = [(∑cations – ∑anions) / (∑cations + ∑anions)] x 100
In this equation, µEq L-1 concentrations were used for cations and anions, respectively. The analytical precision for the measurements of ions was reasonable within ±5% of ionic balance error.
Statistics
A summary of data was achieved by using descriptive statistics. Normal distribution was evaluated by Shapiro-Wilk’s test (signii-cance set to p < 0.05). The nonparametric Wilcoxon two-sample test (Mann-Whitney) was used after checking non-normality of database (p<0.001) in order to compare the seasonal effects on solute con-centrations. We also applied Spearman Rank Correlation to make comparisons between variables. Statistical analyses were performed using Statistica 6.1 (Statsoft Inc., Tulsa, OK, USA).
RESULTS AND DISCUSSION
The results of the chemical analysis of groundwater samples are given in Table 2. The pH was somewhat acidic for all samples, with the right margin exhibiting more acidic values (median pH = 5.38) than the left (median pH = 5.75). Riparian groundwater displayed intermediate values, when compared with rural wells, with a median value of 5.47. The acidity found in forest wells is usually associated with carbonic acid dissolution, rock weathering and litter decompo-sition over the forest loor, which yields organic acids.25-27 In fact, Williams et al. and Chaves et al. studying intact forests in Central Amazonas and Rondônia, respectively, found more acidic pH values (4.7 and 5.2) than those observed in the Urupá basin.15,16
In addition to the above mentioned factors inluencing acidity in groundwater, in rural and urban areas, domestic and industrial sewage disposal and soil alteration through corrective products and fertilizers can also inluence pH.28 Hence, the proximity of wells to septic tanks could have led to the differences observed between the two riversides, mainly for the shallower wells. This is conirmed by the strong relationship between pH values and distance to the closest source of contamination (Table 1), which is signiicant only to wells located at the right margin (Spearman Rank Correlation, rs = 0.74, p < 0.05), where the distance between wells and septic tanks was very short (median = 17.5 m) and below the recommendation of the Health Ministry (about 20 m). At the left margin, where most of wells are situated much farther apart from septic tanks (median = 31.5 m), no signiicant relationship was observed (Spearman Rank Correlation, rs = -0.38). All samples from the right margin and ap-proximately 70% of the wells from the left margin exhibited pH values below 6.0, suggesting that these groundwater can be used for hygiene (bathing, cleaning, etc), but special care must be taken for drinking purposes.29
In most wells waters showed low electrical conductivity values with a median value of 64.6 and 84.7 µS cm-1 at the right and left margins, respectively, which results from the existence of a highly weathered environment, as is common for tropical rainy Amazon basin.30 A study conducted by Silva in urban wells at the city of Ji-Paraná, Rondônia State, showed values much higher than those reported in the Urupá River basin, averaging, respectively, from 147.3 to 232.3 µS cm-1 in tubular and shallow wells.31 The author also found high concentrations of nitrate, which was attributed to contamination from septic tanks.
Concentrations of nitrate in groundwater at the study site indicate that this could also be occurring for most of the wells on the right margin and also for some at the left. While at the riparian wells average NO3- concentration was 1.7 mg L-1, at the left and right margins these values increased to 3.8 and 5.1 mg L-1, respectively. A similar trend was observed for chloride, with average
concentra-Table 1. Description of the rural wells sampling points in the Urupá River basin
Site ID Coordinates Altitude Well
depthInstallation
Distance from cesspit
LAT/LONG (m) (m) (m)
tions of 0.7, 2.0 and 4.2 mg L-1 at riparian, right and left margins respectively. Overall, only left margin wells GW-15 to GW-17 showed concentrations of chloride and nitrate similar (or lower) than those of riparian wells (Table 2).
Other example of high conductivity in urban wells was reported by Narciso et al. in the city of Aparecida de Goiás, in Brazil (126 µS cm-1), Vidal et al. in the city of Lugo at the northwestern Spain (springs = 180.05 µS cm-1; rural wells = 239 µS cm-1) and Lee et al. in the metropolitan city of Seul, South Korea (470 µS cm-1).32-34 For the two last studies, both authors agree that highest electrical conductivity was associated with locations where agricultural activities predominate.
At our site, both pastures and septic tanks can be contributing to the inal composition of groundwater. Riparian groundwater (APU-1 - APU-3) and wells GW-15 - GW-17 show a tendency for increased chloride and nitrate concentrations (except for nitrate at APU-2 and GW-16) during the dry season (Table 3). An inverse trend is observed in most of the wells at the right margin, but also for wells GW-10 - GW-11 and GW-18 at the left, whereas the same pattern is observed, for example, for well GW-6 at the right margin, but at much higher concentrations. Most likely, wells with higher concentrations of these ions in the wet season receive larger contributions from overland and shallow subsurface lows on pastures, whereas those with above pris-tine water concentrations, but also higher ones during the dry season are also constantly supplied with septic tank leakages.
Riparian wells exhibited a median conductivity of 43.3 µS cm-1 emphasizing the depleted nature of the groundwater in this region. Other studies conducted in forest ecosystems in the Amazon region have also found low conductivity values.15,16
Concentrations of chemical constituents in groundwater showed
high spatial variability, especially for anions (Figure 1). The general order of dominance of cations in the groundwater of the studied area is Na+ >> K+≈ Ca2+ > Mg2+ and Ca2+ > Na+ > Mg2+ > K+ for right and left margins, respectively, whereas for anions it is Cl- > HCO
3 -≈
NO3- >> SO 4
2- (right) and HCO 3
- >> NO 3
-≈ Cl- >> SO 4
2- (left). In riparian groundwater, the cationic predominance was the same as in the right margin of the river, but an opposite trend for anions was found, which was similar to that of the left margin. These different patterns occurred probably due to different lithologic substratum between the two riversides, which could result for instance in distinct nutrient inputs into the Urupá River. The concentration of these ions varied seasonally, particularly for the right margin, where chloride dominance in the wet season was replaced by bicarbonate at the dry period, suggesting important weathering reactions in the latter season and increased atmospheric contributions in the former.
As suggested by Buckau et al., the dissolved inorganic carbon (DIC) of organic origin (sedimentary organic carbon = SOC) and of inorganic origin (from sedimentary carbonates) can be distinguished by their 13C content.25 Our results showed signiicant differences be-tween forest and rural wells, with the irst exhibiting a median value of -22.2‰ and the latter with -15.6 and -15.9‰ for right and left margins, respectively. This suggests that inorganic carbon in forest wells is predominantly derived from organic sources in the forest, mainly from biogenic soil CO2, since δ
13C signature for C-3 plants and corresponding humus is approximately -27‰, instead of rural wells which showed heavier values, probably due to the absence of forest loor organic layer and predominance of C-4 plants (δ13C of approximately -12‰) in pasture ields around these properties.
In a study conducted in the Urupá River, Bolson found δ13C-DIC
Table 2. Physical-chemical and major ion concentration in groundwater sampled on riparian and rural properties in the Urupá River basin (Rondônia, Brazil). The main seasonal periods are indicated as W (wet) and D (dry)
Site Temp pH EC Na+ K+ Mg2+ Ca2+ HCO
3
- Cl- SO
4
2- NO
3
-W D W D W D W D W D W D W D W D W D W D W D
APU-1 27.5 26.3 5.0 6.2 18.9 66.9 2.2 3.8 0.5 2.1 0.1 1.6 0.4 5.8 0.4 5.9 0.3 1.3 0.2 0.5 0.3 5.6 APU-2 27.5 26.2 5.3 6.2 22.2 126.1 3.0 36.3 0.3 1.6 0.3 0.7 0.6 1.9 0.6 41.5 0.4 1.3 0.2 1.1 1.5 1.0 APU-3 27.3 25.9 5.8 5.7 87.6 77.7 5.9 - 0.9 - 1.8 - 4.6 - 10.3 7.5 0.4 - 0.3 - 0.1 -Median
Riparian
27.4 26.2 5.3 6.2 27.0 72.8 3.1 20.5 0.7 1.9 0.3 1.2 0.7 3.9 0.7 5.3 0.4 1.3 0.2 0.8 0.2 3.3 GW-1 26.4 26.0 5.4 5.9 59.0 58.7 4.4 5.3 3.3 5.0 0.02 0.71 0.8 0.6 2.4 11.8 1.5 2.2 0.2 0.2 3.8 3.4 GW-2 26.1 25.9 5.6 5.9 98.0 97.6 5.0 6.9 54.1 74.4 1.4 2.1 5.0 7.5 5.9 20.1 1.1 1.0 0.1 0.2 6.1 6.1 GW-3 26.4 24.5 5.1 5.3 102.3 80.9 7.5 6.5 1.6 1.8 1.4 2.3 4.0 6.0 0.5 2.3 12.1 11.5 1.2 0.2 10.9 12.4 GW-4 27.0 26.4 5.0 5.6 44.1 37.6 4.0 5.4 2.6 2.8 0.7 1.4 1.0 0.9 0.7 10.3 4.0 3.8 0.2 0.1 2.7 0.8 GW-5 26.5 25.2 5.8 5.8 203.0 111.7 4.5 13.7 0.8 6.0 n.a 2.8 0.1 2.0 10.2 17.9 3.3 8.3 2.4 1.3 1.5 0.2 GW-6 26.9 25.9 5.2 5.6 64.6 82.8 2.7 3.5 6.8 12.4 0.9 1.8 1.9 3.5 1.2 7.6 5.4 7.1 0.8 0.4 3.0 12.0 GW-7 27.4 - 4.5 - 187.5 - 6.7 - 1.1 - 0.3 - 1.7 - 0.1 - 5.3 - 0.2 - 5.7 -GW-8 27.9 27.1 5.4 5.3 61.8 46.1 2.3 3.1 5.0 5.0 1.7 1.1 0.7 3.0 1.9 3.7 1.8 1.4 1.1 0.7 7.8 5.5 GW-9 27.3 26.7 5.0 5.2 28.0 27.5 1.4 2.3 2.6 3.0 0.6 0.7 0.4 1.7 0.4 3.7 1.3 1.0 0.1 0.2 2.1 2.0 Median
Right Margin
26.9 26.0 5.2 5.6 64.6 69.8 4.4 5.3 2.6 4.0 0.8 1.6 1.0 2.5 1.2 8.9 3.3 3.0 0.2 0.2 3.8 4.4 GW-10 27.1 26.2 5.7 5.9 320.0 233.0 2.6 35.8 2.8 4.1 0.5 8.9 1.2 8.2 20.7 36.8 1.6 7.2 0.1 6.1 5.4 0.4 GW-11 27.6 27.5 6.0 5.2 187.7 31.9 2.1 3.8 3.7 3.6 1.7 2.1 21.7 1.9 22.1 4.1 1.3 0.6 1.9 0.2 5.7 1.9 GW-12 28.2 26.6 6.0 6.1 105.4 98.5 6.3 7.5 6.4 7.3 0.6 2.0 7.7 4.7 15.2 18.0 0.5 0.3 1.0 0.5 1.8 3.1 GW-13 26.8 26.9 5.4 5.6 59.4 42.1 1.9 3.0 2.5 4.4 0.9 1.5 4.4 4.4 2.0 6.0 2.7 2.3 0.2 0.2 1.1 2.6 GW-14 28.2 27.5 5.3 5.8 132.6 112.7 7.5 10.1 3.3 3.5 1.5 2.6 9.9 9.7 2.3 9.3 1.0 7.3 0.1 0.2 4.4 25.8 GW-15 27.0 25.7 6.3 5.8 74.1 58.7 1.6 3.2 1.5 1.8 1.8 2.1 7.1 7.4 17.5 13.4 0.4 0.6 0.6 0.6 0.04 0.5 GW-16 27.6 27.7 5.3 6.1 61.6 57.0 6.1 8.6 1.6 2.0 1.0 1.7 3.0 2.9 3.0 20.6 0.2 0.3 0.1 0.2 0.6 0.6 GW-17 27.3 25.2 5.3 5.5 49.5 42.7 2.3 3.1 1.8 2.3 1.3 2.1 3.5 3.7 2.1 7.1 0.3 0.5 0.2 0.2 0.1 0.3 GW-18 27.6 27.1 5.6 5.9 105.9 95.2 5.6 6.2 0.6 0.5 3.8 5.3 5.5 6.0 3.7 16.1 4.0 5.0 2.4 1.4 11.5 2.1 Median Left
Margin
values of -8.48‰ closer to the values we found in rural wells, and the author attributed this fact to the presence of calcareous rocks upstream from our study site and C-4 vegetation in this sector of the basin.35 Similar 13C-DIC values in stream and rural wells and the fact that riparian forest is considerably narrow suggest that runoff from pastures may have a larger inluence on carbon inputs into the Urupá River than riparian groundwater.
Hooda et al. showed that nitrate (NO3-) and ammonium (NH 4
+) are the two most important forms of inorganic nitrogen in soil, with NO3- being a freely mobile ion in the soil water potentially able to reach lower soil layers (groundwater), whereas NH4
+ tends to be retained into the soil by cation exchange processes.36 In this study, a predominance of nitrate was observed for all samples, since ammo-nium is generally found in very small concentrations.
Nitrate was the main anion in three rural wells (GW-8, GW-14 and GW-18), and two of them which were installed supericially (cladded with concrete tubes) (GW-3 and GW-18) exhibited very high concentrations of this nutrient. Concentrations of NO3- in these wells, 10.9 and 11.5 mg L-1, respectively, are slightly above Brazilian potability standards, which restrict nitrate concentrations for water supply to less than 10 mg NO3
- L-1.
Hooda et al. point out that the extent of nitrate leaching in rural areas is strongly inluenced by land use, management practices, climate and soil types.36 Hence, the high intensity of rainfall in the Amazon region in addition to both inadequate well installation and also ruminant excretion through urine and faeces might be inluencing signiicantly higher nitrate concentrations observed near pastures.37-40 Dissolved inorganic nitrogen in the riparian forest was very low with
Table 3. Relative concentration changes in groundwater from wet (W) to dry (D) season. Values in mg L-1
Site Cl- NO
3
-W D % W D %
APU-1 0.3 1.3 333 0.3 5.6 1767
APU-2 0.4 1.3 225 1.5 1.0 -33
APU-3 0.4 n.a. 0.1 n.a.
Annual APU Average 0.7 - 1.7
-GW-1 1.5 2.2 47 3.8 3.4 -11
GW-2 1.1 1.0 -9 6.1 6.1 0
GW-3 12.1 11.5 -5 10.9 12.4 14
GW-4 4.0 3.8 -5 2.7 0.8 -70
GW-5 3.3 8.3 152 1.5 0.2 -87
GW-6 5.4 7.1 31 3.0 12.0 300
GW-7 5.3 n.a. 5.7 n.a.
GW-8 1.8 1.4 -22 7.8 5.5 -29
GW-9 1.3 1.0 -23 2.1 2.0 -5
Annual Right Margin Average 4.2 - 5.1
-GW-10 1.6 7.2 350 5.4 0.4 -93
GW-11 1.3 0.6 -54 5.7 1.9 -67
GW-12 0.5 0.3 -40 1.8 3.1 72
GW-13 2.7 2.3 -15 1.1 2.6 136
GW-14 1.0 7.3 630 4.4 25.8 486
GW-15 0.4 0.6 50 0.04 0.5 1150
GW-16 0.2 0.3 50 0.6 0.6 0
GW-17 0.3 0.5 67 0.1 0.3 200
GW-18 4.0 5.0 25 11.5 2.1 -82
Annual Left Margin Average 2.0 - 3.8
-Figure 1. Ternary diagram for groundwater samples (based on molar
abun-dance) expressing predominance for both cations and anions, for right (a and
b) and left (c and d) margin, respectively. The seasonal periods are expressed as capital letters (dry) and lower case letters (wet)
a median value of 0.26 mg L-1 (n = 49) and 0.10 mg L-1 (n = 30) for nitrate and ammonium, respectively.
CONCLUSIONS
concentrations, except for nitrate, are still within the permissible limits for human consumption according to Brazilian standards.41,42
Although ion dominance in the waters of the Urupá River is simi-lar to that found in riparian wells, carbon isotope composition shows distinct carbon sources, where runoff seems to be more inluential than riparian groundwater. These results are in agreement with the statement of Markewitz et al. who demonstrates that streams draining weathered soils, as those usually found in the Amazon region, may receive their ionic supply directly from upper soil layers instead of rock weathering and this fact may have an important role in the delivery of nutrients into the Urupá River.43
SUPPLEMENTARY MATERIAL
The Figure 1S (Location of the studied sites in Rondônia with riparian (APU) and farm (GW) wells distributed along both margins of Urupá River) is available free of charge at http://quimicanova.sbq. org.br, as PDF ile.
ACKNOWLEDGMENTS
Funding for this study was provided by FAPESP, CT-HIDRO/ CNPq, and Milênio/CNPq (proc. 2008/56238-7, 505612/2004-6 and 420199/2005-5, respectively). LBA project and UNIR/Ji-Paraná provided valuable logistic support. We thank several land owners who provided us access to work on their land, especially, J. V. Hilgert for gently allowing us to work at Fazenda Apurú; G. Gobet and A. Mon-tebello for assistance with chemical analysis. The authors would like to thank all referees for comments and corrections on the manuscript. REFERENCES
1. Stamatis, G.; Lambrakis, N.; Alexakis, D.; Zagana, E.; Hydrol. Process.
2006, 20, 2803.
2. Banaszuk, P.; Wysocka-Czubaszek, A.; Kondratiuk, P.; Agric. Ecosyst. Environ.2005, 107, 167.
3. Bjerg, P. L.; Christensen, T. H.; J. Hydrol. 1992, 131, 133. 4. Jordana, S.; Batista, E.; Geol. Acta 2004, 2, 175. 5. Rebouças, A. C.; Episodes 1999, 22, 232.
6. Foster, S. S. D.; Chilton, P. J.; Phil. Trans. R. Soc. Lond. B2003, 358, 1957.
7. Pedlowski, M. A.; Dale, V. H.; Matricardi, E. A. T.; da Silva Filho, E. P.; Landscape Urban Plan.1997, 38, 149.
8. Fujisaka, S.; Bell, W.;Thomas, N.; Hurtado, L.; Crawford, E.; Agric. Ecosyst. Environ.1996, 59, 115.
9. Browder, J. O.; Stud. Comp. Int. Dev.1994, 29, 45.
10. Amaral, L. A.; Nader Filho, A.; Rossi Junior, O. D.; Ferreira, F. L. A.; Barros, L. S. S.; Rev. Saúde Públ.2003, 37, 510.
11. Panero, F. S.; Da Silva, H. E. B.; Microchem. J.2008, 88, 194. 12. Azevedo, R. P.; Acta Amaz.2006, 36, 313.
13. Silva, M. L.; Rev. Esc. Minas. 2001, 54, 115.
14. Mcclain, M. E.; Richey, J. E.; Pimentel, T. P.; Biogeochemistry 1994, 27, 113.
15. Williams, M. R.; Fisher, T. R.; Melack, J. M.; Biogeochemistry 1997, 38, 303.
16. Chaves, J.; Neill, C.; Germer, S.; Gouveia Neto, S.; Krusche, A.; Elsen-beer, H.; Hydrol. Process.2007, 22, 1766.
17. Melian, R.; Myrlian, N.; Gouriev, A.; Moraru, C.; Radstake, F.; Hydrogeol. J.1999, 7, 188.
18. Rondônia; Boletim Climatológico de Rondônia, Secretaria de Estado do Desenvolvimento Ambiental (SEDAM): Porto Velho, 2006.
19. Cassiolato, M. E.; Dissertação de Mestrado, Universidade de São Paulo, Brasil, 2002.
20. Germer, S.; Neill C.; Krusche, A. V.; Gouveia, S. C.; Elsenbeer, H.; Biogeochemistry 2007, 86, 155.
21. Ballester, M. V. R.; Victoria, D. C.; Krusche, A. V.; Coburn, R.; Victoria, R. L.; Richey, J. E.; Logsdon, M. G.; Mayorga, E.; Matricardi, E.; Remote Sens. Environ. 2003, 87, 429.
22. Krusche, A. V.; Ballester, M. V. R.; Victoria, R. L.; Bernardes, M. C.; Leite, N. K.; Hanada, L.; Victoria, D. C.; Toledo, A. M.; Ometto, J. P.; Moreira, M. Z.; Gomes, B. M.; Bolson, M. A.; Neto, S. G.; Bonelli, N.; Deegan, L.; Neill, C.; Thomas, S.; Aufdenkampe, A. K.; Richey, J. E.; Acta Amaz.2005, 35, 197.
23. Trick, J. K.; Stuart, M.;Reeder, S. Em Environmental Geochemistry - Site Characterization, Data Analysis and Case Histories; de Vivo, B.; Belkin, H. E.;Lima, A., eds; Elsevier: Amsterdam, 2008, cap. 3. 24. Dunnivant, F. M.; Environmental Laboratory Exercises for Instrumental
Analysis and Environmental Chemistry, 1st ed., Wiley: New Jersey, 2004. 25. Buckau, G.; Artinger, R.; Geyer, S.; Wolf, M.; Fritz, P.; Kim, J. I.; Appl.
Geochem.2000, 15, 819.
26. Aris, A. Z.; Abdullah, M. H.; Ahmed, A.; Woong, K. K.; Int. J. Environ. Sci. Technol.2007, 4, 441.
27. Lilienfein, J.; Wilcke, W.; Angelo Ayarza, M.; Vilela, L.; Do Carmo Lima, S.; Zech, W.; Forest Ecol. Manag.2000, 128, 145.
28. Conte, M. L.; Leopoldo, P. R.; Avaliação de recursos hídricos: Rio Pardo, um exemplo, 1ª ed., Ed. UNESP: São Paulo, 2001.
29. Ministério da Saúde; Portaria nº. 518 de 25 de Março de 2004 - Estabelece os procedimentos e responsabilidades relativos ao controle e vigilância da qualidade da água para consumo humano e seu padrão de potabilidade e dá outras providências. Revoga a Portaria nº 1469, de 29 de Dezembro de 2000.
30. Irion, G.; Naturwissenschaften 1978, 65, 515.
31. Silva, A. C.; Dissertação de Mestrado, Universidade Estadual Paulista, Brasil, 2001.
32. Narciso, M. G.; Gomes, L. P.; Sanare 2004, 21, 4.
33. Vidal, M. J.; Melgar, L. A.; Santoalla, M. C.; J. Environ. Manage.2000, 60, 215.
34. Lee, J. Y.; Choi, M. J.; Kim, Y. Y.; Lee, K. K.; Hydrol. Process.2005, 19, 2525.
35. Bolson, M. A.; Dissertação de Mestrado, Universidade de São Paulo, Brasil, 2006.
36. Hooda, P. S.; Edwards A. C.; Anderson, H. A.; Miller, A.; Sci. Total Environ.2000, 250, 143.
37. Marengo, J. A.; Hastenrath, S.; J. Climate 1993, 6, 617.
38. Nielsen, D.; Nielsen, G.; Groundwater Sampling: A Field Guide, 1st ed., CRC Press: Boca Raton, 2006.
39. van der Meer, H. G.; Ryden, J. C.; Ennik, G. C.; Nitrogen Fluxes in Intensive Grassland systems, 1st ed., Kluwer: Dordrecht, 1986. 40. Jarvis, S. C.; Soil Use Manage.1993, 9, 99.
41. Resolução CONAMA nº. 357; de 17 de Março de 2005 – Conselho Nacional do Meio Ambiente - Dispõe sobre a classiicação dos corpos de água e diretrizes ambientais para o seu enquadramento, bem como estabelece as condições e padrões de lançamento de eluentes, e dá outras providências. Revoga a Resolução CONAMA nº 20, de 18 de Junho de 1986.
42. Resolução CONAMA nº. 398; de 11 de Junho de 2008 – Conselho Nacional do Meio Ambiente - Dispõe sobre o conteúdo mínimo do Plano de Emergência Individual para incidentes de poluição por óleo em águas sob jurisdição nacional, originados em portos organizados, instalações portuárias, terminais, dutos, sondas terrestres, plataformas e suas instalações de apoio, reinarias, estaleiros, marinas, clubes náuticos e instalações similares, e orienta a sua elaboração. Revoga a Resolução CONAMA nº 293, de 12 de Dezembro de 2001.
Material Suplementar
*e-mail: [email protected]
GROUNDWATER QUALITY COMPARISON BETWEEN RURAL FARMS AND RIPARIAN WELLS IN THE WESTERN AMAZON, BRAZIL
Nei K. Leite*, Alex V. Krusche, Giovana M. Cabianchi, Maria Victoria R. Ballester e Reynaldo L. Victoria
Centro de Energia Nuclear na Agricultura, Universidade de São Paulo, Av. Centenário, 303, 13416-903 Piracicaba - SP, Brasil
Margarida Marchetto e Judes G. dos Santos
Universidade Federal de Rondônia, Campus de Ji-Paraná, Rua Rio Amazonas, 351, 76900-726 Ji-Paraná - RO, Brasil