Article
J. Braz. Chem. Soc., Vol. 26, No. 3, 592-599, 2015. Printed in Brazil - ©2015 Sociedade Brasileira de Química 0103 - 5053 $6.00+0.00
A
*e-mail: [email protected]; [email protected]
Developing Fast and Facile Method for Speciation Analysis of Vanadium (V/IV) Ions
with Calmagite Immobilization on Triacetyl Cellulose Membrane in Water Samples
Hossein Tavallali* and Rozita Nejabat
Department of Chemistry, Payame Noor University, 19395-4697 Tehran, I. R. of Iran
An inexpensive and fast vanadium [(IV), (V)] speciation method was performed by using optical chemical sensor that incorporates lipophilized calmagite (Cal) with cetyl pyridinium chloride (CPC) as a suitable ligand on triacetylcellulose membrane in aqueous solutions prior to UV-Vis spectrometric determination. Absorbance decrease of the optode in pH 6 at 490 nm depended on the V(V) ion concentration. The V(IV) content was found after oxidation to V(V) at the mentioned conditions. Two aliquots of sample were used for speciative determination of V(V) and V(V) + V(IV) mixture. With the optimized proposed sensor V(V) and V(IV) can be assayed with detection limits of 0.002 and 0.003 nmol L−1, respectively. The optode was tested
by analysing several mixtures containing different ratios of V(V) + V(IV) and was found to be highly reproducible. The validity of the method was checked via spiked water samples with total relative standard error less than 4%.
Keywords: vanadium, speciation, calmagite, ion pair, optode
Introduction
In the recent years, it is well accepted that the chemical form of an element plays a significant role involving the toxicity, bioavailability, and transport properties. In the past, total quantification of an element was used to find out potential health harmfulness or benefits, but now, a researcher knows that total elemental quantification alone is deficient.1 For better understanding the biochemical
influence of elements on mechanism of living organisms, it is essential to not only determine the species formed inside specific environmental or biological matrix but also quantify those species accurately.2
The exposure of trace elements to the environment has activated the science community to develop new analytical techniques and instrumentation, capable of measuring concentrations at trace level.3
Vanadium is known as an essential trace element for plants and animals, which performs in the synthesis of chlorophyll and helps young animals to grow. The estimated daily intake of vanadium ranges from 6 to 18 µg.4
Vanadium compounds are toxic in high concentrations or after long periods of exposure.5 They also exhibit
chemotherapeutic effects in the treatment of leukemia
and recent studies showed promising application in management of diabetes.6
Vanadium in air is released in large quantities from the combustion of fuel oil, especially residual oil, which is known to be rich in this element and is precipitated on the soil that was drained by rain and groundwater and can be directly adsorbed by plants.7 Vanadium is also used
as a catalyst (e.g., in polymer synthesis), a depolarizer, a developer in photography and in the manufacture of yellow glass.8 Dissolved vanadium is generally noticed as the index
element in natural water and environmental pollution. It can be toxic in high concentrations (µg mL–1).9
Vanadium can exist in many oxidation states from −1 to +5, but it is most commonly found in the +4 and +5 states.4
Speciation analysis of trace amounts of V(V) known as vanadate ion and V(IV) presents as vanadyl ion, has become important. Vanadium (V) is more toxic than vanadium (IV) therefore, it is important to monitor the concentration of individual oxidation form vanadium in the environment for evaluating both the potential risk and benefits.10
The vanadium concentration in water ranges from 0.2 to > 100 µg L−1 in fresh and drinking water,11 from
0.2 to 29 µg L−1 in sea water,12 and from 0.5 to 2.5 mg L−1
in natural water,13 typical values being between 1 and
6 µg L−1.14 The permitted vanadium concentration level
is 50 mg L−1 according to the Environmental Protection
A wide variety of analytical techniques have been defined for the speciation of vanadium. These involve standard atomic spectroscopic techniques and separation methods coupled with a sensitive detector, which are used in the speciation of trace metal(loid)s in both biological and environmental systems.1,2 Separation methods including
capillary electrophoresis (CE) and liquid chromatography (LC) with various detection schemes for vanadium speciation5
and numerous separation and preconcentration techniques such as liquid-liquid (L-L) solvent extraction, ionic liquid microextraction3,4,15,16 for vanadium determination have been
developed in environmental samples. In the field of atomic spectroscopy techniques, different methods have been used for the determination of vanadium, including atomic absorption spectrometry (AAS) with flame and graphite tube atomizers, X-ray fluorescence spectrometry (XRF), inductively coupled plasma mass spectrometry (ICP-MS), inductively coupled plasma optical emission spectrometry (ICP-OES)17 and kinetic-catalytic methods.8,18
During the past decade, the development of optical chemo-sensors for the determination of metal ions has become a rapidly expanding area of analytical chemistry because it offers certain advantages over electrochemical sensors.19-21 Optical chemical sensors (optodes) are considered
to be studied well for monitoring of toxic ions/species.22-25
Optodes are easy to prepare, selective for determination of target analyte in the sensing matrix, and there is no need for separating reference devices. Consequently, a number of optodes with different optical principles have been reported for the determination of cations in recent years.26-31
As part of our ongoing studies on sensors,32-36 herein
we report the first optode capable of successive speciation of V(IV) and V(V) ions. According to our knowledge, this optode has not still been used for speciation of ions. We suggested a unique reagent immobilization mode to develop an optode. It is an innovation due to the fact that the common availability of the instrumentation, the simplicity of procedures, speed, precision and accuracy of the technique make this spectrophotometric method attractive. Also, the proposed spectrophotometric method of analysis is more economic and simpler, compared to methods such as chromatography and electrophoresis.17 The proposed
method was successfully applied to the determination of V(V) and V(IV) in water samples.
Experimental
Equipment and reagents
Absorbance measurements were made with a Perkin Elmer Lambda2 UV-Visible Spectrophotometer
(Bodenseewerk, USA) using quartz cells with a 1.00 cm optical path length containing a thermoelectrically temperature controlled cell holder at 298.2 ± 0.1 K in the wavelength range of 300-1000 nm. For pH adjustment, the study benefited from a Jenway model 3510 pH-meter (Staffordishe, UK) with a combined glass electrode that was calibrated. All reagents were of analytical reagent grade, and double-distilled water (Abpakhsh,Tehran,Iran) was used throughout. Calmagite, with the chemical name of 2-hydroxy-1-(2-hydroxy-5-methylphenylazo)-4-naphthalene sulfonic acid and other reagents and chemicals including N-cetyl pyridinium chloride (CPC), dimethylformamide (DMF), methanol and ethylene diamine were supplied by Merck (Dermastadt, Germany). KBrO3 (Merck) solution (0.03 mol L−1) was prepared by
dissolving 0.5010 g of it in water in a 100 mL volumetric flask. Stock solutions (1000 mg L−1) of vanadium (IV) and
vanadium (V) were prepared by dissolving NH4VO3 (Merck)
and VOSO4.5H2O (Merck) in distilled water, respectively
and were standardized.37 Working standard solutions
were prepared by diluting stock solution. Moreover, universal aqueous pH buffer solutions were formulated from acetic/phosphoric/boric acids (0.040 mol L−1 each)
and adjustments of the desired pH were made with HCl and NaOH (1.0 mol L−1). All glassware used for handling
solutions were cleaned with detergent solution, soaked in aqueous HNO3 (10% v/v) then rinsed thoroughly with
distilled water several times.
Preparation of the sensor membrane
For the purpose of the current study, the calmagite-CPC ion pair was prepared according to the following procedure: first, equal mole ratio of calmagite and CPC were weighted and each of them was separately dissolved in a mixture of 5.0 mL DMF and 3.0 mL methanol and in the next stage the solutions were mixed. Then, 5.0 mL of 0.010 mol L−1
HCl was added to the mixture. Under the above-mentioned condition, only the sulphonic group is dissociated and is capable of forming an ion pair, while the chelate-forming groups remain protected. Dilution of the mixture with water results in the precipitation of the ion pair in the form of viscous oil. After filtering the precipitate, it was dried in ambient temperature. Immobilization of the ion-pair was performed according to the following procedure: the 1 × 3 cm transparent triacetylcellulose membranes were produced from waste photographic film tapes that were previously treated with commercial sodium hypochlorite in order to remove colored gelatinous layers.33 In the next
of methanol for 5 min at 40°C in a stirring mode. This step provides a stabilized condition for all membranes to be made. Then they were washed with water and detergent to remove ethylene diamine and loosely trapped ion-pairs. Prepared membranes were stored in water when they were not in use.
Recommended analytical procedure
The sensor was first exposed to the acetate buffer solution at pH 6.0 in the cell for 10 min to reach equilibrium and the absorbance was measured spectrophotometrically at 480 nm (maximum wavelength of the complex in Figure 1) against blank solution. The sample solution containing mixture of V(IV) and V(V) was added to the cell with a microliter syringe and after mixing, the absorbance value of the system was recorded at 490 nm against a corresponding reagent blank after 8 min. To determine vanadium (IV) using this system, pre-oxidation of V(IV) is required. Appropriate volume (0.5 mL) of 0.03 mol L−1 KBrO
3 was added to the same
aliquot of mixture solution in 10 mL volumetric flask and thoroughly mixed after diluting up to the mark with water. After that, another membrane sensor exposed to buffer solution pH 6 for 10 min to reach equilibrium and the sample containing the V(V) solution was added into the cell and the spectra were gained at 490 nm. The V(IV) concentration is estimated indirectly by subtracting the V(V) concentration measured before oxidation from total vanadium concentration.
Sample preparation
All the measurements on the triacetylcellulose membranes were performed in aqueous medium. Tap water samples were collected from the water tap in laboratory of Payame noor Shiraz University, Iran. River water which supplies water to Ghare Aghaj River Firoozabad, Iran and rain water was collected in Shiraz. All bottles and filtration apparatus were previously washed with 10% (v/v) HNO3 and then rinsed thoroughly with
distilled water. Dissolved and particulate matters in the river water were commonly separated by filtration through a cellulose membrane filter having 0.45 µm pore size. Filtered aliquots of sample were stored in polyethylene bottles and stored in a refrigerator when not used. The water samples were immediately analyzed. The water samples were spiked with different amounts of V5+ and
V4+ and pH adjusted to 6.0 before analysis. The analysis
was carried out by UV-Vis spectroscopy at 490 nm using a calibration curve.
Results and Discussion
Sensing reagent and preliminary spectophotometric studies
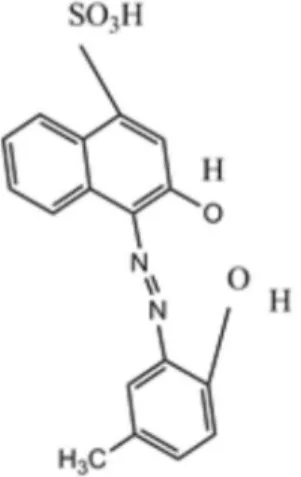
Calmagite (Scheme 1) is a photometric reagent that is soluble in water due to the presence of –SO3H groups in
chemical structure34 and cannot be immobilized effectively
on triacetylcellulose membrane. Thus, by synthesizing its derivative in the form of an ion-pair soluble in methanol through utilizing CPC, solubility in aqueous media decreased and the tendency to the membrane increased.38
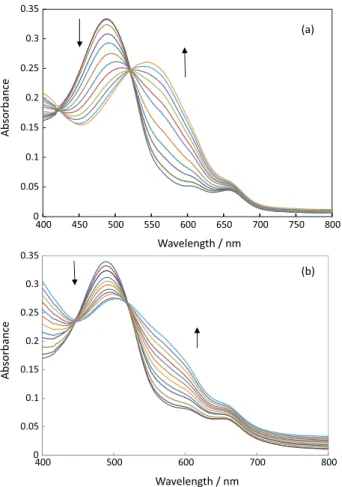
The absorption spectra of the membrane obtained after being equilibrated in acetate buffer solution (pH 6) containing a typical concentration of V(V)(0-7.2 µmol L−1)
by the addition of 0.6 µmol L−1 in each interval is shown
in Figure 1a. It shows two absorption peaks at 490 and 570 nm. The spectral changes and isobestic points in spectrum are results of increasing V(V) ions concentration in the membrane and complex formation. Arrows indicate the spectral trends in changing the V5+ concentration.
The maximum absorbance of the immobilized calmagite is located at 490 nm. The wavelength of 490 nm was selected for further studies because of higher selectivity and sensitivity at this wavelength.
Figure 1b shows the absorption spectra of the membrane obtained after being equilibrated in acetate buffer solution containing a typical concentration of V4+ (0-11 µmol L−1) at
pH 6 by the addition of 0.9 µmol L−1 in each interval after
adding oxidizing agent and changing to V5+.
Effect of pH
For the investigation of the response characteristic of the prepared membrane sensor to V(V), it is important to consider pH effect as one of the most crucial factors in
controlling the complexes formation of vanadium species by membrane and chemical stability.39 Therefore, the
impact of pH on the calmagite complex of vanadate ion was accomplished in the pH range from 2.0 to 9.0 in acetate buffer. Absorbance difference (∆A), which is defined as the difference between the absorbance of the immobilized ion pair and the absorbance of the complex after addition of V5+versus different pH values was plotted in Figure 2.
At pH values less than 2, the ion pair had leakage from the membrane. As can be seen in Figure 2, with increasing of pH from 2 to 6, ∆A is increased and decreased gradually when the pH was > 6.0. Therefore, the acetate buffer at pH 6 was considered as optimum and used for test solutions in order to avoid the risk of V5+ hydrolysis in higher pH values.
Depending on the pH of aqueous solutions and species concentrations, several monomeric and polymeric tetravalent and pentavalent vanadium species can exist.40
In aquatic diluted solution, the V(IV) in acidic pH range are formulated as VO2
+, VO(OH)+, (VO(OH)) 2
2+ and
VO(OH)2. In basic solutions, V(IV) is usually present
as the polyanionic species V4O92−. The V(V) ion often
forms VO2
+ (pH < 3.5), H 2VO4
− (pH 3.5-7.5) and HVO 4
2−
(pH 7.5-13.0).41 Therefore, in basic region, both V(IV)
and V(V), presumably because of the formation of anionic vanadate complexes of the type HVO42−, V4O92−, cannot
have any complexation with calmagite.
Speciation analysis of V(IV) and V(V)
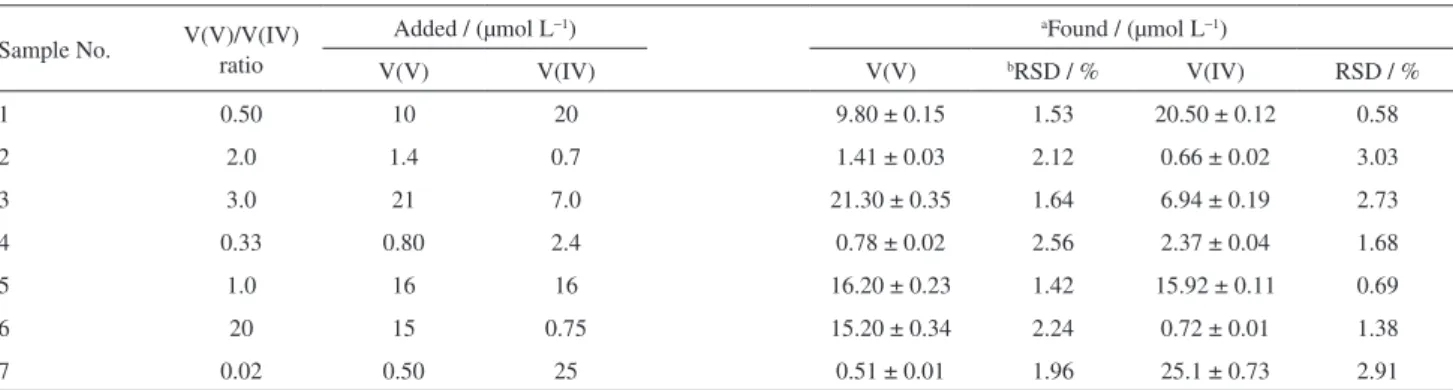
For the study of the behavior analysis of V(V) and V(IV) on the membrane, the mixture solutions with various proportions of V(V) and V(IV) were made and both oxidation states were tested. The experimental results for these determinations are given in Table 1.
A significant volume of sample solution containing various proportions of V(V) and V(IV) solution added to 10 mL volumetric flask and thoroughly mixed after diluting up to the mark with distillated water, the absorbance value of system was recorded at 490 nm against a corresponding reagent blank after 8 min at pH 6. For the determination of vanadium (IV) using this system after pre-oxidation with 0.5 mL of 0.03 mol L−1 KBrO
3, it was added into the
cell and the spectra were gained at 490 nm. The V(IV) concentration is estimated indirectly by subtracting the V(V) concentration measured before oxidation from total vanadium concentration. The experimental results with different ratios of V(V) and V(IV), preferably 1:1, 1:2, 1:3, 1:50, 2:1, 3:1 and 20:1 were found to be highly reproducible.
Response time
The response time is the time required for the analyte to transfer from the bulk of the solution to the membrane interface and join the indicator. Response time is another 0
0.05 0.1 0.15 0.2 0.25 0.3 0.35
400 450 500 550 600 650 700 750 800
Absorb
ance
Wavelength/ nm
(a)
0 0.05 0.1 0.15 0.2 0.25 0.3 0.35
400 500 600 700 800
Absorb
ance
Wavelength/ nm
(b)
Figure 1. (a) Absorption spectra for optode film in the presence of V5+ (0-7.2 µmol L−1) at pH 6 and 298.2 ± 0.1 K by the addition of 0.6 µmol L−1 in each interval. (b) Absorption spectra of optode film response to V4+ (0-11 µmol L−1) at pH 6 and 298.2 ± 0.1 K by the addition of 0.9 µmol L−1 in each interval after adding oxidizing agent. The arrows show the direction of absorbance by increasing the ion concentration.
0 0 05. 0 1.
0 2 4 6 8
Δ
A
pH
Figure 2. Effect of pH on the optode film response in the presence of 2.0 µmol L−1 V5+ ion at 490 nm and 298.2 ± 0.1 K.
0 0.05 0.1 0.15 0.2 0.25 0.3 0.35
400 450 500 550 600 650 700 750 800
Absorb
ance
Wavelength/ nm
(a)
0 0.05 0.1 0.15 0.2 0.25 0.3 0.35
400 500 600 700 800
Absorb
ance
Wavelength/ nm
important analytical feature of any optode that is governed by three processes: (i) diffusion in the film, (ii) the rate of complex formation between metal ion and ligand, and (iii) the rate of complex dissociation.42 The response time
was tested by recording the absorbance change from a buffered solution at pH 6 to buffered vanadium (V) solution of 2.0 µmol L−1. It was observed that the proposed sensor
reached about 95% of the steady-state response within 8-10 min and it depends on the concentration of vanadium (V) ion (Figure 3).
Analytical parameters
Under the optimized conditions, the calibration graph was obtained (Figure 4). According to Figure 4, the calibration graph based on absorbance difference (∆A)versus V5+ ion
concentration was linear in the range of 0.3-32.83µmol L−1
with equation: ∆A= 0.0865 CV(V) + 0.012. With correlation
coefficient (r) of 0.9975, where CV(V)is concentration
of V5+ in µmol L−1 and ∆Ais the absorbance difference
before and after addition of V(V) at 490 nm. In this case,
33.99 µmol L−1 was found as the concentration of V5+ ion
that saturates the film. The limit of detection, estimated as the concentration of analyte by producing an analytical signal equal to three times (3s) the standard deviation of the blank signal, was found to be 0.12 µg L−1. With changing
V4+ ion to V5+ shows the absorbance signals of the optode
film to various concentrations of vanadium (V) ions in the range of 0.60-28.50 µmol L−1 with detection limit of
0.18 µg L−1 at pH 6.0 (Table 2).
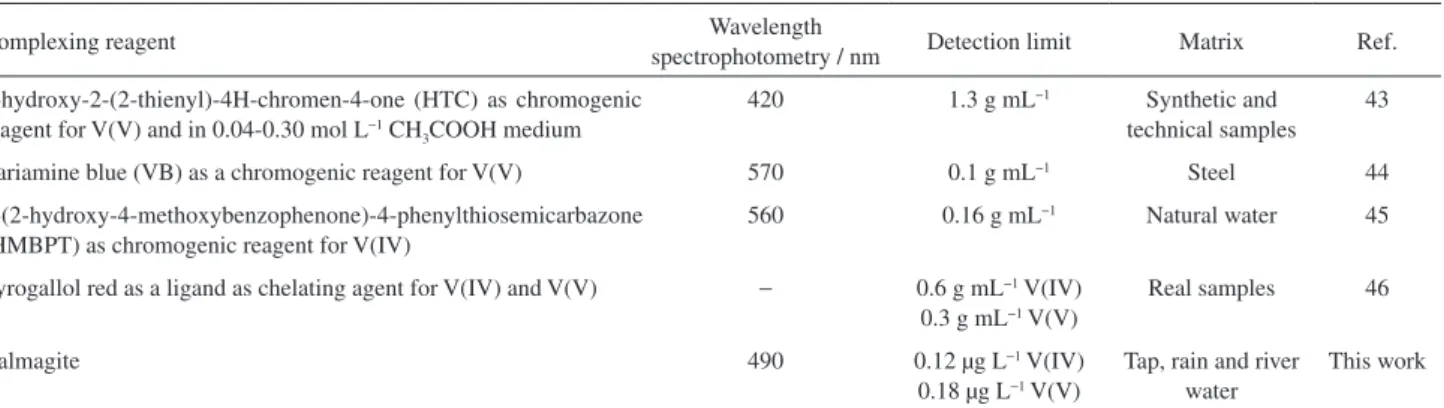
When the detection limits of several detection methods for the determination of vanadium are compared, it can be said that the detection limit of the proposed method is comparable or lower than most of those reported in the literature (Table 3).
Additionally, in the analytical characteristics, this optode in comparison with other literature methods for V(V) determination, it can be seen that the proposed method is used for tap, rain and river water but others only worked on natural water, synthetic and technical samples. It is simpler and this method does not require any pretreatments.
Life time, stability and regeneration
For the determination of the membrane lifetime, a membrane was placed in a cuvette containing buffer solution (pH 6), and then absorbance signals were recorded at wavelength of 490 nm for a period of time about 12 h. During this time, not only evidence of significant indicator was not found but also any change in the absorbance of the film optode at 490 nm during the time that the film was not exposed to pH 6 over a month. Exposing the membrane to light for 12 h, the optode was stable over the experiment and no drift was observed in signal or no leaching of the indicator over multiple usages of the membranes. When not in use, the prepared membranes were kept in water to prevent them from dying out. In addition, repeated
Table 1. Determination of V(IV) and V(V) in binary mixture by proposed method
Sample No. V(V)/V(IV) ratio
Added / (µmol L−1) aFound / (µmol L−1)
V(V) V(IV) V(V) bRSD / % V(IV) RSD / %
1 0.50 10 20 9.80 ± 0.15 1.53 20.50 ± 0.12 0.58
2 2.0 1.4 0.7 1.41 ± 0.03 2.12 0.66 ± 0.02 3.03
3 3.0 21 7.0 21.30 ± 0.35 1.64 6.94 ± 0.19 2.73
4 0.33 0.80 2.4 0.78 ± 0.02 2.56 2.37 ± 0.04 1.68
5 1.0 16 16 16.20 ± 0.23 1.42 15.92 ± 0.11 0.69
6 20 15 0.75 15.20 ± 0.34 2.24 0.72 ± 0.01 1.38
7 0.02 0.50 25 0.51 ± 0.01 1.96 25.1 ± 0.73 2.91
aThe mean value and its standard deviation of three replicate measurements; bthe relative standard deviation of three replicate measurements.
0.22 0.24 0.26 0.28 0.3 0.32
0 2 4 6 8 10 12
Absorb
ance
me / min
measurements showed that the changes in the absorbance, after keeping the membrane in water for 1 month, were less than 2%. This result denoted that the optode is very stable, so it could be stored for more than a week without losing its characteristics. Some reagents such as HCl, NaOH, EDTA, H2SO4, HNO3, KSCN and ethylene diamine were studied
as regenerating reagents. It was found that when applying 0.01 mol L−1 HNO
3, the best result was obtained and gave
short membrane regeneration times (25-30 s). The optode should be placed in buffer (pH 6) for 10-15 min before the next vanadium ion concentration measurement.
Repeatability and reproducibility
The repeatability and reproducibility of optical fiber sensors are other important parameters that were studied in this work. They were evaluated through repetitive exposure of the optode membrane into 5.00 µmol L−1 V(V) buffered
solution and 0.01 mol L−1 HNO
3 solution. The relative
standard deviation for the response of one membrane towards a 5.00 µmol L−1 of vanadium (V) solution was
1.14%.
Multiple usage of an optical sensor is feasible if the sensor can be easily regenerated and give reproducible responses. It was found that an HNO3 solution with a
concentration of 0.01 mol L−1 or higher can efficiently
remove any adsorbed V5+ from the membrane and return
its absorbance to its initial value in less than about 4 min. The reproducibility of the sensor response was tested by its multiple usages for V5+ monitoring in test solutions at
two concentration levels of 1.00 and 5.00 µmol L−1. After
each absorbance reading, the membrane was cleaned by 0.01 mol L−1 HNO
3 solution, pure water and a 0.01 mol L −1
acetate buffer solution. At both V5+ concentration levels,
good reproducibility were obtained. The corresponding relative standard deviation values were 1.07% and 1.17%, respectively.
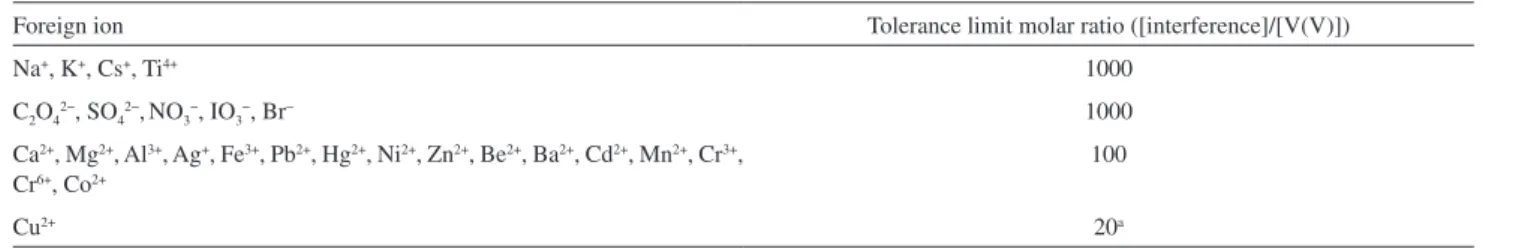
Interference study
The influence of various species on the absorbance of a solution mixture containing 5.0 µmol L−1 of V(V) was
investigated. An ion was considered as interference when its presence produced a variation in the absorbance of the sample greater than 5%. This increment of absorbance was evaluated at 490 nm (corresponding to the maximum absorption of V(V) complexes), in order to establish the different effects of the interfering ions on the analyte.
Among the interfering ions tested, as it is obvious from the data in Table 3, that Ca2+, Mg2+, Al3+, Ag+, Fe3+, Pb2+,
Hg2+, Ni2+, Zn2+, Be2+, Ba2+, Cd2+, Mn2+, Cr3+, Cr6+ and Co2+
ions with a concentration of at least 100 times of V5+ ion,
have no significant effect on the analytical signal. Also Na+,
K+, Cs+ and Ti4+ cations and some anions such as C 2O42−,
Table 2. Analytical characteristic of proposed method
Parameter V(V) V(IV)
Linear range / (µmol L−1) 0.3-32.83 0.60-28.50
Regression equation ∆A = 0.003 CV(V) + 0.0008 ∆A= 0.007 CV(IV) + 0.0045
R2 0.9975 0.9983
Limit of detectiona / (µg L−1) 0.12 0.18
RSD / % (n = 5) 2.1 1.34
aDetermined as 3 S
B/m (where SB and m are the standard deviation of the blank signal and the slope of the calibration graph, respectively).
Table 3. Comparison of detection limits of some methods for vanadium speciation
Complexing reagent Wavelength
spectrophotometry / nm Detection limit Matrix Ref.
3-hydroxy-2-(2-thienyl)-4H-chromen-4-one (HTC) as chromogenic reagent for V(V) and in 0.04-0.30 mol L−1 CH
3COOH medium
420 1.3 g mL−1 Synthetic and technical samples
43
Variamine blue (VB) as a chromogenic reagent for V(V) 570 0.1 g mL−1 Steel 44
1-(2-hydroxy-4-methoxybenzophenone)-4-phenylthiosemicarbazone (HMBPT) as chromogenic reagent for V(IV)
560 0.16 g mL−1 Natural water 45
Pyrogallol red as a ligand as chelating agent for V(IV) and V(V) − 0.6 g mL−1 V(IV)
0.3 g mL−1 V(V)
Real samples 46
Calmagite 490 0.12 µg L−1 V(IV)
0.18µg L−1 V(V)
Tap, rain and river water
SO4 2−,NO
3 −, IO
3
− and Br− concentrations up to 1000 times
of the analyte concentration were tolerated by the method. Cu2+ showed significant interference, but it could be
masked with the addition of glycin (0.1 mol L−1), making
an insoluble complex. The results are shown in Table 4.
Method validation and real sample analysis
For testing the practical application of the present sensor, some water samples were spiked with different amounts of vanadium (V) and (IV) ions and were analyzed and the concentrations of these ions were measured by the proposed optode. The recoveries were all satisfactory (95.2-106.1%). These experimental results revealed that the optode can be considered as an effective tool for analyzing the vanadium content of water samples (Table 5).
Conclusion
To sum up, we have presented a novel and simple optical sensor for V(V) determination, an inexpensive manner in aqueous solutions, offering qualitative and quantitative information. Preliminary requirements of the optode that are waste cellulose acetate film and solvents can be prepared
from cheap materials. In addition, the sensor successfully detected V(V) ions by changing the color from orange to red, reversibly. The sensor could readily be regenerated with nitric acid solution (0.01 mol L−1) and was fully reversible.
The obtained detection limit is very low (0.12 µg L−1 for
V(IV) and 0.18 µg L−1 for V(V)), which allows trace
vanadium determination by UV-Vis spectroscopy. The analytical characteristics of this optode compared with other literature methods for V(V) determination can be seen that the proposed method is more superior in terms of sensitivity and simplicity. The analysis of water samples revealed the reliability, selectivity and robustness of the proposed method (with total relative standard error less than 4%). These findings might open up new opportunities in the speciative spectroscopy of cations.
Acknowledgments
The authors wish to acknowledge the support of this work by Shiraz Payame Noor council university research.
References
1. Chen, Z.; Owens, L. G.; Anal. Chim. Acta 2008, 607, 1.
Table 4. Effect of interfering ions on the determination of 5 µmol L–1 of V5+
Foreign ion Tolerance limit molar ratio ([interference]/[V(V)])
Na+, K+, Cs+, Ti4+ 1000
C2O42−, SO
42−,NO3−, IO3−, Br
− 1000
Ca2+, Mg2+, Al3+, Ag+, Fe3+, Pb2+, Hg2+, Ni2+, Zn2+, Be2+, Ba2+, Cd2+, Mn2+, Cr3+, Cr6+, Co2+
100
Cu2+ 20a
aIn the presence of glycine (0.05 mol L−1).
Table 5. Result of vandium ions determination in spiked samples
Sample Concentration of V(V) / (µmol L
−1)
Recovery / % Concentration of V(IV) / (µmol L
−1)
Recovery / %
Added Founda Added Found
Tap water
0.0 NDb − 0.0 ND −
1.0 1.06 ± 0.32 106.1 5.0 4.97 99.4
5.0 4.95 ± 0.54 99.1 1.0 1.05 105.0
Rain water
0.0 ND − 0.0 ND −
1.0 0.98 ± 0.48 98.0 4.0 3.88 97.3
4.0 4.09 ± 0.56 102.2 1.0 0.95 95.2
River water
0.0 ND − 0.0 ND −
2.0 2.04 ± 0.63 102.3 2.0 2.03 101.5
3.0 3.13 ± 0.34 104.0 3.0 2.97 99.1
2. Rosen, A. L.; Hieftje, G. M.; Spectrochim. Acta, Part B 2004, 59, 135.
3. Naeemullah, K. T. G.; Tuzen, M.; Food Chem.2015, 172, 161. 4. Wadhwa, S. K.; Tuzen, M.; Kazi, T. G.; Soylak, M.; Talanta
2013, 116, 205.
5. Fernandes, K. G.; Nogueira, A. R. A.; Neto, J. A. G.; Nóbrega, J. A.; J. Braz. Chem. Soc.2004, 15, 676.
6. Khan, A. R.; Crans, D. C.; Pauliukaite, R.; Norkus, E.; J. Braz.
Chem. Soc.2006, 17, 895.
7. Pyrzynska, K.; Wierzbicki, T.; Talanta2004, 64, 823. 8. Tavallali, H.; Hosseini, G.; Am. Lab.2002, 25, 40. 9. Wang, D.; Wilhelmy, S. A. S.; Mar. Chem. 2008, 112, 72. 10. Taylor, M. J. C.; Staden, J. F. V.; Analyst1994, 119, 1263. 11. Committee on Biologic Effects of Atmospheric Pollutants;
Medical and Biologic Effects of Environmental Pollutants,
Vanadium, National Academy of Sciences: Washington, D.C.,
1974.
12. Waters, M. D.; Goyer, R. A.; Mehlma, M. A.; Advances in
Modern Toxicology, Toxicology of Trace Elements; Wiley: New
York, 1977.
13. Friberg, L.; Nordberg, G. R.; Vouk, V. B.; Handbook on the
Toxicology of Metals;Elsevier-North Holland Biomedical Press:
Amsterdam, 1979.
14. Davies, D. J. A.; Bennett, B. G.; Exposure Commitment
Assessments of Environmental Pollutants; University of London
Monitoring Assessment and Research Centre: London, 1983. 15. Bertona, P.; Martinisa, E. M.; Wuillouda, R. G.; J. Hazard.
Mater. 2010, 176, 721.
16. Naeemullah, T. M.; Kazi, T. G.; Citak, D.; Soylak, M.; J. Anal.
At. Spectrom. 2013, 28, 1441.
17. Pyrzynska, K.; Chem. Anal. 2006, 51, 339.
18. Gurkan, R.; Tamay, A.; Ulusoy, H. I.; Arabian J. Chem. 2012, in press.
19. De-Silva, A. P.; Gunaratne, N.; Gunnlaugsson, T.; Huxley, A. J. M.; Mc-Coy, C. P.; Rademacher, J. T.; Rice, T. E.; Chem. Rev.
1997, 97, 1515.
20. Valeur, B.; Leray, I.; Coord. Chem. Rev.2000, 205, 3. 21. Bakker, E.; Buhlmann, P.; Pretsch, E.; Chem. Rev. 1997, 97,
3083.
22. Pretsch, E.; Buhlmann, P.; Bakker, E.; Chem. Rev. 1998, 98, 1593.
23. Janata, J.; Josowicz, M.; Vanysek, P.; Devaney, D. M.; Anal.
Chem.1998,70, 179R.
24. Wolfbeis, O. S.; Anal. Chem.2006, 78, 3859.
25. Sanchez-Pedreno, C.; Ortuno, J. A.; Albero, M. I.; Garcia, M. S.; Valerom, M. V.; Anal. Chim. Acta2000, 414, 195.
26. Chan, W. H.; Yang, R. H.; Wang, K. M.; Anal. Chim. Acta2001, 444, 261.
27. Kuswandi, B.; Narayanaswamy, R.; Sens. Actuators, B2001, 74, 131.
28. Safavi, A.; Bagheri, M.; Sens. Actuators, B 2004, 99, 608. 29. Ensafi, A. A.; Fouladgar, M.; Sens. Actuators, B 2006, 113, 88. 30. Cano-Raya, C.; Fernandez-Ramos, M. D.; Gomes-Sanchez, J.;
Capitan-Vallvey, L. F.; Sens. Actuators, B 2006, 117, 135. 31. Khesri, B.; Amini, M. K.; Firooz, A. R.; Anal. Bioanal. Chem.
2008, 390, 1943.
32. Tavallali, H.; Shafiekhani, H.; Rofouei, M. K.; Payehghadr, M.;
J. Braz. Chem. Soc.2014, 25, 861.
33. Tavallali, H.; Vahdati, P.; Shaabanpur, E.; Sens. Actuators, B
2011, 159, 154.
34. Tavallali, H.; Shaabanpur, E.; Vahdati, P.; Spectrochim. Acta,
Part A2012, 89, 216.
35. Tavallali, H.; Ghanaat, P. J. M.; J. Serb. Chem. Soc. 2009, 74, 311.
36. Tavallali, H.; Daneshian, S.; Monatsh. Chem.2009, 140, 1149. 37. Vogel, A. I.; A Textbook of Quantitative Inorganic Analysis,
5th ed.; Longman: London, 1979.
38. Hashemi, P.; Abolghasemi, M. M.; Alizadeh, K.; Zarjani, R. A.;
Sens. Actuators, B 2008, 129, 332.
39. Pekiner, O. Z.; Naeemollah, T. M.; J. Ind. Eng. Chem.2014, 20, 1825.
40. Erdem, A.; Shahvan, T.; Cagir, A.; Eroglu, A. E.; Chem. Eng.
2011, 176, 76.
41. Zih-Perenyi, K.; Lasztity, A.; Horvath, Z.; Levai, A.; Talanta
1998, 47, 673.
42. Yamini, Y.; Alizadeh, N.; Shamsipur, M.; Anal. Chim. Acta
1997, 355, 69.
43. Agnihotri, N.; Dass, R.; Mehta, J. R.; J. Indian Chem. Soc.
1998, 75, 514.
44. Kumar, T. N. K.; Revanasiddappa, H. D.; J. Indian Chem. Soc.
2005, 2, 161.
45. Alk, M. A.; El-Asmy, A. A.; Yossef, W. M.; Anal. Sci.2005, 21, 1325.
46. Abbaspour, A.; Mirzajani, R.; Spectrochim. Acta, Part A2006,
64, 646.
Submitted: September 30, 2014