Printed in Brazil - ©2006 Sociedade Brasileira de Química 0103 - 5053 $6.00+0.00
Article
* e-mail: [email protected]
A Novel Potentiometric Naproxenate Ion Sensor Immobilized in a Graphite Matrix
for Determination of Naproxen in Pharmaceuticals
Alberto O. Santini, José E. de Oliveira, Helena R. Pezza and Leonardo Pezza*
Instituto de Química, Universidade Estadual Paulista, CP 355, 14801-970 Araraquara-SP, Brazil
As características, o desempenho e a aplicação de um eletrodo do tipo Pt⎪Hg⎪Hg2(NAP)2⎪
Graphite, onde NAP=íon naproxenato, são descritas. O eletrodo responde a NAP com sensibilidade de (58,1± 0,9) mV década-1 no intervalo de 5,0 × 10⁻⁵ - 1,0 × 10⁻² mol L-1 , a pH 6,0-9,0 e com um limite de detecção de 3,9 × 10⁻⁵ mol L-1. O eletrodo é de baixo custo e facilmente construído, apresenta um rápido tempo de resposta (10-35 s) e pode ser usado por um período de seis meses sem qualquer divergência considerável nos potenciais. O sensor supracitado mostrou boa seletividade para naproxeno na presença de várias substâncias, tais como carboxilatos e ânions inorgânicos, sendo aplicado na análise direta de naproxeno em medicamentos (comprimidos) via método da adição de padrão. Os resultados analíticos obtidos com o eletrodo proposto estão em boa concordância com aqueles obtidos pelo procedimento preconizado na Farmacopéia Americana.
The characteristics, performance, and application of an electrode, namely, Pt⎪Hg⎪Hg2(NAP)2⎪ Graphite, where NAP stands for naproxenate ion, are described. This electrode responds to NAP with sensivity of (58.1± 0.9) mV decade-1 over the range 5.0 × 10⁻⁵ - 1.0 × 10⁻² mol L-1 at pH 6.0-9.0 and a detection limit of 3.9 × 10⁻⁵ mol L-1. The electrode is easily constructed at a relatively low cost with fast response time (within 10-35 s) and can be used for a period of 6 months without any considerable divergence in potentials. The proposed sensor displayed good selectivity for naproxen in the presence of several substances, especially concerning carboxylate and inorganic anions. It was used for the direct assay of naproxen in commercial tablets by means of the standard additions method. The analytical results obtained by using this electrode are in good agreement with those given by the United States Pharmacopeia procedure.
Keywords: naproxenate-sensitive electrode, potentiometry, pharmaceutical formulations
Introduction
Naproxen [(+)-2-(6-metoxy-2naphthyl)propionic acid], is a non-steroidal anti-inflammatory drug that also presents analgesic and antipyretic properties often preferred to acetylsalicylic acid because of its better absortion following oral administration and fewer adverse effects.
Naproxen is extensively used in the treatment of many diseases like rheumatoid arthrits, degenerative joint disease, ankylosing spondylits, acute gout and primary
dismenorrea.1 Like other non-steroidal anti-inflammatory
drugs, it inhibits the biosyntesis of prostaglandins.1
The United States Pharmacopeia2 2003 reports an
high-performance liquid chromatography (HPLC) method for the determination of naproxen tablets.
Several analytical methods have been reported for the determination of naproxen in pharmaceutical preparations
including UV-visible spectrophotomery,3-5
spectro-fluorimetry,6-8 room temperature phosphorimetry,9,10
voltametry,11 high-performance liquid chromatography,12-14
capillary electrophoresis,15,16 coulometry17 and oscilometric
titration.18
However, most of these techniques are time-consuming, involving the use of organic solvents or require expensive and sophisticated instruments and for this reason they are not suitable for routine analysis.
To the best of our knowledge, there are limited reports in the scientific literature on the use of ion-selective potentiometric sensors for the determination of naproxen
in pharmaceutical formulations.19,20
Valsami et al.19 described the construction of a
NAP-selective electrode of the liquid membrane type, based on the use of a tetraheptylammonium naproxenate ion pair as the ion exchanger. This electrode responded to NAP with
sensivity of (58 to 61) mV decade-1 over the range 1.0 × 10⁻¹
-1.0 × 10⁻⁴ mol L-1 at pH 9.0 (borate buffer). The electrode
exhibited a fast response time (5 s) and had an operative life of 2 months. No interference from common ions (with the exception of chloride ion) and tablet excipients was observed. The proposed sensor was used for the determination of naproxen in pharmaceuticals.
Lenik et al.20 developed an ion-selective membrane
electrode based on ion-pair complex of naproxen with methyltrioctylammonium. This electrode showed Nerstian
response for NAP over the concentration range of 1.0 ×
10-1 – 1.0 × 10⁻⁴ mol L-1 at pH 5.5 – 8.5 and a detection
limit of 5.0 × 10⁻⁵ mol L-1. The proposed sensor exhibited
a short response time (20 s) and had an operative life of 3 months. Selectivity was good over a number of organic and inorganic ions. The electrode was applied for the determination of naproxen in tablets.
Previous work from this laboratory dealt with the development of mercury(I)-carboxylate electrodes and
their application to solution equilibria,21-25 food analysis,26
and pharmaceutical analysis27,28 involving carboxylate
bearing compounds.
In this work, the preparation of a simple and
low-cost electrode, namely Pt⎪Hg⎪Hg2(NAP)2⎪Graphite,
where NAP stands for naproxenate ion, is described. The investigation of the experimental variables that contribute to the electrode response led to the development of a simple, selective and reliable method for naproxen determination. Studies on the deter-mination of naproxen in commercial tablets were carried out to illustrate the feasibility of the proposed method. Furthermore, as both the electrode and the standard potentiometric equipment are low-cost, the developed procedure also allows small laboratories with limited resources to run naproxen analyses for the aforementioned samples.
Experimental
Reagents
High purity deionized water (resistivity 18.2 MΩ cm)
obtained by using a Milli-Q Plus system (Millipore Corp.,
Bedford, MA, USA) was used throughout. All reagents employed were of analytical grade and obtained from E. Merck (Darmstadt, Germany) except naproxen sodium salt, which was supplied by Sigma (St. Louis, MO, USA). Standardizations of carbonate-free sodium hydroxide, nitric acid and sodium nitrate stock solutions were
performed as described elsewhere.21,25 Metallic mercury
was purified according to a previously reported
procedure.21 The sodium naproxenate stock solution was
analysed by evaporating and drying to constant weight at
120 oC. Mercury(I) naproxenate was prepared by mixing,
in aqueous solution, the corresponding nitrate with an excess of sodium naproxenate. The resulting precipitate was filtered through a sintered glass funnel, washed with deionized water until nitrate free, and then dried in a desiccator, over calcium chloride under reduced pressure, at room temperature, to constant mass. A white powder was obtained as the final product.
Electrode preparation and conditioning
The mercury(I) naproxenate indicator electrode was prepared as follows: mercury(I) naproxenate (1.4 g) and
metallic mercury (ca. 0.2 g) were mixed in an agate
mortar and the material was crushed until a homogeneous solid was obtained. Pure powdered graphite (0.7 g) was then added and the crushing process was continued until perfect homogenization was attained. Part of the resulting solid was transferred to a press mold, being compressed at 8 tons for about 5 min. The black pellet (1.5 mm thick, 12 mm o.d., and 0.6 g mass) was fixed at one end of a glass tube (12 mm o.d., 80 mm long) with a silicone-rubber glue (“Rhodiastic”, Rhône-Poulenc, France) and
allowed to dry for 48 h. Sufficient metallic mercury (ca.
0.6 g) was then introduced into the tube to produce a small pool on the inner pellet surface; electric contact was established through a platinum wire plunged into the mercury pool and a subsequent conductor cable. The resulting electrode is diagrammed in Figure 1, showing that it is sealed. This feature, coupled with the small amount of metallic mercury placed inside the electrode
(ca. 0.6 g), stresses that the considered sensor does not
offer significant risk to the operator’s health and can thus be recognized as safe.
When not in use, the electrode’ s pellet was kept
immersed in a small volume of 1.0 × 10⁻² mol L-1 sodium
naproxenate solution whose ionic strength (µ) was adjusted
to 0.500 mol L-1 with a sodium nitrate solution. Before
Instruments
The electromotive force (emf) values were read to the
nearest 0.1 mV with a Metrohm model 692 pH⎪ion meter
(Metrohm Ltd., Herisau, Switzerland).
The reference electrode was a Metrohm Ag⎪AgCl
double junction, model 6.0726.100. The pH of aqueous solutions was adjusted and monitored with the aid of a Metrohm pH electrode, model 6.0234.100. A thermostated
titration cell (25.0 ± 0.1 oC) was employed.
The standard procedure of the United States Pharmacopeia(USP) employed for the assay of naproxen
in tablets formulations utilizes an HPLC method.2
Chromatographic analysis were carried out on a Shimadzu model SPD-10A liquid chromatograph (Shimadzu Seisakusho, Kyoto, Japan), equipped with a LC-10 AS pump (Shimadzu), variable UV-Visible detector (model SR – 10A, Shimadzu) set at 254 nm, gradient control (Waters, model 680; Waters Chromatography Div., Milford, MA, USA) and a
“Rheodyne” 20 µL injector (Rheodyne, Inc., Berkeley,
CA, USA). A stainless steel “Microsorb LC-18”
analytical column (250 mm × 4.6 mm i.d., Varian, Walnut
Creek, CA, USA) with 5 µm particle size packing
material was used. Before injection the samples were
filtered through a Millex unit (Millex-HV, 0.45 µm,
Millipore). Chromatograms were recorded and the areas were measured with an integrator (Waters, mod. 746 recording integrator).
Volume measurements ( ± 0.001 mL) were performed with a Metrohm model 665 automatic burette.
All experiments were performed in a thermostated
room, maintained at 25 ± 1 oC.
Potentiometric cell
The following cell was used,
where NAP stands for naproxenate ion and x was in the
range 10-2 - 10-6 mol L-1. The ionic strength of the cell
compartments was kept constant at 0.500 mol L-1. The
outer compartment of the reference electrode was refilled
periodically with fresh NaNO3 solution.
The performance of the mercury(I) naproxenate electrode was assessed by measuring the emf of the
aforementioned cell for 1.0 × 10⁻² to 1.0 × 10⁻⁶ mol L-1
sodium naproxenate solutions. These solutions were freshly
prepared by serial dilution of a 2.0 × 10⁻² mol L-1 stock
standard solution with deionized water, at constant pH (8.0 ± 0.1). The emf readings were obtained for solutions under stirring and recorded when they became stable. A typical calibration plot of the electrode is shown in Figure 2.
Determination of naproxenate ion in commercial tablets
The analysed products were purchased locally or directly from the manufacturers and all were tested prior to the listed expiration date. Six pharmaceutical formulations containing the active compound as naproxen or sodium naproxen and other components were analysed with the naproxenate-sensitive electrode.
Twelve tablets of each sample were weighed to calculate the average tablet weight. They were finely powdered and homogenized. A quantity of the resulting powder equivalent
Figure 2. Calibration graph for the proposed naproxenate –sensitive elec-trode ( pH 8.0, μ =0.500 mol L-1 adjusted with NaNO
3, T= 25 oC).
Figure 1. Mercury(I) naproxenate electrode: (A) conductor cable, (B) banana plug, (C) metallic mercury, (D) Pt wire, (E) silicone glue, (F) sen-sor pellet (Graphite⎪Hg2(NAP)2⎪Hg).
(-)Ag⎪AgCl [NaCl](aq)= [NaNO3](aq) = [NaNAP](aq)= Graphite 0.010 mol L-1 0.500 mol L-1 x mol L-1 ⎪Hg
2(NAP)2⎪
to about 25 mg of naproxen or sodium naproxenate was accurately weighed and placed in a glass vessel; 70 mL of water was added and magnetically stirred for 10 min. The resulting mixture was filtered and its ionic strength was
adjusted to 0.500 mol L-1 with NaNO
3 and the pH to 8.0 ±
0.1 with 1.0 × 10⁻² mol L-1 NaOH or 1.0 × 10⁻² mol L-1
HNO3 before volume completion. The resulting solution
was quantitatively transferred to a 100 mL volumetric flask using deionized water (pH = 8.0 ± 0.1) for rinsing and volume completion. An aliquot of 25 mL is employed for analysis with the naproxenate-sensitive electrode.
Results and Discussion
Effect of the ionic strength
The choice of a suitable ionic strength value at which the potentiometric sensor exhibits the best response is also
of prime importance in quantitative analysis.21,28 The potential
values of the mercury(I) naproxenate electrode at different
ionic strengths (0.500 – 3.00 mol L-1, NaNO
3) have been
determined at 25 oC, pH 8.0 and naproxenate concentrations
between 5.0 × 10⁻⁵ to 1.0 × 10⁻² mol L-1. It was found that the
electrode followed a near-Nernstian behaviour for µ
comprised between 0.500 and 3.00 mol L-1. Therefore, for
practical purposes the ionic strength was kept constant at
0.500 mol L-1 (adjusted with NaNO
3) during the
poten-tiometric measurements.
Electrode response
Experiments carried out as described in the subsection “Potentiometric Cell” led to the following linear relationship between the measured emf (E, in mV) and naproxenate ion concentration;
E = E0 + S p[NAP]
where E0 is the formal cell potential and S represents the
Nernst coefficient (59.16 mV decade-1, at 25 oC, for
monovalent ions). Potentiometric parameters and other features associated with the mercury(I) naproxenate electrode are given in Table 1. The above calibration equation and the slope value (Table 1) show that the
electrode provides a near-Nernstian response to the
naproxenate ion in the range of 1.0 × 10⁻² to 5.0 × 10⁻⁵
mol L-1. The limit of detection,29 as determined from the
intersection of the two extrapolated segments of the
calibration graph (Figure 2), was 3.9 × 10⁻⁵ mol L-1 . The
sensor response displayed good stability and repeatability over the tests; the last mentioned feature is illustrated by the standard deviation values shown in Table 1.
Response time and lifetime of the electrode
The response time of the electrode29 was tested by
measuring the time required to achieve a steady state
potential (within ± 0.3 mV min-1), for 1.0 × 10⁻² to 5.0 ×
10-5 mol L-1 sodium naproxenate solutions at pH 8.0. The
electrode yielded steady potentials within 10 to 15 s at
high concentrations ( ≥ 1.0 × 10⁻³ mol L-1) and about 35 s
at concentrations near the detection limit. Detectable loss of performance characteristics has not been found after using the electrode up to 6 months.
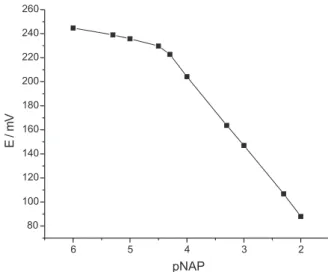
pH effect
The influence of pH on the electrode response was
tested over the pH range 4.0-10.0 for 1.00 × 10⁻², 1.00 ×
10-3 and 1.00 × 10⁻⁴ mol L-1 naproxenate ion concentrations.
The resulting solutions’ pH(s) were adjusted with diluted
HNO3 or NaOH solutions.
For pH values below 6.0, significant fractions of
naproxenate ion (pKa=4.48)30 changes to the
corres-ponding protonated form which is not detected by the electrode. For pH > 9.0, the hydroxide ion interferes with the electrode’s response (Figure 3). The emf values are independent of pH in the range 6.0-9.0; this can be taken as the working pH range of the electrode.
Electrode selectivity
The most important characteristic of any ion sensitive sensor is its response to the primary ion in the presence of other ions present in solution, which is expressed in terms of the potentiometric selectivity coefficient. The potentiometric selectivity coefficients for the mercury(I)
naproxenate electrode (KNAP,M ) were determined, for a
Table 1. Potentiometric response characteristics of the mercury (I) naproxenate electrodea
Slope (mV decade-1)b Intercept, E0 (mV)b Linear range (mol L-1) Detection limit (mol L-1)
58.1 ± 0.9 -27.7 ± 1.6 5.0 × 10⁻⁵ – 1.0 × 10⁻² 3.9 × 10⁻⁵
aT = 25.0 ± 0.1 oC; pH 8.0 ± 0.1; µ = 0.500 mol L-1 (NaNO 3).
bAverage value + SD of 25 determinations over a period of 6 months. Number of data points:
number of anions (M), by the matched potential method
(MPM).31-33 In this method, the selectivity coefficient is
defined by the ratio of the activity of the primary ion relative to an interfering ion, when they generate identical potentials in the same reference solution. In the MPM method, both monovalent and divalent ions are treated in the same manner and the valence of the ions does not influence the selectivity coefficient. Furthermore, the MPM can be used with no regard to
the electrode slopes being Nernstian or even linear.34
Mainly for these reasons, it has increased in popularity
in the last few years.35
The MPM-selectivity coefficients (KNAP,M) were
determined under the following conditions: Initial
reference solution (pH 8.1) contains 0.500 mol L-1 NaNO
3
as a supporting electrolyte and 5.0 × 10⁻⁵ mol L-1 of the
primary ion (naproxenate). The selectivity coefficients were calculated from the concentration of the interfering ion (M), which induced the same amount of the potential
change ( Δemf = 20.0 mV ) as that induced by increasing
the concentration of primary ion. The resulting values of KNAP,M are presented in Table 2.
The results comprised in the aforementioned Table 2 show that the selectivity of the mercury(I) naproxenate electrode towards all tested organic acid anions is good. No interference was noted for most of the common excipients used in tablet formulations such as glucose, lactose, talc, starch, magnesium stearate, cellulose, microcrystaline cellulose, hydroxypropyl-methylcellulose, titanium dioxide, silica, polyethyleneglycol, polyvinylpirrolidone, povidone, mannitol and sorbitol.
Sulphate and borate have a very low selectivity coefficient (Table 2); no interference at all is caused by nitrate or perchlorate and they can therefore be used as background electrolytes or ionic strength adjusters for naproxenate solutions before performing potentiometric measurements.
Chloride ion interferes as shown in Table 2. However, the influence due to this ion can be eliminated by a preliminary chloroform extraction procedure. In the samples analysed in this work (tablets), chloride ion is seldom found and hence the proposed electrode can be used for direct determination of naproxenate in these pharmaceutical formulations without previous extraction procedures.
Analytical application
A standard addition method (multiple addition
method)36-38 was employed for potentiometric naproxen
estimation in tablets formulations by using the presently proposed naproxenate – sensitive electrode.
The results, along with those obtained by applying
the official method of USP2 to the same samples, are given
in Table 3. For all samples assayed, the results obtained by official method and electrode method were compared
by applying the F-test and t-test at 95% confidence level.
In all cases, the calculated F and t values did not exceed
the theoretical values, indicating that there is no significant difference between either methods in concerning precision
Table 3. Naproxen determination in tablets formulations
Samples Label to content Electrode Method USP2
Found (mg unit-1) RSDf (%) (n = 6) Found (mg unit-1) RSDf (%) (n = 6)
Tablets
1 275a 277.9 ± 4.6c te =1.25, Fe = 2.71 1.6 273.8 ± 4.9c 1.8
2 550a 545.2 ± 9.8c te = 1.08, Fe= 2.41 1.8 556.6 ± 8.9c 1.6
3 500b 496.3 ± 7.4d te = 1.27, Fe= 2.78 1.5 497.1 ± 8.2d 1.6
4 250b 246.7 ± 3.9d te = 1.05, Fe= 2.43 1.6 247.8 ± 4.3d 1.7
5 500a 507.2 ± 7.1c te = 1.38, Fe= 2.50 1.4 505.9 ± 8.8c 1.7
6 250b 252.6 ± 3.7d te = 1.37, Fe= 2.85 1.5 249.1 ± 5.2d 2.1
aDeclared concentration of naproxen (sodium salt) in mg unit-1. bDeclared concentration of naproxen in mg unit-1. cValues found are the average of six
independent analyses (n = 6) ± the corresponding Standard Deviation (SD), expressed as sodium naproxenate. dValues found are expressed as naproxen. eValues of t and F at 95% confidence level; theoretical values : t = 2.23 , F= 5.05. fRelative Standard Deviation (RSD).
Table 2. Selectivity coefficients (KNAP,M ) for various anionsa
Anion K DCF , M
Formate 2.3 × 10⁻⁴
Acetate 1.9 × 10⁻³
Propionate 1.4 × 10⁻³
Citrate 3.8 × 10⁻³
Lactate 3.1 × 10⁻³
Tartrate 2.0 × 10⁻³
Benzoate 5.3 × 10⁻³
Salicylate 6.7 × 10⁻³
Phthalate 4.8 × 10⁻³
Oxalate 3.5 × 10⁻³
Chloride 2.1
Sulphate 3.9 × 10⁻⁵
Borate 4.3 × 10⁻⁶
Perchlorate no interference
Nitrate no interference
aSelectivity coefficients were determined by matched potential method.
and accuracy in the determination of naproxen in pharmaceuticals.
In order to investigate the presence of matrix effects on the proposed method, a recovery study was carried out. In
this study 100, 200 and 300 mg L-1 of naproxenate reference
solutions were added in three representative pharmaceuticals (samples 1, 3, 6) from those listed in Table 3. The results presented in Table 4 show that the recoveries were found to be close to 100%; the SDs were within 0.9-1.5.
The statistical parameters and the recovery data reveal good accuracy and precision of the proposed method and the absence of significant matrix effects on the potenciometric measurements.
The time required for performing analyses by the
electrode method was 20-30 minutes per sample.
Conclusions
The proposed electrode exhibits long lifetime, good stability, sensitivity, precision, accuracy and selectivity. It is low-cost, easy to prepare and to use. Its usefulness for naproxen determination in real samples, particularly
for some commercial naproxen tablets was demonstrated suggesting its use as a reliable and advantageous
alternative to the USP method2 as well as to most other
previously reported methods in the routine control of naproxen concentration in these samples. The electrode developed in this laboratory is superior (especially concerning lifetime and simplicity) as compared with naproxenate ion selective electrodes described in the
literature.19,29
Acknowledgments
We would like to thank FAPESP, CNPq , CAPES and FUNDUNESP Foundations (Brazil), for financial support.
References
1. Todd, P. A.; Clissold, S. P.; Drugs 1990, 40, 91.
2. United States Pharmacopeia National Formulary, USP 26, NF 21, Rockville, 2003, p.1273.
3. Kanoute, G; Nivaud, E.; Paulet, B; Boucly, P.; Talanta 1984, 31, 144.
4. Mahrous, M. S.; Abdel-Khakel, M. M.; Abdel-Mamid, M. E.; J. AOAC 1985, 68, 535.
5. Khan, I. U.; Aman, T.; Ashraf, A.; Kazi, A. A.; Anal.Lett. 1999, 32, 2035.
6. Damiani, P.; Bearzotti, M.; Cabezón, M. A.; J. Pharm. Biomed. Anal. 2002, 29 229.
7. Wu, D.; Yaowu-Fenxi-Zazhi 1999, 19, 62 (Analytical Abstracts 1980-2005/10; # 6105G00041).
8. Tang, H.; Wang, K.; Yaowu-Fenxi-Zazhi 1990, 10, 358 (Analytical Abstracts 1980-2005/10; # 5305G00027). 9. Aranciba, J. A.; Scandar, G. M.; Analyst 2001, 126, 917. 10. Zhu, G.; Ju, H.; Anal. Chim. Acta 2004, 506, 177.
11. Adhoum, N.; Monser, L.; Toumi, M.; Boujlel, K.; Anal. Chim. Acta 2003, 495, 69.
12. Ekpe, A.; Tong, J.; Rodriguez, L.; J. Chromatogr. Sci. 2001, 39, 81.
13. Mikami, E.; Goto, T.; Ohno, T.; Matsumoto, H.; Nishida, N.; J. Pharm. Biomed. Anal. 2000, 23, 917.
14. Moir, D.; Beaulieu, N.; Curran, N.; Lovering, E.; J. AOAC 1990, 73, 902.
15. Sadecka, J.; Cakrt, M.; Hercegova, A.; Polonsky, J.; Skacani, I.; J. Pharm. Biomed. Anal. 2001, 25, 881.
16. Fillet, M.; Fotsing, L.; Bonnard, J.; Crommen, J.; J. Pharm. Biomed. Anal. 1998, 18, 799.
17. Cawrych, Z.; Szyszko, E.; Acta Pol. Pharm. 1979, 36, 569. 18. Pomazanska-Kolodziejska, T.; Acta Pol. Pharm. 1983, 40, 357. 19. Valsami, G.N.; Macheras, P.E.; Analyst 1989, 114, 387. 20. Lenik, J.; Dumkiewicz, R.; Wardak, C.; Marczewska, B.; Acta
Pol. Pharm., 2002, 59, 171. Table 4. Recovery data for sodium naproxenate spiked in
pharmaceuti-cal formulations
Formulation Concentration Concentration Recoverya
added (mg L-1) found (mg L-1) (% ±SD)
100 97.9 97.9 ± 1.3
1 (tablet) 200 196.8 98.4 ± 0.9
300 297.9 99.3 ± 1.0
100 98.1 98.1 ± 1.1
3 (tablet) 200 201.8 100.9 ± 1.0
300 302.1 100.7 ± 0.9
100 98.3 98.3 ± 1.5
6 (tablet) 200 198.8 99.4 ± 1.3
300 303.6 101.2 ± 1.1
aAverage of six determinations ± standard deviation (SD).
Figure 3. Effect of pH on the electrode’s response at : ( ) 1.0 × 10⁻² mol
L-1 NAP, ({)1.0 × 10⁻³ mol L-1 NAP, (S)1.0 × 10⁻⁴ mol L-1 NAP ; µ =0.500
mol L-1 adjusted with NaNO 3 , T= 25
21. Pezza, L.; Molina, M.; Moraes, M.; Melios, C. B.; Tognolli, J. O.; Talanta 1996, 43, 1689.
22. Pezza, L.; Molina, M.; Melios, C. B.; Moraes, M.; Tognolli, J. O.; Talanta 1996, 43, 1697.
23. Moraes, M.; Pezza, L.; Melios, C. B.; Molina, M.; Pezza, H. R.; Villafranca, A. C.; Filho, J. C.; Ecl. Quim. 1996, 21, 133. 24. Pezza, L.; Molina, M.; Melios, C. B.; Moraes, M.; Tognolli, J.
O.; Gomes, H. M.; Intern.J. Environ. Anal. Chem. 1997, 68, 295.
25. Cavalheiro, A. C. V.; Moraes, M.; Pezza, L.; Ecl. Quim. 2000,
25, 123.
26. Pezza, L.; Santini , A. O.; Pezza, H. R.; Melios, C. B.; Ferreira, V. J. F.; Nasser, A. L. M.; Anal. Chim. Acta 2001, 433, 281. 27. Peres, A. M.; Moraes, M.; Pezza, L.; Pezza, H. R.; Melios, C.
B.; Microchem. J. 1998, 60, 184.
28. Ferreira, V. J. F.; Cavalheiro, A. C. V.; Fagnani, E.; Moraes, M.; Pezza, L.; Pezza, H. R.; Melios, C. B.; Anal. Sci. 1999, 15, 249.
29. Buck, R. P.; Lindner, E.; Pure Appl. Chem. 1994, 66, 2527. 30. Ràfols, C.; Rosés, M.; Bosch, E.; Anal. Chim. Acta 1997, 338,
127.
31. Gadzekpo, V. P. Y.; Christian, G. D.; Anal. Chim. Acta1984, 164, 279.
32. Christian, G. D.; Analyst 1994, 119, 2309.
33. Umezawa, Y.; Umezawa, K.; Sato, H.; Pure Appl. Chem. 1995,
67, 507.
34. Bakker, E.; Bühlmann, P.; Pretsch, E.; Chem. Rev. 1997, 97, 3083.
35. Mazloum, M.; Amini, M. K.; Baltork, I. M.; Sens. Actuators, B 2000, 63, 80.
36. Christian, G. D.; O’Reilly, J. E.; Instrumental Analysis, Allyn & Bacon: New York, 1986, p. 42.
37. Bader, O. M.; J. Chem. Educ. 1980, 57, 703.
38. Li, G.; Polk, B. J.; Meazell, L. A.; Hatchett, D. W.; J. Chem. Educ. 2000, 77,1049.
Received: November 11, 2005
Published on the web: June 6, 2006