doi: 10.1590/0037-8682-0196-2016
Major Article
Corresponding author: Dr. Pedro Emmanuel Alvarenga Americano do Brasil.
e-mail: [email protected] Received 23 May 2016
Accepted 14 June 2016
Does my patient have chronic Chagas disease? Development
and temporal validation of a diagnostic risk score
Pedro Emmanuel Alvarenga Americano do Brasil
[1], Sergio Salles Xavier
[1],
Marcelo Teixeira Holanda
[1], Alejandro Marcel Hasslocher-Moreno
[1],
and José Ueleres Braga
[2][1]. Laboratório de Pesquisa Clínica em doença de Chagas, Instituto Nacional de Infectologia Evandro Chagas, Fundação Oswaldo Cruz,
Rio de Janeiro, Rio de Janeiro, Brasil. [2] Departamento de Epidemiologia e Métodos Quantitativos em Saúde,
Escola Nacional de Saúde Pública, Fundação Oswaldo Cruz, Rio de Janeiro, Rio de Janeiro, Brasil.
Abstract
Introduction: With the globalization of Chagas disease, unexperienced health care providers may have dificulties in identifying
which patients should be examined for this condition. This study aimed to develop and validate a diagnostic clinical prediction
model for chronic Chagas disease. Methods: This diagnostic cohort study included consecutive volunteers suspected to have chronic Chagas disease. The clinical information was blindly compared to serological tests results, and a logistic regression model was it and validated. Results: The development cohort included 602 patients, and the validation cohort included 138 patients. The Chagas disease prevalence was 19.9%. Sex, age, referral from blood bank, history of living in a rural area, recognizing the kissing bug, systemic hypertension, number of siblings with Chagas disease, number of relatives with a history of stroke, ECG with low voltage, anterosuperior divisional block, pathologic Q wave, right bundle branch block, and any kind of extrasystole were included in the inal model. Calibration and discrimination in the development and validation cohorts (ROC AUC 0.904 and 0.912, respectively) were good. Sensitivity and speciicity analyses showed that speciicity reaches at least 95% above the predicted 43% risk, while sensitivity is at least 95% below the predicted 7% risk. Net beneit decision curves favor the
model across all thresholds. Conclusions: A nomogram and an online calculator (available at http://shiny.ipec.iocruz.br:3838/
pedrobrasil/chronic_chagas_disease_prediction/) were developed to aid in individual risk estimation.
Keywords: Chagas disease. Signs and symptoms. Diagnosis. Sensitivity and speciicity. Nomograms.
INTRODUCTION
Chagas disease is increasingly under control in Latin America(1), but it is spreading with the migration of Latin Americans(2) (3) (4). The burden created by Chagas disease is
currently similar to or exceeding those of other prominent
diseases globally(5). Several countries in which Chagas disease
was not considered to be endemic until the 1990’s are identifying
cases of Chagas disease among immigrants, and occasional transmission through blood transfusion or organ transplantation has also been observed(4). Therefore, unexperienced health care providers may eventually need to decide whether or not to screen or conduct diagnostic investigations for chronic Chagas disease. Current guidelines for diagnosing chronic Chagas disease recommend mainly serological tests and occasional molecular tests(2) (6) (7) (8) (9) (10) (11) (12) (13). However, explicit guidelines for
which patients should undergo diagnostic investigation are
scarce. This lack of formal recommendations makes screening, diagnostic investigations, and decision-making less rigorous and
leads to more individual choices by physicians.
The problem with diagnostic investigation of Chagas disease
is that up to half of patients with chronic Chagas disease have the indeterminate form(14) (15), and many of those with cardiac or gastrointestinal involvement are asymptomatic(14). Therefore, it is challenging, even for health care providers with many years of
experience in the ield. This study aimed to develop and validate
a diagnostic decision support tool for chronic Chagas disease.
METHODS
Participants
This is a phase 3 diagnostic research project(16), which was conducted between April 2008 to May 2012 (development phase) and from June 2012 to July 2014 (validation phase)
at Evandro Chagas National Institute of Infectious Diseases [Instituto Nacional de Infectologia Evandro Chagas (INI)]
(FIOCRUZ)] in Rio de Janeiro, Brazil. Volunteers were selected
sequentially from all medical appointments in the study period.
These patients sought Chagas disease diagnosis and follow-up after referral or of their own volition. The inclusion criteria were (a) suspicion of chronic Chagas disease and (b) written consent to serve as a volunteer. The exclusion criteria were (a) previously diagnosed Chagas disease with supporting test results, (b) inability to comply with procedures of the research protocol, (c) suspected acute Chagas disease, (d) and pregnancy.
Procedures
Potential volunteers were interviewed for research screening by a physician. Once written consent was obtained, the volunteer was evaluated using a structured interview with a template questionnaire, which was recorded in the medical
chart. Serological tests, electrocardiogram (ECG), and chest radiographs were ordered at this irst evaluation. Within 20 to
40 days after the screening visit, the volunteers returned to the
outpatient clinic. At the end of the medical evaluation, the ECG,
radiographs, and serological tests were assessed and discussed with the patient. During the medical interviews, pictures of
kissing bugs, mud houses, leishmaniasis-mediated ulcers, and Romaña’s signs were shown to the patients. Professionals conducting clinical interviews, ECG results, and radiographs,
as well as the serological test results were blinded to serological
tests results and vice-versa. Therapy and follow-up were offered as judged necessary, according to current guidelines(6).
Predictors
Information about potential Trypanosoma cruzi infection, symptoms, and findings on complementary tests were investigated as potential predictors of Chagas disease, along with history of living in a rural area, history of living in mud
houses, recognizing the kissing bug in pictures, history of blood
transfusions, history of siblings with Chagas disease, dysphagia
or persistent constipation, ECG indings, and enlarged heart on
chest radiographs with oral barium contrast.
Reference standard
The following commercial serological tests were used as reference tests for Chagas disease classiication in different
research periods according to test availability at INI: Wiener
lab’s ELISA (Wiener Lab, Rosario, Argentina), Pathozyme Chagas (Omegam Diagnostics, Scotland, UK), ELISA Biozima Chagas (Lemos Lab, Argentina), WAMA’s Immuno-con Chagas (WAMA, São Paulo, Brazil), Biocientiica Immunoluor Chagas (Biocientiica, Buenos Aires, Argentina), Chagas-ELISA (Ebram Produtos Laboratoriais Ltda, São Paulo, Brazil), and Anti-Chagas Symbiosys (Symbiosys Ltda, São Paulo, Brazil). These tests were performed according to the respective manufacturer’s
instructions in the immunodiagnosis laboratory at INI. Diagnostic investigations were conducted and interpreted as
recommended by the Brazilian consensus on Chagas disease(6). Briely, patient samples were submitted for two serological tests conducted in parallel, an enzyme linked immune-sorbent assay (ELISA) and an indirect immunoluorescence (IIF) test. Patients were classiied as with Chagas disease if both serological tests
were positive, and they were classiied as without Chagas
disease if both serological the tests were negative. If there was disagreement among serological tests results leading to an inconclusive diagnosis, additional blood samples were collected
to perform the serological tests until a deinitive diagnosis was
reached.
Ethical considerations
The project was evaluated and approved by the institutional review board/ethic committee for research with human subjects, registered at SISNEP with the number 0045.0.009.000-07.
Procedures followed were in accordance with the ethical standards and all volunteers signed a written consent.
Data analysis plan
Multiple imputations with chain equations were conducted
to ill missing data(17). After comparison of several models, a
logistic regression was chosen. Potential predictors matching
the following conditions were not explored: a) unacceptable reliability (data not shown); b) less than 10 events; or c) co-linearity in the full model with a variance inlation factor higher
than 10. Continuous predictors were tested for functional form with restricted cubic splines and were truncated if a range
without relationship to the outcome was detected. Backwards
removal of predictors from a full model was applied, and only
predictors identiied as signiicant at 5% using the Akaike information criteria (AIC) were retained in the inal model, even if after penalizing the model the p values were higher than
5%. The full model was initially composed of signs, symptoms, and history of exposure available at the moment of diagnostic investigation. Additionally, other information (e.g., referral and comorbidities) that we thought could be relevant in clinical decision-making was also evaluated. This was initially based
on chronic Chagas disease guidelines and our own practice.
The full model initially included sex, age, referral from blood bank, history of living in a rural area, history of living in mud houses, recognizing the kissing bug from pictures, history of Romaña’s sign, history of blood transfusion, systemic hypertension, history of coronary disease, history of stroke,
number of siblings, number of siblings with Chagas disease,
mother with heart disease, number of relatives (brothers, sisters, mother, or father) with history of stroke, use of medicines
for congestive heart failure, any evidence of dysphagia, any
evidence of constipation, heart rate, ECG with low voltage,
1st degree atrioventricular block, anterosuperior divisional
block, 3rd degree left bundle branch block (LBBB), pathologic
Q wave, altered repolarization, right bundle branch block, atrial ibrillation, any kind of extrasystole, and any evidence of heart
failure on radiographs. Internal validation was conducted using
a bootstrap procedure. This procedure estimates the model optimism for later penalization, and it provides bias-corrected
indices. Non-parametric area under the receiver operating
the range of estimated risks. An inconclusive range of predicted risks was deined as the range for which both the sensitivity and speciicity were below 0.95. Net beneit decision curves were also plotted (data not shown) to estimate the number of true positives
gained from using the model, compared to results without using a
model, in the range of risk thresholds(19). This analysis allows the identiication of a range of thresholds, which when used result in
a model that is superior in correctly classifying patients compared to treat-all and treat-none strategies. Calibration was tested using several statistics, including the calibration belt(20). A nomogram and an online calculator were constructed to estimate the
probability of having chronic Chagas disease. R-project software (R Foundation for Statistical Computing, Vienna, Austria)(21) (with packages epicalc, rms, givitiR and shiny) was used.
RESULTS
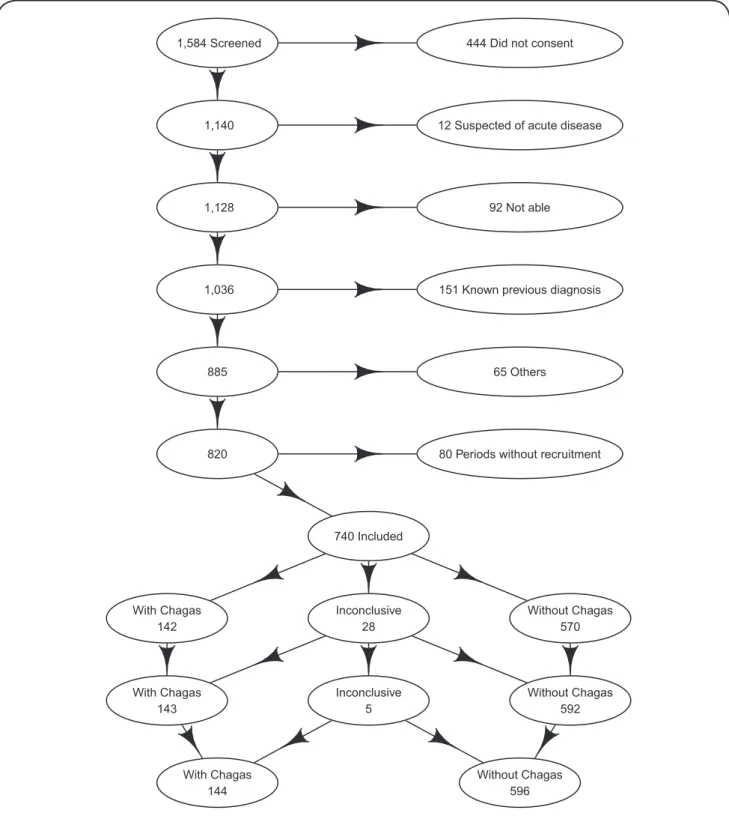
Most of the patients who were not included after screening did not consent or were aware of a previous Chagas disease
diagnosis (Figure 1). In the end, 740 patients (602 in the development cohort and 138 in the validation cohort) were included in the analysis. The prevalences of patients with initial inconclusive results were 4.5% in the development cohort and 0.7% in the validation cohort. All initially inconclusive diagnoses were either classiied as with Chagas or without Chagas after conducting serological tests in a third blood sample.
Chagas disease prevalences were 19.9% in the development cohort and 17.4% in the validation cohort. Most patients were from several different Brazilian states, but there was also one
patient from Peru, two from Bolivia, one from Portugal, and
two from the United States of America. Most patients had
sought health care because of physician referrals, while smaller numbers had relatives diagnosed with Chagas disease or were
referred from blood banks. When patients were referred from
other physicians, the most common reason for referral was heart
disease, followed by esophageal disease (Table 1).
There were slightly more women than men, (Table 1) with a mean age of 47.69 years (standard deviation = 15.72 years). All patients were currently living in urban areas, but the majority
reported lived in rural areas and/or in mud houses at least once in
their lifetime, and they recognized the kissing bug from pictures.
Few reported previous blood transfusions, but a relevant number of volunteers reported prior blood donations. Almost one-third of the volunteers reported having a mother with Chagas disease.
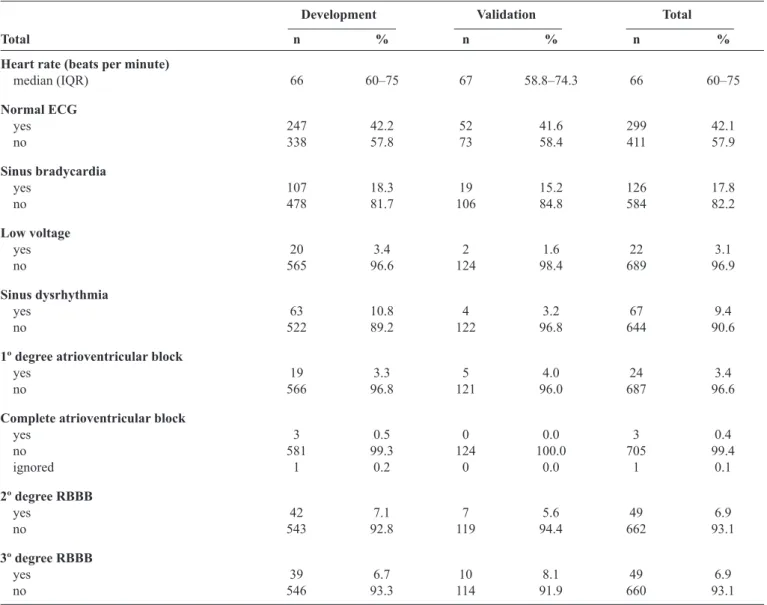
More than half of the ECGs were considered abnormal
(Table 2). The most frequent indings were sinus bradycardia,
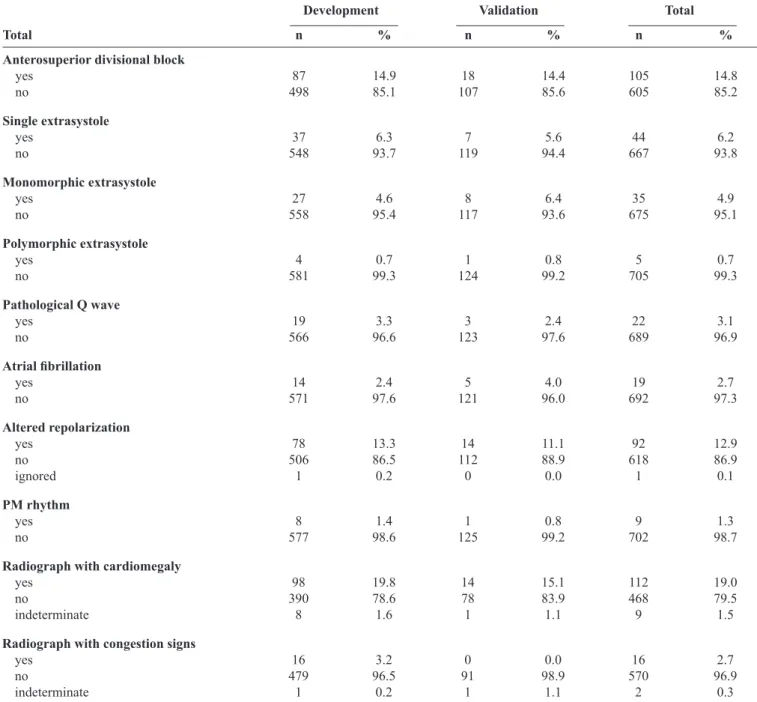
anterosuperior divisional block, right bundle branch block, altered repolarization, extrasystole, and sinus dysrhythmia. Although most ECGs were considered abnormal, the prevalence of individual ECG diagnosis (e.g., pathologic Q wave) was low. Signs of heart disease on radiographs were noted in nearly 20% of volunteers (Table 2).
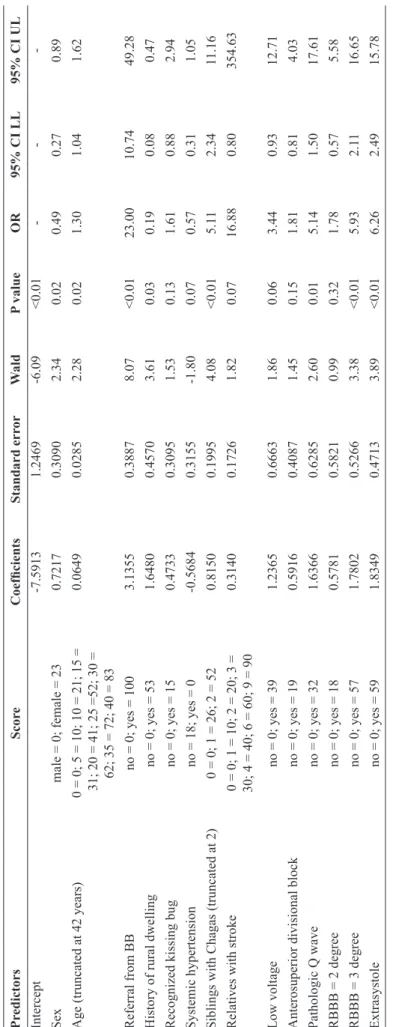
Sex, age, referral from blood bank, history of living in a rural area, recognizing the kissing bug from pictures, systemic
hypertension, number of siblings with Chagas disease, number
of relatives (brothers, sisters, mother, or father) with history of stroke, ECG with low voltage, anterosuperior divisional block, pathologic Q wave, right bundle branch block, and any kind of extrasystole remained as predictors after applying the predictor selection strategy in the full model (Table 3). The bootstrap procedure estimated an optimism of 0.0542 for R2, 0.1013 for the
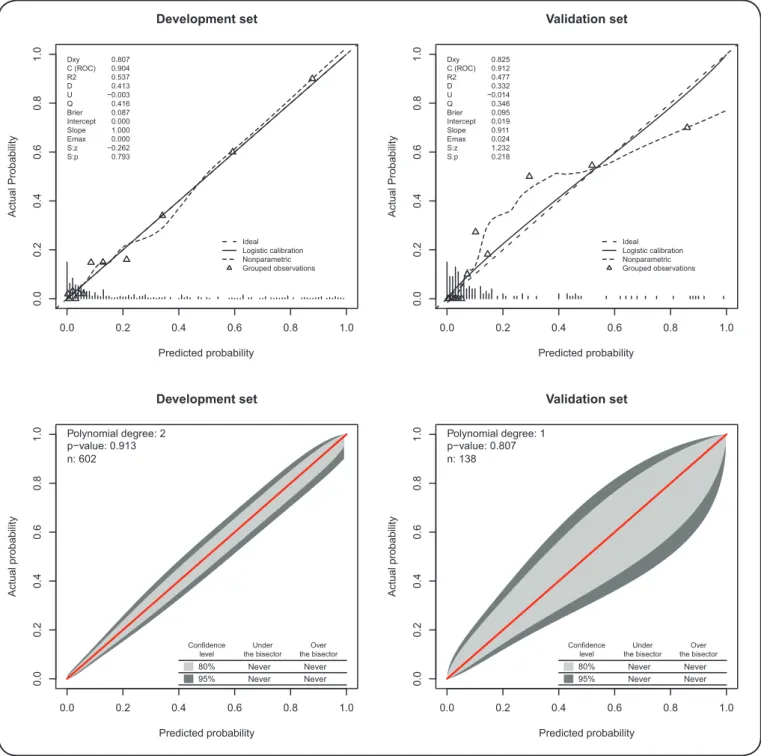
intercept, and 0.1189 for the slope. After penalization, the model resulted areas under the ROC curve (c statistic) of 0.904 and 0.912, R2 values of 0.537 and 0.477, and Brier scores of 0.087
and 0.095 (from a maximum of 0.159), for the development and validation cohorts, respectively. (Figure 2) The calibration plots and their statistics show an excellent relationship between the actual
and predicted values in the development and validation cohorts.
TGROC (data not shown) shows that when the predicted risk was between 43.5% and 100%, the model had at least a 95% probability of correctly identifying those without Chagas disease (speciicity). When the predicted risk was between the 0 and 7.7%, it has at least 95% probability of correctly classify those with Chagas disease (sensitivity). Although there is
uncertainty in a considerable range of predicted probabilities,
the decision curves (data not shown) show higher net beneit
with use of the model compared to use of individual variables
alone, and the test-all (or treat-all) strategy, even with a decision threshold as low as 2%. This inding indicates clinical utility at
any decision threshold.
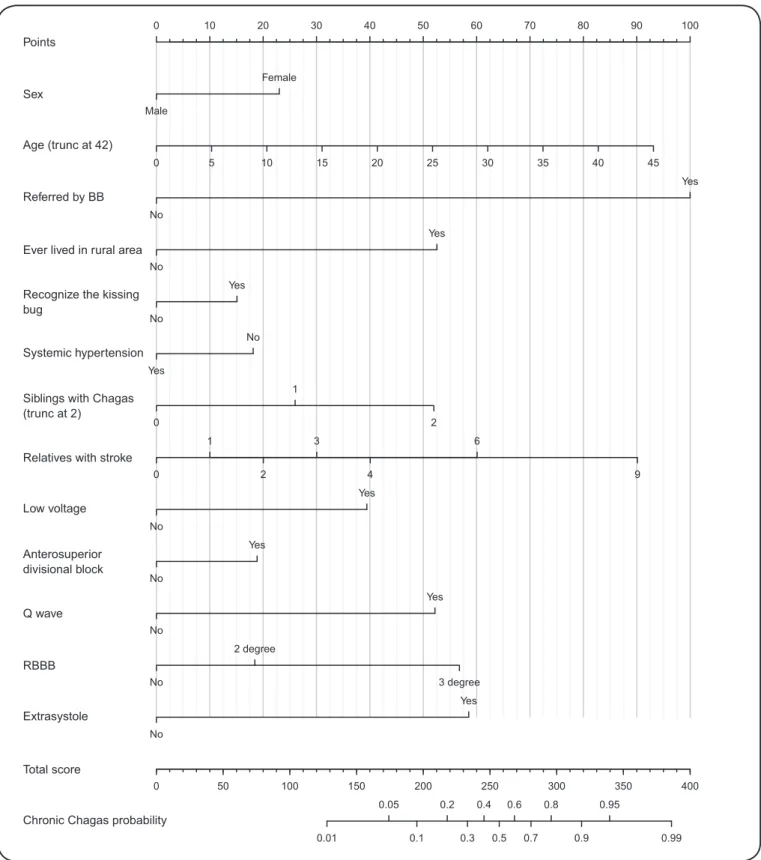
Scores were assigned for each of the predictors (Table 3). To help the reader to determine the risk of a patient having chronic
Chagas disease using this score, a nomogram was provided
(Figure 3). The patient’s individual clinical characteristic scores
must be identiied by drawing a vertical line from the characteristic axis toward the Points upper axis. These individual scores, which are found for each clinical characteristic, must be manually summed, and a vertical line should be drawn from the Total Score
axis toward the Chronic Chagas probability axis. Alternatively, one may access the online calculator at http://shiny.ipec.iocruz.
br:3838/pedrobrasil/chronic_chagas_disease_prediction/.
According to the preset minimum required 95% sensitivity and speciicity of the model, a range of chronic Chagas disease risks between 7% and 43% results in an inconclusive characterization,
and further testing would be recommended. Below or above this range, further testing would not be recommended, as it would not
substantially change the predicted risk.
DISCUSSION
We initially wondered if (a) it is possible to estimate individual risk of Trypanosoma cruzi infection with reasonable
accuracy before serological tests and (b) if there is evidence that
the model is clinically useful when compared to the treat-all
(or test-all) strategy.
When conducting a clinical evaluation of patients suspected
of having chronic Chagas disease, physicians may realize that
signs and symptoms may be misleading, as more than half of the patients have no symptoms or signs(14). In the natural
history of Chagas disease progression, ECG signs of Chagas disease (e.g., complete right branch block) are detectable
444 Did not consent
12 Suspected of acute disease
92 Not able
151 Known previous diagnosis
65 Others
80 Periods without recruitment 1,584 Screened
1 140,
1 128,
1 036,
885
820
740 Included
With Chagas 142
With Chagas 143
With Chagas 144
Without Chagas 570
Without Chagas 592
Without Chagas 596 Inconclusive
28
Inconclusive 5
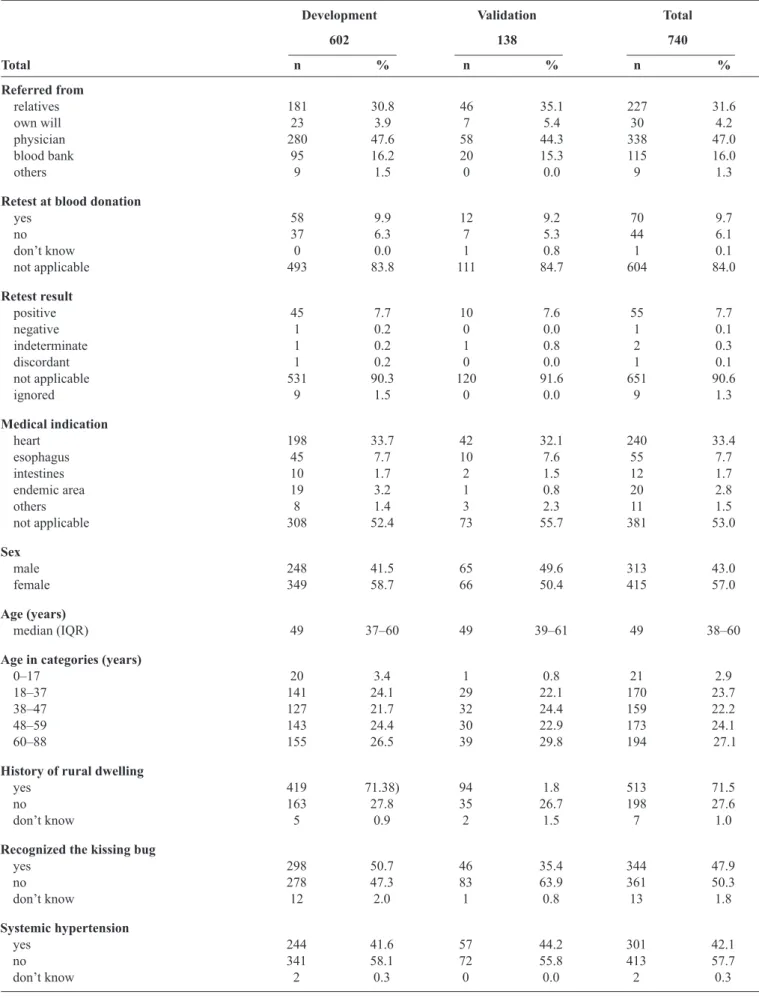
TABLE 1 - Participant epidemiologic and clinical characteristics by cohort.
Development Validation Total
602 138 740
Total n % n % n %
Referred from
relatives 181 30.8 46 35.1 227 31.6
own will 23 3.9 7 5.4 30 4.2
physician 280 47.6 58 44.3 338 47.0 blood bank 95 16.2 20 15.3 115 16.0
others 9 1.5 0 0.0 9 1.3
Retest at blood donation
yes 58 9.9 12 9.2 70 9.7
no 37 6.3 7 5.3 44 6.1
don’t know 0 0.0 1 0.8 1 0.1
not applicable 493 83.8 111 84.7 604 84.0
Retest result
positive 45 7.7 10 7.6 55 7.7
negative 1 0.2 0 0.0 1 0.1
indeterminate 1 0.2 1 0.8 2 0.3
discordant 1 0.2 0 0.0 1 0.1
not applicable 531 90.3 120 91.6 651 90.6
ignored 9 1.5 0 0.0 9 1.3
Medical indication
heart 198 33.7 42 32.1 240 33.4 esophagus 45 7.7 10 7.6 55 7.7 intestines 10 1.7 2 1.5 12 1.7 endemic area 19 3.2 1 0.8 20 2.8
others 8 1.4 3 2.3 11 1.5
not applicable 308 52.4 73 55.7 381 53.0
Sex
male 248 41.5 65 49.6 313 43.0 female 349 58.7 66 50.4 415 57.0
Age (years)
median (IQR) 49 37–60 49 39–61 49 38–60
Age in categories (years)
0–17 20 3.4 1 0.8 21 2.9
18–37 141 24.1 29 22.1 170 23.7 38–47 127 21.7 32 24.4 159 22.2 48–59 143 24.4 30 22.9 173 24.1 60–88 155 26.5 39 29.8 194 27.1
History of rural dwelling
yes 419 71.38) 94 1.8 513 71.5
no 163 27.8 35 26.7 198 27.6
don’t know 5 0.9 2 1.5 7 1.0
Recognized the kissing bug
yes 298 50.7 46 35.4 344 47.9
no 278 47.3 83 63.9 361 50.3
don’t know 12 2.0 1 0.8 13 1.8
Systemic hypertension
yes 244 41.6 57 44.2 301 42.1
no 341 58.1 72 55.8 413 57.7
don’t know 2 0.3 0 0.0 2 0.3
TABLE 1 - Continuation.
Development Validation Total
602 138 740
Total n % n % n %
Siblings with Chagas
0 464 79.2 74 76.3 538 78.8
1 60 10.2 17 17.6 77 11.3
≥2 62 10.6 6 6.2 68 10.0
Relatives with stroke
0 444 75.8 76 78.6 520 76.1
1 109 18.6 14 14.4 123 18.0
2 25 4.3 3 3.1 28 4.1
≥3 8 1.4 4 4.1 12 1.8
Chagas disease diagnosis
without Chagas 482 80.1 114 82.6 596 80.5 with Chagas 120 19.9 24 17.4 144 19.5
TABLE 2 - Participant tests characteristics.
Development Validation Total
Total n % n % n %
Heart rate (beats per minute)
median (IQR) 66 60–75 67 58.8–74.3 66 60–75
Normal ECG
yes 247 42.2 52 41.6 299 42.1
no 338 57.8 73 58.4 411 57.9
Sinus bradycardia
yes 107 18.3 19 15.2 126 17.8
no 478 81.7 106 84.8 584 82.2
Low voltage
yes 20 3.4 2 1.6 22 3.1
no 565 96.6 124 98.4 689 96.9
Sinus dysrhythmia
yes 63 10.8 4 3.2 67 9.4
no 522 89.2 122 96.8 644 90.6
1º degree atrioventricular block
yes 19 3.3 5 4.0 24 3.4
no 566 96.8 121 96.0 687 96.6
Complete atrioventricular block
yes 3 0.5 0 0.0 3 0.4
no 581 99.3 124 100.0 705 99.4
ignored 1 0.2 0 0.0 1 0.1
2º degree RBBB
yes 42 7.1 7 5.6 49 6.9
no 543 92.8 119 94.4 662 93.1
3º degree RBBB
yes 39 6.7 10 8.1 49 6.9
no 546 93.3 114 91.9 660 93.1
Continue...
TABLE 2 - Continuation.
Development Validation Total
Total n % n % n %
Anterosuperior divisional block
yes 87 14.9 18 14.4 105 14.8
no 498 85.1 107 85.6 605 85.2
Single extrasystole
yes 37 6.3 7 5.6 44 6.2
no 548 93.7 119 94.4 667 93.8
Monomorphic extrasystole
yes 27 4.6 8 6.4 35 4.9
no 558 95.4 117 93.6 675 95.1
Polymorphic extrasystole
yes 4 0.7 1 0.8 5 0.7
no 581 99.3 124 99.2 705 99.3
Pathological Q wave
yes 19 3.3 3 2.4 22 3.1
no 566 96.6 123 97.6 689 96.9
Atrial ibrillation
yes 14 2.4 5 4.0 19 2.7
no 571 97.6 121 96.0 692 97.3
Altered repolarization
yes 78 13.3 14 11.1 92 12.9
no 506 86.5 112 88.9 618 86.9
ignored 1 0.2 0 0.0 1 0.1
PM rhythm
yes 8 1.4 1 0.8 9 1.3
no 577 98.6 125 99.2 702 98.7
Radiograph with cardiomegaly
yes 98 19.8 14 15.1 112 19.0
no 390 78.6 78 83.9 468 79.5
indeterminate 8 1.6 1 1.1 9 1.5
Radiograph with congestion signs
yes 16 3.2 0 0.0 16 2.7
no 479 96.5 91 98.9 570 96.9
indeterminate 1 0.2 1 1.1 2 0.3
IQR: interquartile range; ECG: electrocardiogram; PM: pace maker; RBBB: right bundle branch block.
cardiac form of the disease. On the other hand, for the digestive form, symptoms, such as dysphagia and chest pain, are detectable before
signs on complementary tests (e.g. achalasia in images with barium contrasts)(14). Thus, the history of exposure to infection is one of the
main factors in the diagnostic investigation of chronic Chagas disease.
Exposures to T. cruzi may occur through contact with
the kissing bug, blood transfusion, mother-to-child or oral
transmission, or by other less-frequent events, including laboratory accidents and organ transplants. Intuitively,
physicians will try to characterize to the method of infection.
Most patients currently live in urban areas and lived in rural areas only during childhood and adolescence. However, the
mean age at diagnosis is very advanced, and because there may
be a period as long as sixty years between potential exposure
and diagnostic investigation, patient recall concerning events of interest may be limited. For the same reason, it is challenging to patients to recall signs and symptoms potentially related to
the acute phase of Chagas disease, such as Romaña’s signs or
persistent febrile illness with liver enlargement.
Determination of T. cruzi infection among relatives of patients with Chagas disease may suggest that the disease is
commonly spread among households. Variables, such as number
of siblings and having a relative with heart disease, indirectly
TA
BLE 3 - S
cor es , r egr es sion c oe fi ci en ts , s tan dar d e rr or s, W al d’ s te st val ue s, an d od ds r ati os for c hr on ic C hagas d ise as e p re di ctor s i n th e i nal mod el . Pr ed ic tor s Sc or e C oe fi ci en ts Stan dar d e rr or W al d P val ue O R 95% C I LL 95% C I U L Int erc ept -7.5913 1.2469 -6.09 <0.01 - - -Se x m al
e = 0;
fe
m
al
e = 23
0.7217 0.3090 2.34 0.02 0.49 0.27 0.89 A ge (t runc at ed a
t 42 ye
ars
)
0 = 0;
5 = 10;
10 = 21;
15 = 0.0649 0.0285 2.28 0.02 1.30 1.04 1.62 31;
20 = 41;
25 =52;
30 =
62;
35 = 72;
40 = 83
Re
fe
rra
l from
BB
no = 0;
ye
s = 100
3.1355 0.3887 8.07 <0.01 23.00 10.74 49.28 H ist
ory of rura
l dw
el
ling
no = 0;
ye
s = 53
1.6480 0.4570 3.61 0.03 0.19 0.08 0.47 Re cogni ze d ki ss ing bug
no = 0;
ye
s = 15
0.4733 0.3095 1.53 0.13 1.61 0.88 2.94 Sys te m ic hype rte ns ion
no = 18;
ye
s = 0
-0.5684 0.3155 -1.80 0.07 0.57 0.31 1.05 Si bl ings w ith Cha ga s (t runc at ed a t 2)
0 = 0;
1 = 26;
2 = 52
0.8150 0.1995 4.08 <0.01 5.1 1 2.34 11.16 Re la tive s w ith s troke
0 = 0;
1 = 10;
2 = 20;
3 = 0.3140 0.1726 1.82 0.07 16.88 0.80 354.63 30;
4 = 40;
6 = 60;
9 = 90
Low
vol
ta
ge
no = 0;
ye
s = 39
1.2365 0.6663 1.86 0.06 3.44 0.93 12.71 A nt eros upe rior di vi siona l bl oc k
no = 0;
ye
s = 19
0.5916 0.4087 1.45 0.15 1.81 0.81 4.03 Pa thol ogi c Q w ave
no = 0;
ye
s = 32
1.6366 0.6285 2.60 0.01 5.14 1.50 17.61
RBBB = 2 de
gre
e
no = 0;
ye
s = 18
0.5781 0.5821 0.99 0.32 1.78 0.57 5.58
RBBB = 3 de
gre
e
no = 0;
ye
s = 57
1.7802 0.5266 3.38 <0.01 5.93 2.1 1 16.65 Ext ra sys tol e
no = 0;
ye
s = 59
1.8349 0.4713 3.89 <0.01 6.26 2.49 15.78 O R : odds ra ti o ; C I LL: c oni de nc e i nt erva l l ow er l im it; C I U L : c oni de nc e i nt erva l uppe r l im it; BB: bl ood ba nk; R BBB : ri ght bundl e bra nc h bl oc k.
the relatives were never investigated, because of either
personal desires or excessive distance from a health facility. Even when patients deinitively state that their siblings do not have Chagas disease, it is likely that
they have never been tested.
There are also some dificulties involving use of ECG abnormalities to diagnose disease. There is no
general consensus on which abnormalities could be
attributable to Chagas disease. This is particularly true
for those abnormalities that are loosely correlated to poor prognosis of chronic Chagas heart disease, such as sinus bradycardia and sinus dysrhythmia, for which
guidelines are not explicit and compatible(2) (6).
Past studies investigated the use of several potential determinants of Chagas disease, such as
recognizing the kissing bug or reporting living in places with kissing bugs(22) (23) (24) (25) (26) (27), previous knowledge of the vector(28) (29), reporting being bitten by the kissing bug(24), reporting living in mud houses
or in rural areas(22) (23) (28) (29) (30) (31), Latin America as a place of birth or destination of previous travel(22) (32), reporting receiving blood transfusions in the past(27) (33), reporting blood donations in the past(26) (30), education(22) (28) (30) (33), social condition or income(22) (30), reporting siblings or relatives with Chagas disease(23) (26) (27), sex(26) (31), and age(26) (28) (30) (31) (33). However, they were all investigated
under different conditions (blood bank screening,
vertical transmission screening, and in rural area
inhabitants) for different purposes, resulting in substantially different results from this research. This
investigation is considerably different from those cited investigations due to the setting, purpose, and the techniques commonly recommended for developing and validating clinical prediction models(34).
Serological testing for Chagas disease is relatively
simple and inexpensive. However, the prediction
tool is intended for non-specialists and health care
providers who are less experienced with Chagas
disease, for settings where this condition is not frequent, or for settings where laboratory testing is not easily accessible and screening may be advisable.
External validation and its impact on patient care will
provide further support of its clinical utility. Such
evaluations are desirable as a part of decision-making
in clinical practice and increase the strength of the evidence provided here.
Many will agree intuitively that as more information
is required, there is more dificulty in using a model in
clinical practice. However, the reduction of the number of predictors also progressively reduced the overall
accuracy, the calibration quality, and the net beneit
across a range of decision thresholds. In addition, although some patients sought diagnostic investigation due to gastrointestinal signs or symptoms, it was not possible as part of this research study to conduct
FIGURE 2 -Calibration plot and validation statistics for the development and validation cohorts. Dxy: Somers's D{xy} rank correlation between predicted and observed outcomes; C (ROC): area under the ROC curve; R2: Nagelkerke-Cox-Snell-Maddala-Magee R-squared index; D: discrimination index D; U: unreliability index U; Q: quality index Q; Brier: Brier score (average squared difference in predicted and observed outcomes); Intercept: calibration curve
intercept; Slope: calibration curve slope; Emax: maximum absolute difference in predicted and calibrated probabilities; S: the Spiegelhalter Z-test for calibration accuracy and its two-tailed p-value; p-value: value for the GiViTI calibration test related to the calibration belt. Triangles in the development cohort are groups of 50 ordered predicted values, and in the validation cohort, triangles are groups of 10 ordered predicted values.
0.0 0.2 0.4 0.6 0.8 1.0
0.
0
0.2
0.4
0
.6
0.8
1.
0
Predicted probability
Actual Probabilit
y
Ideal Logistic calibration Nonparametric Grouped observations Dxy
C (ROC) R2 D U Q Brier Intercept Slope Emax S:z S:p
0.807 0.904 0.537 0.413 −0.003 0.416 0.087 0.000 1.000 0.000 −0.262 0.793
Development set
0.0 0.2 0.4 0.6 0.8 1.0
0.0
0
.2
0.4
0.6
0.8
1.
0
Predicted probability
Actual Probabilit
y
Ideal Logistic calibration Nonparametric Grouped observations Dxy
C (ROC) R2 D U Q Brier Intercept Slope Emax S:z S:p
0.825 0.912 0.477 0.332 −0.014 0.346 0.095 0.019 0.911 0.024 1.232 0.218
Validation set
Development set
Predicted probability
Actual probabilit
y
0.0 0.2 0.4 0.6 0.8 1.0
0.
0
0.
2
0.4
0.6
0.8
1.0 Polynomial degree: 2
p−value: 0.913 n: 602
95% Never Never
80% Never Never
Confidence level
Under the bisector
Over the bisector
Validation set
Predicted probability
Actual probabilit
y
0.0 0.2 0.4 0.6 0.8 1.0
0.
0
0.
2
0.4
0.
6
0.
8
1.
0 Polynomial degree: 1
p−value: 0.807 n: 138
95% Never Never
80% Never Never
Confidence level
Under the bisector
FIGURE 3- Nomogram derived from a logistic model of estimation of chronic Chagas disease risk.Note: To use the nomogram one must ind the corresponding points for each patient’s individual characteristics by drawing a vertical line from the characteristic to the upper points axis. After doing so for every characteristic, one must sum the points and draw a vertical from the total score axis toward the chronic Chagas probability axis to ind the patient’s risk of having chronic Chagas disease. BB: blood bank; RBBB: right bundle branch block.
Points
0 10 20 30 40 50 60 70 80 90 100
Sex
Male
Female
Age (trunc at 42)
0 5 10 15 20 25 30 35 40 45
Referred by BB
No
Yes
Ever lived in rural area
No
Yes
Recognize the kissing bug
No
Yes
Systemic hypertension
Yes
No
Siblings with Chagas (trunc at 2)
0 2
1
Relatives with stroke
0 2 4 9
1 3 6
Low voltage
No
Yes
Anterosuperior divisional block
No
Yes
Q wave
No
Yes
RBBB
No 3 degree
2 degree
Extrasystole
No
Yes
Total score
0 50 100 150 200 250 300 350 400
Chronic Chagas probability
0.01
0.05
0.1 0.2
0.3 0.4
0.5 0.6
0.7 0.8
0.9 0.95
involvement. Therefore, this model may be less accurate for patients with gastrointestinal involvement exclusively.
Despite its limitations, the evidence supports using this tool
in decision-making. It is intended to be used to screen patients
suspected of chronic Chagas disease with an evidence-based
rationale by healthcare providers with less experience with
this condition or in settings where further laboratory tests are
not easily accessible. Further external validation studies with
a fully independent sample and data impact studies on the improvement of patient care will improve this model and/or to support its clinical utility and widespread use. Such evaluations
are recommended in order for the decision-making tools to
become widely adopted in clinical practice(35).
In conclusions, the results presented here show that a combination of variables within a clinical evaluation, including
ECG indings, allow clinicians to accurately estimate chronic Chagas disease risk, either indirectly through summing scores or
directly through the online calculator, before serological testing.
Acknowledgements
We would like to thank Valdilea Veloso, Evandro Chagas National Institute of Infectious DIseases’director, for logistical support of this research. We would also like to thank Carla Renata Ferreira dos Santos and Daniel Tavares Almeida de Paiva for technical assistance and Dr. Daria Kiselica for English review. Questionnaires
and pictures used at clinical evaluation may be provided upon request.
Conlict of Interest
There are no conlicts of interest to declare.
REFERENCES
1. Moncayo A, Silveira AC. Current epidemiological trends for
Chagas disease in Latin America and future challenges in epidemiology, surveillance and health policy. Mem Inst Oswaldo
Cruz 2009; 104 (supl 1):17-30.
2. Andrade JP, Marin Neto JA, Paola AA, Vilas-Boas F, Oliveira
GM, Bacal F, et al. I Latin American Guidelines for the diagnosis and treatment of Chagas’ heart disease. Arq Bras Cardiol 2011; 97 (supl 3):1-48.
3. Tanowitz HB, Weiss LM, Montgomery SP. Chagas disease Has
Now Gone Global. PLoS Negl Trop Dis 2011; 5:e1136.
4. Savioli L, Daumerie D. First WHO report on neglected tropical
diseases 2010: working to overcome the global impact of neglected tropical diseases. World Health Organization; 2008.
5. Lee BY, Bacon KM, Bottazzi ME, Hotez PJ. Global economic
burden of Chagas disease: a computational simulation model.
Lancet Infect Dis 2013; 13:342-348.
6. Secretaria de Vigilância em Saúde, Ministério da Saúde. Consenso
Brasileiro em Doença de Chagas. Rev Soc Bras Med Trop 2005; 38 (supl 3):7-29.
7. Bern C, Montgomery SP, Herwaldt BL, Rassi A, Marin-Neto JA,
Dantas RO, et al. Evaluation and treatment of Chagas disease in
the United States: a systematic review. JAMA 2007; 298:2171-2181. 8. Ministério de la Salud Publica y Assitencia Social. El Salvador.
Norma Técnica de Prevención y Control de la Enfermedad de Chagas. San Salvador; 2007.
9. Comité de Parasitología. Guías clinicas de la enfermedad de Chagas. 2006. Parte V. Diagnóstico de laboratorio. Rev Chil Infectol 2008; 25:379-383.
10. Albajar P, Aparicio P, Canavate C, Castro E, Coll O, Coura JR, et al. Diagnosis and treatment of imported Chagas disease. Med Clin
(Barc) 2005; 6:230-235.
11. Pérez-Molina J, Rodríguez-Guardado A, Soriano A, Pinazo
M-J, Carrilero B, García-Rodríguez M, et al. Guidelines on the
treatment of chronic coinfection by Trypanosoma cruzi and HIV
outside endemic areas. HIV Clin Trials 2011; 12:287-298.
12. Organización Panamericana de la Salud. OPS/MSF Regional
Consultation Technique on Organization and Structure of the
Medical Attention of patient with Chagas disease. Rev Soc Bras
Med Trop 2005; 38:538-541.
13. Ministerio del Poder Popular para la Salud. Guía para
el Diagnóstico, Atención y Manejo Clínico de la Enfermedad de Chagas en Venezuela. Maracay, Estado Aragua, Venezuela; 2014.
14. Prata A. Clinical and epidemiological aspects of Chagas disease.
Lancet Infect Dis 2001; 1:92-100.
15. Ribeiro ALP, Rocha MOC. Forma indeterminada da doença de
Chagas: considerações acerca do diagnóstico e do prognóstico.
Rev Soc Bras Med Trop 1998; 31:301-314.
16. Haynes RB, You JJ. The architecture of diagnostic research. In:
Knottnerus JA, Buntinx F, editors. The Evidence Based of Clinical Diagnosis - Theory and methods of diagnostic research, vol. 2. BMJ Books; 2009.
17. van Buuren S, Groothuis-Oudshoorn K. Mice: Multivariate Imputation by Chained Equations in R. J Stat Soft 2011; 45:1-67. 18. Greiner M, Sohr D, Göbel P. A modiied ROC analysis for the
selection of cut-off values and the deinition of intermediate results of serodiagnostic tests. J Immunol Methods 1995; 185:123-132. 19. Vickers A, Cronin A, Elkin E, Gonen M. Extensions to decision
curve analysis, a novel method for evaluating diagnostic tests,
prediction models and molecular markers. BMC Med Inform Decis Mak 2008; 8:533.
20. Nattino G, Finazzi S, Bertolini G. A new calibration test and a reappraisal of the calibration belt for the assessment of prediction
models based on dichotomous outcomes. Statist Med 2014; 33:2390-2407.
21. R Development Core Team. R: a language and environment for
statistical computing. Vienna, Austria: the R Foundation for Statistical Computing; 2011. Available online at
http://www.R-project.org/.
22. Leiby DA, Read EJ, Lenes BA, Yund AJ, Stumpf RJ, Kirchhoff
LV, et al. Seroepidemiology of Trypanosoma cruzi, etiologic
agent of Chagas’ disease, in US blood donors. J Infect Dis 1997; 176:1047-1052.
23. Furuchó CR, Umezawa ES, Almeida I, Freitas VL, Bezerra R,
Nunes EV, et al. Inconclusive results in conventional serological screening for Chagas’ disease in blood banks: evaluation of cellular and humoral response. Trop Med Int Health 2008; 13:1527-1533.
24. Vinelli E, Aguilar M, Pavón L, Enamorado N. El interrogatorio
como instrumento para la exclusión de donantes de sangre con
riesgo para la transmisión del Trypanosoma cruzi. Rev Med
Hondur 1995; 63:96-99.
26. Pereira GA, Louzada-Neto F, Barbosa VF, Ferreira-Silva MM,
de Moraes-Souza H. Performance of six diagnostic tests to screen for Chagas disease in blood banks andprevalence of Trypanosoma cruzi infection among donors with inconclusive serologys creening based on the analysis of epidemiological variables. Rev Bras
Hematol Hemoter 2012; 34:292-297.
27. Salles NA, Sabino EC, Cliquet MG, Eluf-Neto J, Mayer A, Almeida-Neto C, et al. Risk of exposure to Chagas’ disease among seroreactive Brazilian blood donors. Transfusion 1996; 36: 969-973.
28. Cucunubá ZM, Flórez AC, Cárdenas A, Pavía P, Montilla M, Aldana R, et al. Prevalence and risk factors for Chagas disease in pregnant women in Casanare, Colombia. Am J Trop Med Hyg 2012; 87:837-842.
29. Avila Arzanegui O, Liendo Arenaza P, Martinez Indart L, Martinez Astorkiza T, Pocheville Guruceta MI, Egurbide Arberas MV. Prevalence of Trypanosoma cruzi infection and vertical transmission in Latin-American pregnant women in a health area
of Biscay. Enferm Infecc Microbiol Clin 2013; 31:210-216.
30. Martelli CMT, Andrade ALSS, Silva SA, Zicker F. Risk factors for Trypanosoma cruzi infection among blood donors in Central
Brazil. Mem Inst Oswaldo Cruz 1992; 87:339-343.
31. Pirard M, Iihoshi N, Boelaert M, Basanta P, Lopez F, Van der
Stuyft P. The validity of serologic tests for Trypanosoma cruzi and the effectiveness of transfusional screening strategies in a
hyperendemic region. Transfusion 2005; 45:554.
32. Custer B, Agapova M, Bruhn R, Cusick R, Kamel H, Tomasulo P,
et al. Epidemiologic and laboratory indings from 3 years of testing United States blood donors for Trypanosoma cruzi. Transfusion
2012; 52:1901-1911.
33. Boggio G. Modelo de regresión logística aplicado a un estudio
sobre enfermedad de Chagas. Cad Saude Publica 1997; 13:389-396.
34. Steyerberg EW. Clinical Prediction Models: A Practical Approach to
Development, Validation, and Updating. 1st edition. Springer; 2008.
35. Guyatt G, Rennie D, Meade M, Cook D. Users’ Guides to the