ISSN 0104-6632 Printed in Brazil
www.abeq.org.br/bjche
Vol. 26, No. 02, pp. 275 - 285, April - June, 2009
Brazilian Journal
of Chemical
Engineering
ADSORPTION OF ACID BLUE 1 ON ACTIVATED
CARBON PRODUCED FROM THE WOOD OF
Ailanthus altissima
F. K. Bangash
1*and S. Alam
21
Institute of Chemical Sciences, University of Peshawar, Phone/Fax: +(92) (91) 9216652, Peshawar, 21250, Pakistan.
E-mail: [email protected]
2
Department of Chemistry, University of Malakand, at Chakdara, Dir (L), NWFP, Pakistan.
E-mail: [email protected]
(Submitted: November 6, 2006 ; Revised: January, 8 2009 ; Accepted: January 9, 2009)
Abstract - Carbon prepared from the wood of Ailanthus altissima, at 400 and 800oC was used to adsorb acid blue 1 from aqueous solution at 10oC and 45oC. Characterization by XRD, SEM, EDS and FTIR shows that the surfaces contain functional groups like carboxyl which disappear at 800 0C and thus favor the exposure of more porous structural surfaces which enhance the adsorption capacity. Relatively high amounts of carbon with respect to oxygen were found with the increase in activation temperature. First order, Bangham and parabolic models were found to fit the adsorption kinetic data. The reaction rate increased with the increase in temperature of adsorption/activation. Thermodynamic parameters like ΔE≠, ΔH≠, ΔS≠ and ΔG≠ were calculated. The negative values of ΔS≠ reflect the decrease in the disorder of the system at the solid-solution interface, during adsorption. Gibbs free energy (ΔG≠) represents the driving force for the affinity of dye for the carbon and it decreased with the increase in adsorption/activation temperature.
Keywords: Activated carbon; Acid blue 1; Adsorption; Characterization.
INTRODUCTION
Color is a visible pollution. A slight coloration of a water source could make it unacceptable to consumers though it may not be toxic. The source of such pollution lies in the rapid increase in the use of synthetic dyes. More than 10,000 chemically different dyes are being manufactured, and the world dyestuff and dye intermediates production is estimated to be around 7 × 10⁸ kg per annum (Vaidya et al., 1982). These are mainly consumed in textiles, tanneries, pharmaceuticals, food packing industries, pulp and paper, paint and electroplating industries. The effluents from dye manufacturing and dye application processes are highly colored. Other contaminants such as acids or alkalis, salts, dissolved and suspended solids and other toxic compounds may also be present in the effluents. Color in the
options (Ramakrishna and Viraraghavan, 1997). The greater adsorption capacity of activated carbon is mainly due to its structural characteristics (porous texture), which give it a large surface area and a chemical nature that can be easily modified to increase their properties.
In the present study, activated carbon from a cheap biotic precursor was prepared, characterized and used for acid blue 1 adsorption with the objective to evaluate its potential for the removal of dye from aqueous solution.
MATERIAL AND METHODS
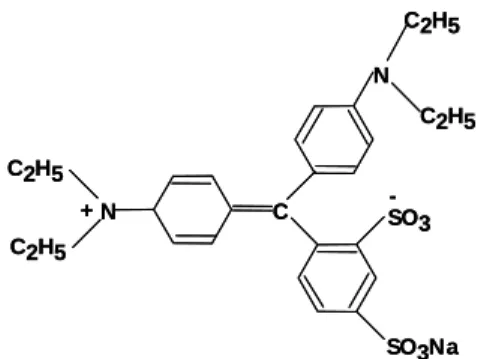
Acid Blue 1
The dye used was supplied by Sigma-Aldrich
(Catalogue No. = 19, 821, dye contents=50%, formula weight = 566.68, λ max. 635nm) and its chemical structure is shown in Figure 1.
N C2H5
C2H5
C
SO3Na -SO3 N
C2H5
C2H5
+ N C2H5
C2H5
C
SO3Na -SO3 N
C2H5
C2H5
+
Figure 1: Chemical Structure of Acid blue 1
Carbon Preparation
The wood of Ailanthus altissima was air dried and then heated continuously for 5 hours on a flame burner in an iron container with a small outlet for the emission of volatile matter. Carbon obtained was allowed to cool in the container and then ground with the help of pestle and mortar and screened with US standards mesh 150-180 μm. It was then treated with a 0.5 M aqueous solution of KOH for 24 hours with occasional stirring. The mixture was then filtered and washed with double distilled water for the complete removal of basicity. The carbon was then leached with a 0.2N solution of HNO3: HCl (1:1) and allowed to stand for 24 hours at room temperature with regular mixing. It was then filtered and washed with double distilled water until free from Cl- and NO3- ions. The carbon thus obtained was then air-dried in an oven at 105 ± 1oC. This treated carbon was then extracted with n-hexane for two hours in a soxhlet extractor and allowed to dry
for 8 hours in a vacuum oven. The sample was then degassed by placing in silica (SiO2) tubes, and heated at 400 and 800oC in a tube furnace (FS. 215 Gallenkamp England) with a vacuum facility. The carbon sample prepared was allowed to cool in a dessicator and then stored under nitrogen atmosphere.
Characterization
pH of the carbon sample suspension in CO2 free water (1:50) was determined by pH meter. The moisture content was measured by the weight loss of the sample on heating for two hours at 105 ± 1oC in an air dried oven. Ash content was obtained by ignition at 600oC in a Muffle furnace with the door partially open to provide a stream of air until the sample has been completely burned. The bulk density of the sample was also measured (Snell and Hilton, 1967).
BET-N2 adsorption experiments were carried out manometrically at -196oC using the NOVA 2200 Quantachrome instrument. Surface area was obtained by applying the standard BET equation to the N2 adsorption data in the relative pressure range (P/Po) 0.05 to 0.990. The values of 0.81 g.cm-3 and 16.2 × 10⁻²⁰ m2 were used for the density of liquid nitrogen at -196oC and the molecular area of adsorbate nitrogen, respectively. The pore size distribution was determined by the DR method using NovaWin2 data analysis software of the instrument.
X-rays diffraction (XRD) analysis of the sample was done with an X-ray diffractometer (RAD-1A, Rigaku Tokyo) using Cu Kα radiation generated at 35 KV, 20 mA. The rectangular cavity of an aluminum sample holder was filled with the sample and scanned in a step-scan mode (0.05o / step) over the angular range of 7 - 30o (2θ).
FTIR spectral analysis of the KBr (Spectrosol BDH) mixed pellet of the sample was carried out with a FTIR spectrometer (Shimadzu 8201PC with FTCOM-1 computer control disc unit).
SEM (Model-JSM-5910, Japan JEOL) with EDS (INCA 200 Oxford Instruments) was used for the surface morphology and elemental analysis.
Adsorption Kinetics
RESULTS AND DISCUSSION
Characterization
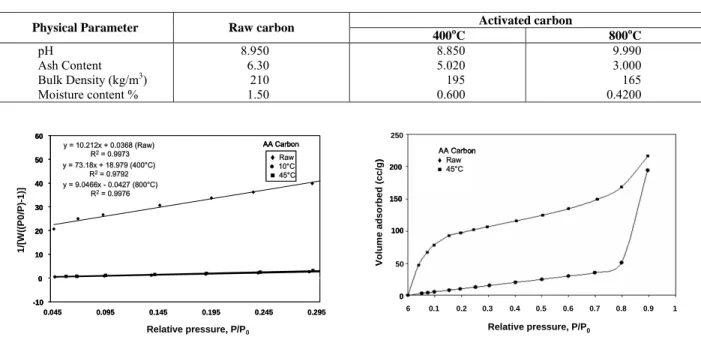
pH, ash contents and bulk density and moisture contents was determined in the raw carbon and activated carbon (400°C and 800°C) and the values are given in Table 1.
BET, the most widely used method for the surface area (m2.g-1) measurements, make uses of the equation (Brunauer et al., 1938):
m m
1 1 C 1 P
W C W C P
P W 1 p ⎛ ⎞ − = + ⎜ ⎟ ⎛ − ⎞ ⎝ ⎠ ⎜ ⎟ ⎝ ⎠ D D (1)
where W is the weight of gas adsorbed at a relative pressure P/Po and Wm is the weight of adsorbate
constituting a monolayer coverage. The term C is the BET constant, and its value gives the energy of adsorption in the first adsorbed layer, indicating the magnitude of the adsorbent-adsorbate interactions. The Wm can be obtained from the slope and intercept
of the BET plot. From equation (1):
m
C 1 S
W C
−
= (1a)
m
1 i
W C
= (1b)
Thus, the weight of a monolayer (Wm) can be obtained by combining equations (1a) and (1b).
m
1 W
S i
=
+ (1c)
The total surface area (St) of the sample can be
expressed as: m CS t W NA S M
= (1d)
Where N is Avogadro’s number (6.023 × 10²³) and
M is the molecular weight of the adsorbate and ACS is
the cross sectional area of nitrogen gas (16.2 Å2/mol). The BET surface area of the samples were obtained from the plots of 1/[W(Po/P)-1] vs. P/Po of the N2 adsorption (Figure 2), which show that the Raw carbon, 400oC and 800oC activated carbon samples have values of 74.153, 337.16 and 387.28 m2 g-1 respectively. Type-I isotherms were obtained (Figure 3). Such types of isotherms are concave to the P/Po axis and N2 uptake is governed by accessible micropore volume rather than the internal surface area. Such a behavior indicates the presence of mainly microporous structures. The pore volumes of the Raw carbon, 400oC and 800oC activated carbon were 0.020, 0.110 and 0.120 cm3.g-1, respectively. The increase in surface area and pore volume with increase in activation temperature is due to the driving off of the tar in gaseous form that was trapped in the porous structure (Hassler 1974).
Table 1: Physical parameters of carbon.
Activated carbon Physical Parameter Raw carbon
400oC 800oC
pH 8.950 8.850 9.990
Ash Content 6.30 5.020 3.000
Bulk Density(kg/m3) 210 195 165
Moisture content % 1.50 0.600 0.4200
y = 73.18x + 18.979 (400°C) R2= 0.9792
y = 10.212x + 0.0368 (Raw) R2= 0.9973
y = 9.0466x - 0.0427 (800°C) R2= 0.9976
-10 0 10 20 30 40 50 60
0.045 0.095 0.145 0.195 0.245 0.295
1 /[W ((P 0 /P )-1 )]
Relative pressure, P/P0
AA Carbon
Raw
z10°C
45°C y = 73.18x + 18.979 (400°C)
R2= 0.9792
y = 10.212x + 0.0368 (Raw) R2= 0.9973
y = 9.0466x - 0.0427 (800°C) R2= 0.9976
-10 0 10 20 30 40 50 60 -10 0 10 20 30 40 50 60
0.045 0.095 0.145 0.195 0.245 0.295
1 /[W ((P 0 /P )-1 )]
Relative pressure, P/P0
AA Carbon Raw z10°C 45°C AA Carbon Raw z10°C 45°C
6 0.1 0.2 0.3 0.4 0.5 0.6 0.7 0.8 0.9 1
Relative pressure, P/P0
Volum e adso rbed (cc/g ) 150 200 250 50 100 0 Raw 45°C AA Carbon
6 0.1 0.2 0.3 0.4 0.5 0.6 0.7 0.8 0.9 1
6 0.1 0.2 0.3 0.4 0.5 0.6 0.7 0.8 0.9 1
Relative pressure, P/P0
Volum e adso rbed (cc/g ) 150 200 250 50 100 0 150 200 250 50 100 0 Raw 45°C AA Carbon Raw 45°C AA Carbon
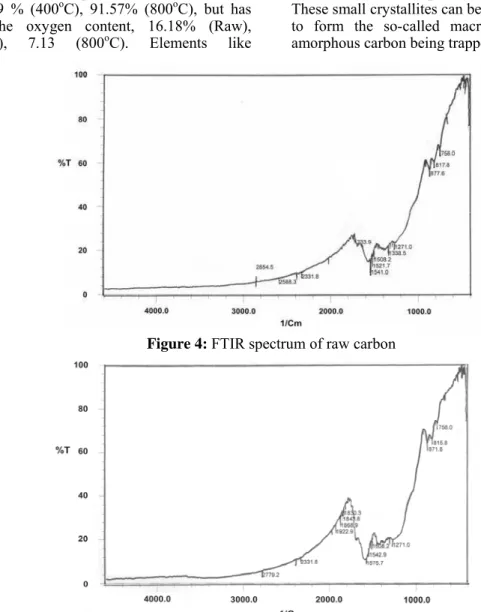
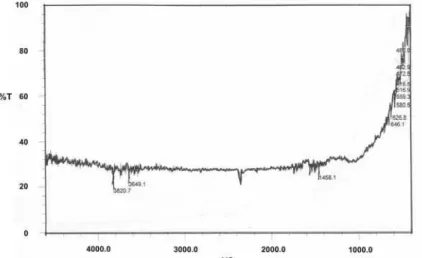
FTIR spectral bands (Figure 4 - 6) in the region of 2779.2 cm-1, 2854.5 cm-1 and 2588.3 cm-1 are present only in the Raw and 400oC samples but are absent in the 800oC sample. The bands are ascribed to aliphatic -CH3, -CH2 and -CH stretching. The peak at 2300 cm-1 is due to the presence of ketones (Cooke et al., 1986). A weak absorption band in Raw and 400oC at 1719 cm-1 represents C = O stretching, indicating the presence of various oxygen groups such as carboxyls (Bhabendra et al., 1999). The bands in the region 1000 - 1100 cm-1 confirm the presence of mineral matter (Ahmadet al., 2004), and between 900-700 cm-1 are aromatic bands for substituted benzene rings (Cooke et al., 1986).
Scanning electron micrographs of the carbon samples (Figure 7) have hexagonal pores. The EDS, which gives semi quantitative analysis, shows that, with the increase in activation temperature, the carbon content of the samples has increased, 83.48% (Raw), 86.89 % (400oC), 91.57% (800oC), but has decreased the oxygen content, 16.18% (Raw), 12.21(400oC), 7.13 (800oC). Elements like
magnesium, potassium, calcium, chlorine, iron and copper were found in trace quantities.
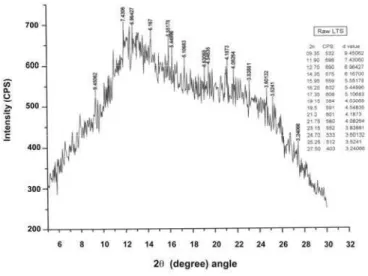
The X-ray diffraction patterns (Figure 8 - 10) of carbon samples have a peak corresponding to 2θ ≈ 22o which shows the disordered graphitic 002 planes (Bhabendra et al., 1999). The Raw carbon showed the presence of a phase like molybdenum sulfide chloride-Mo(S2)3SCl4[file number 74-2043], that of 400oC had the phase of chromium carbonyl cobalt tungsten phosphide-(CO)5Cr(CO)5WP2CO2(CO)6 [file number 77-2229] and the 800oC degassed carbon showed the phase of 2, 4-dinitromesitylene-C9H10N2O4 [file number 13-0780]. It has been reported (Lu et al., 2001) that activated carbon has an intermediate structure between graphite and amorphous state, the so-called turbostratic structure or random layer lattice structure. Unlike graphite, carbonaceous material crystallite is extremely small and contains some aliphatic side chains on its edges. These small crystallites can be linked via their chains to form the so-called macromolecules, with the amorphous carbon being trapped in it.
Figure 4: FTIR spectrum of raw carbon
Figure 6: FTIR spectrum of 800oC activated carbon
a) Raw carbon (Mag. 1000x, —20 µm) b) 400oC activated carbon (Mag. 3500x, —5.7 µm)
c) 400oC activated carbon (Mag. 3500x, —5.7 µm) d) 800oC activated carbon (Mag.1000x,—20µm)
e) 800oC activated carbon (Mag.3500x,—5.7µm)
Figure 8: XRD spectrum of Raw carbon.
Figure9: XRD spectrum of 400oC activated carbon.
Effect of Functional Groups on Adsorption
Acid blue 1 is an anionic triphenylmethane dye carrying a sulfonic acid group. In aqueous solution, it ionizes to an anionic SO-3 group. The dye ion, on approaching to the surface, suffers Columbic repulsion with oxygen-containing functional groups (carboxyls, carbonyl etc.) present on the Raw and 400oC degassed carbon samples (Figures 4, 5). Adsorption of the dye on 800oC activated carbon is high due to the decrease in polarity of the carbon surface and decomposition of some of the acidic oxygen surface functionalities at this temperature. Some increase in adsorption might also have occurred due to an increase in the surface area by activation at high temperature due to opening of the blind pores, resulting in the increase in surface area and pore volume. A non-polar surface of the 800oC activated carbon sample is thus also a reason for the high adsorption of the dye. Lower adsorption of dye on the Raw and 400oC activated carbon samples may be
due to the fact that polar functional groups situated at the pore opening adsorb water strongly through hydrogen bonds that in turn result in pore constriction or pore blockage.
Kinetic Models
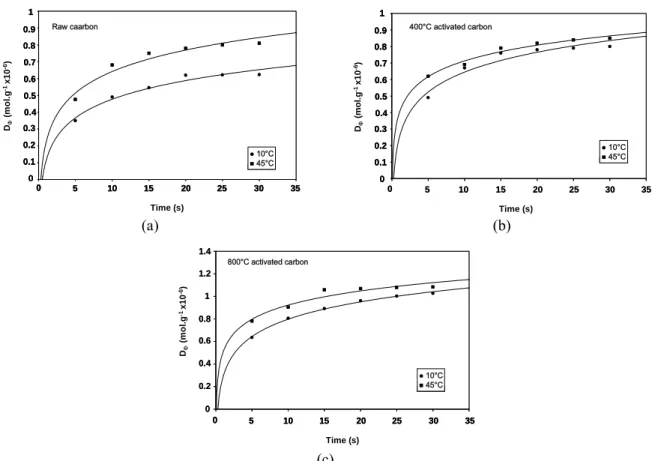
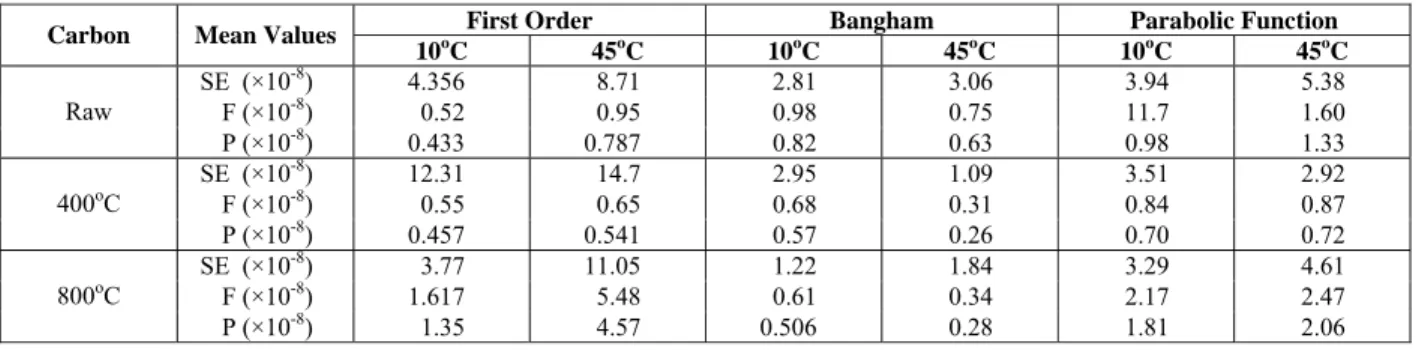
The rate of adsorption of dye (2 ×10⁻⁵ mol. dm-3) at 10oC and 45oC (Figure 11a-c) is high in the initial fifteen seconds and then it becomes slow due to the possible diffusion into the micropores. Linear forms of the kinetic equations were applied to the data and their goodness of fit was estimated from the correlation coefficient (r2), standard error estimate (SE), variance ratio (F) and the level of significance of F statistic (P), (Table 2). Based on these parameters, it appears that the dye adsorption kinetics on the prepared carbon samples can be described reasonably well by the first order, Bangham and the parabolic diffusion models.
Raw carbon 0 0.1 0.2 0.3 0.4 0.5 0.6 0.7 0.8 0.9 1
0 5 10 15 20 25 30 35
Time (s) DΦ (m o l. g -1 x1 0 -6) 0 0.1 0.2 0.3 0.4 0.5 0.6 0.7 0.8 0.9 1
0 5 10 15 20 25 30 35
Time (s) z10°C 45°C Raw caarbon Raw carbon 0 0.1 0.2 0.3 0.4 0.5 0.6 0.7 0.8 0.9 1
0 5 10 15 20 25 30 35
Time (s) DΦ (m o l. g -1 x1 0 -6) 0 0.1 0.2 0.3 0.4 0.5 0.6 0.7 0.8 0.9 1 DΦ (m o l. g -1 x1 0 -6) 0 0.1 0.2 0.3 0.4 0.5 0.6 0.7 0.8 0.9 1 0 0.1 0.2 0.3 0.4 0.5 0.6 0.7 0.8 0.9 1
0 5 10 15 20 25 30 35
Time (s)
0 5 10 15 20 25 30 35
Time (s)
0 5 10 15 20 25 30 35 0 5 10 15 20 25 30 35
Time (s)
z10°C 45°C z10°C 45°C
Raw caarbon 400 o
C activated carbon
0 0.1 0.2 0.3 0.4 0.5 0.6 0.7 0.8 0.9 1
0 5 10 15 20 25 30 35
Time (s)
0 5 10 15 20 25 30 35
Time (s)
z10°C 45°C 400°C activated carbon
DΦ (m o l. g -1 x1 0 -6) 0 0.1 0.2 0.3 0.4 0.5 0.6 0.7 0.8 0.9 1
400 o
C activated carbon
0 0.1 0.2 0.3 0.4 0.5 0.6 0.7 0.8 0.9 1
0 5 10 15 20 25 30 35
Time (s)
0 5 10 15 20 25 30 35
Time (s)
0 5 10 15 20 25 30 35 0 5 10 15 20 25 30 35
Time (s)
z10°C 45°C z10°C 45°C 400°C activated carbon
DΦ (m o l. g -1 x1 0 -6) 0 0.1 0.2 0.3 0.4 0.5 0.6 0.7 0.8 0.9 1 DΦ (m o l. g -1 x1 0 -6) 0 0.1 0.2 0.3 0.4 0.5 0.6 0.7 0.8 0.9 1 0 0.1 0.2 0.3 0.4 0.5 0.6 0.7 0.8 0.9 1 (a) (b)
800 o
C activated carbon
0 0.2 0.4 0.6 0.8 1 1.2 1.4
0 5 10 15 20 25 30 35
Time (s)
800°C activated carbon
0 5 10 15 20 25 30 35
Time (s) z10°C 45°C 0 0.2 0.4 0.6 0.8 1 1.2 1.4 DΦ (m o l.g -1 x1 0 -6)
800 o
C activated carbon
0 0.2 0.4 0.6 0.8 1 1.2 1.4
0 5 10 15 20 25 30 35
Time (s)
800°C activated carbon
0 5 10 15 20 25 30 35
Time (s) z10°C 45°C 0 0.2 0.4 0.6 0.8 1 1.2 1.4 DΦ (m o l.g -1 x1 0 -6)
800°C activated carbon
0 5 10 15 20 25 30 35
Time (s)
0 5 10 15 20 25 30 35
Time (s)
0 5 10 15 20 25 30 35 0 5 10 15 20 25 30 35
Time (s) z10°C 45°C z10°C 45°C 0 0.2 0.4 0.6 0.8 1 1.2 1.4 0 0.2 0.4 0.6 0.8 1 1.2 1.4 DΦ (m o l.g -1 x1 0 -6) (c)
Table 2: Values of SE, F statistics and P for models fitted on kinetics adsorption of acid blue 1 on carbon.
First Order Bangham Parabolic Function Carbon Mean Values
10oC 45oC 10oC 45oC 10oC 45oC
SE (×10-8) 4.356 8.71 2.81 3.06 3.94 5.38
F (×10-8) 0.52 0.95 0.98 0.75 11.7 1.60
Raw
P (×10-8) 0.433 0.787 0.82 0.63 0.98 1.33
SE (×10-8) 12.31 14.7 2.95 1.09 3.51 2.92
F (×10-8) 0.55 0.65 0.68 0.31 0.84 0.87
400oC
P (×10-8) 0.457 0.541 0.57 0.26 0.70 0.72
SE (×10-8) 3.77 11.05 1.22 1.84 3.29 4.61
F (×10-8) 1.617 5.48 0.61 0.34 2.17 2.47
800oC
P (×10-8) 1.35 4.57 0.506 0.28 1.81 2.06
Table 3: Thermodynamic parameters for the adsorption of acid blue 1 on carbon, calculated from the first order adsorption kinetics.
Carbon Samples
Raw 400oC 800oC
Thermodynamic Parameters
10oC 45oC 10oC 45oC 10oC 45oC
ΔH≠ (kJmol-1) -1.567 -1.858 -2.0783 -2.369 -2.091 -2.38
ΔS≠(Jmol-1K-1) -291.2 -290.0 -285.61 -293.14 -287.9 -288.1
ΔG≠(kJmol-1) 80.861 90.362 78.749 90.85 79.38 89.21
k (s-1) 0.0070 0.0095 0.0071 0.0079 0.0131 0.0145
The first order equation in the linear form can be expressed as (Laidler 1965).
σ o
ln D = ln D - k t (2)
Values of the rate constant, k,increased with the increase in both the adsorption and activation temperatures (Table 3). Also the r2 values for the first order model indicate good agreement. The energy of activation for the adsorption was calculated using the Arrhenius equation in the form:
a
2 2 1
1 1 2
E
k T T
ln
k R T T
⎡ − ⎤
= ⎢ ⎥
⎣ ⎦ (3)
Where Ea is the activation energy, k1 and k2 are rate
constants at T1 and T2, R is the gas constant (8.314
J.k-1.mol-1). The energies of activation for the adsorption on the Raw carbon and activated at 400 and 800oC, are 0.78, 0.27 and 0.26 kJ.mol-1, respectively, which shows that, with the increase in activation temperature, the activation energy of adsorption decreases. The high activation energy of adsorption on the Raw carbon and the 400oC degassed samples may be due to the presence of the polar functional groups at the pore opening, blocking the entrance of dye molecules and thus the energy barrier may arise from the repulsion. From the values of activation energies, other thermodynamic parameters such as Gibbs free energy of activation (ΔG)≠, enthalpy of activation (ΔH)≠ and entropy of
activation (ΔS)≠ were calculated (Table 3) by using the following equations (Laidler 1965).
ΔG# = ΔH # - TΔS# (4)
ΔH# = Ea – RT (5)
B
kh H
S 1n
k T RT
R
≠≠ ⎡ Δ ⎤
Δ ⎢ + ⎥
⎢ ⎥
⎣ ⎦
=
(6)Gibbs free energy (ΔG≠) represents the driving force for the affinity of dye for the carbon (Vickerstaff 1954). The negative values of the ΔG≠
indicate spontaneity of the adsorption process. It was also noted that ΔG≠ decreased with the increase in temperature, indicating high adsorption at higher temperatures. The enthalpy of activation (ΔH≠), calculated from the energy of activation, indicates that the process is endothermic in nature and decreased with increase in both the adsorption and the sample activation temperatures. The negative values of entropy of activation ΔS≠ reflect affinity of the dye towards carbon and they also decreased with the increase in both the adsorption and activation temperatures, which indicates that the dye molecules have acquired a more stable orientation on the carbon surface (Table 3).
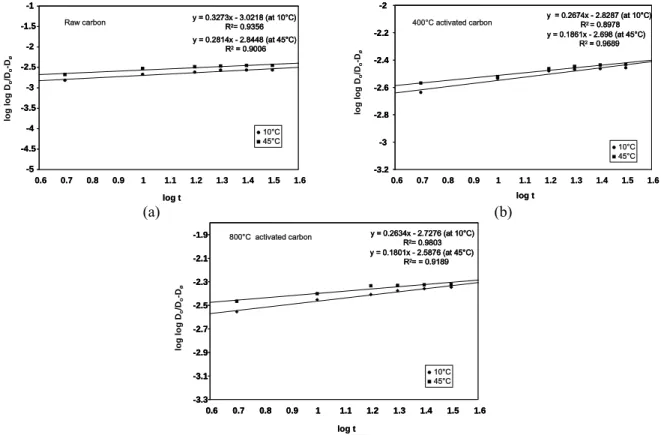
The Bangham equation in the linear form:
σ
D k W
log log log αlog t
D −D W= 2.303 V+
D D
was used to check the pore diffusion during the adsorption process (Aharoni, 1979). Linear plots were obtained (Figure 12a-c), by plotting log(Do/(Do
-DσW)) vs. log t. The values of α and k calculated from the slopes and intercepts are given in Table 4. The decrease in α and increase in k values of adsorption, with both the temperatures of adsorption and the sample activation, indicate the importance of the diffusion of dye into the pores of carbon and that adsorption into the pores is a diffusion controlled process, as was also reported by Qadeer et al., 1995.
The intraparticle diffusion was analyzed by applying the parabolic diffusion equation:
1/2
Dφ = B + kt (8)
to the data. For a solid-liquid adsorption process, the solute transfer is usually characterized by either external mass transfer (boundary layer diffusion) or intraparticle diffusion or both. The adsorption dynamics can be described by three consecutive steps, i.e., transport of the solute from bulk solution through liquid film to the adsorbent exterior surface; solute diffusion into the pores of adsorbent except for a small quantity of adsorption on the external surface; and the intraparticle transport mechanism of surface diffusion and adsorption of solute on the interior surfaces of the pores and capillary spaces of
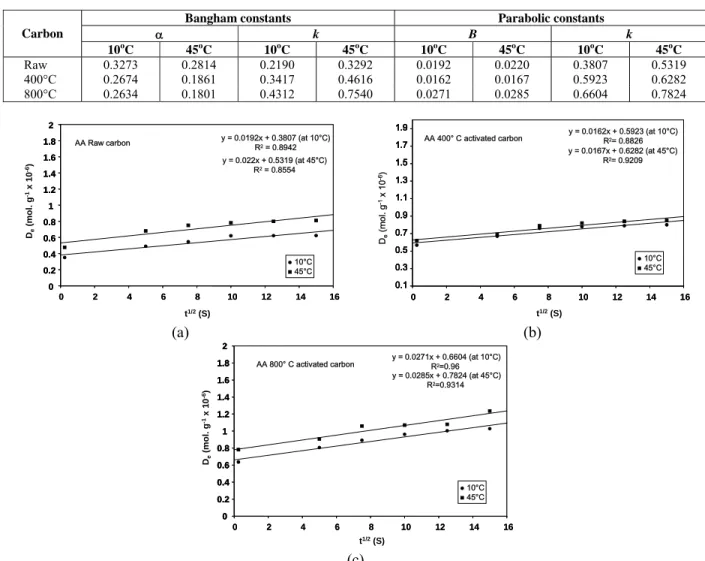
the adsorbent. Of the three steps, the third step is assumed to be rapid and considered to be negligible. The overall rate of adsorption will be controlled by the slowest step, which would be either film diffusion or pore diffusion. However, the controlling step might be distributed between intraparticle and external transport mechanisms. In both cases, the external diffusion is involved in the adsorption process. The adsorption of dye onto carbon particles may be controlled by the film diffusion at earlier stages and then, as the adsorbent particles are loaded with dye ions, the adsorption process may then be controlled by the intraparticle diffusion. The k value can be obtained from the slope of the plot DΦ(mol/g) vs. t1/2. It can be seen from Figure 13a-c that the adsorption process has two phases. The linear portion ended with a smooth curve, followed by another linear portion. A similar type of trend has also been reported by Vadivelan (2005), Weber (1963), Weng 2006) and Kannan et al. (2001). The two phases in the intraparticle diffusion plot suggest that the adsorption process proceeds by surface adsorption followed by intraparticle diffusion. Calculated values of intraparticle diffusion coefficient, k, given in Table 4, increase with the increase in both the adsorption and sample activation temperatures. This is attributed to the instantaneous utilization of the most readily available adsorption sites on the carbon surfaces.
Raw carbon y = 0.3273x - 3.0218 (at 10°C) R2= 0.9356
y = 0.2814x - 2.8448 (at 45°C) R2= 0.9006
-5 -4.5 -4 -3.5 -3 -2.5 -2 -1.5 -1
0.6 0.7 0.8 0.9 1 1.1 1.2 1.3 1.4 1.5 1.6 log t log log Do /D o -D ø z10°C 45°C Raw carbon y = 0.3273x - 3.0218 (at 10°C) R2= 0.9356
y = 0.2814x - 2.8448 (at 45°C) R2= 0.9006
y = 0.3273x - 3.0218 (at 10°C) R2= 0.9356
y = 0.2814x - 2.8448 (at 45°C) R2= 0.9006
-5 -4.5 -4 -3.5 -3 -2.5 -2 -1.5 -1 -5 -4.5 -4 -3.5 -3 -2.5 -2 -1.5 -1
0.6 0.7 0.8 0.9 1 1.1 1.2 1.3 1.4 1.5 1.6 log t log log Do /D o -D ø z10°C 45°C
400°C activated carbon y = 0.2674x - 2.8287 (at 10°C) R2 = 0.8978
y = 0.1861x - 2.698 (at 45°C) R2= 0.9689
-3.2 -3 -2.8 -2.6 -2.4 -2.2 -2
0.6 0.7 0.8 0.9 1 1.1 1.2 1.3 1.4 1.5 1.6 log t lo g lo g Do /D o -D ø z10°C 45°C 400°C activated carbon y = 0.2674x - 2.8287 (at 10°C) R2 = 0.8978
y = 0.1861x - 2.698 (at 45°C) R2= 0.9689
y = 0.2674x - 2.8287 (at 10°C) R2 = 0.8978
y = 0.1861x - 2.698 (at 45°C) R2= 0.9689
-3.2 -3 -2.8 -2.6 -2.4 -2.2 -2 -3.2 -3 -2.8 -2.6 -2.4 -2.2 -2
0.6 0.7 0.8 0.9 1 1.1 1.2 1.3 1.4 1.5 1.6 log t lo g lo g Do /D o -D ø z10°C 45°C (a) (b)
800°C activated carbon y = 0.2634x - 2.7276 (at 10°C)R2= 0.9803 y = 0.1801x - 2.5876 (at 45°C)
R2= = 0.9189
-3.3 -3.1 -2.9 -2.7 -2.5 -2.3 -2.1 -1.9
0.6 0.7 0.8 0.9 1 1.1 1.2 1.3 1.4 1.5 1.6 log t z10°C 45°C log lo g Do /D o -D ø
800°C activated carbon y = 0.2634x - 2.7276 (at 10°C)R2= 0.9803 y = 0.1801x - 2.5876 (at 45°C)
R2= = 0.9189
y = 0.2634x - 2.7276 (at 10°C) R2= 0.9803
y = 0.1801x - 2.5876 (at 45°C) R2= = 0.9189
-3.3 -3.1 -2.9 -2.7 -2.5 -2.3 -2.1 -1.9 -3.3 -3.1 -2.9 -2.7 -2.5 -2.3 -2.1 -1.9
0.6 0.7 0.8 0.9 1 1.1 1.2 1.3 1.4 1.5 1.6 0.6 0.7 0.8 0.9 1 1.1 1.2 1.3 1.4 1.5 1.6
log t z10°C 45°C log lo g Do /D o -D ø (c)
Table 4:Kinetic rateconstants of the Bangham and parabolic diffusion treatments of the adsorption of acid blue 1 on carbon.
Bangham constants Parabolic constants
α k B k
Carbon
10oC 45oC 10oC 45oC 10oC 45oC 10oC 45oC
Raw 0.3273 0.2814 0.2190 0.3292 0.0192 0.0220 0.3807 0.5319
400°C 0.2674 0.1861 0.3417 0.4616 0.0162 0.0167 0.5923 0.6282 800°C 0.2634 0.1801 0.4312 0.7540 0.0271 0.0285 0.6604 0.7824
AA Raw carbon y = 0.0192x + 0.3807 (at 10°C)R2= 0.8942
y = 0.022x + 0.5319 (at 45°C) R2= 0.8554
0 2 4 6 8 10 12 14 16 t1/2(S)
0 0.2 0.4 0.6 0.8 1 1.2 1.4 1.6 1.8 2 De (m o l. g -1 x 1 0 -6) z10°C 45°C
AA Raw carbon y = 0.0192x + 0.3807 (at 10°C)R2= 0.8942
y = 0.022x + 0.5319 (at 45°C) R2= 0.8554
0 2 4 6 8 10 12 14 16 t1/2(S)
0 0.2 0.4 0.6 0.8 1 1.2 1.4 1.6 1.8 2 0 0.2 0.4 0.6 0.8 1 1.2 1.4 1.6 1.8 2 De (m o l. g -1 x 1 0 -6) z10°C 45°C
AA 400° C activated carbon y = 0.0162x + 0.5923 (at 10°C) R2= 0.8826
y = 0.0167x + 0.6282 (at 45°C) R2= 0.9209
0.1 0.3 0.5 0.7 0.9 1.1 1.3 1.5 1.7 1.9
0 2 4 6 8 10 12 14 16 t1/2(S)
z10°C 45°C De (m ol . g -1x 10 -6)
AA 400° C activated carbon y = 0.0162x + 0.5923 (at 10°C) R2= 0.8826
y = 0.0167x + 0.6282 (at 45°C) R2= 0.9209
0.1 0.3 0.5 0.7 0.9 1.1 1.3 1.5 1.7 1.9 0.1 0.3 0.5 0.7 0.9 1.1 1.3 1.5 1.7 1.9
0 2 4 6 8 10 12 14 16 t1/2(S)
z10°C 45°C De (m ol . g -1x 10 -6) (a) (b)
AA 800° C activated carbon y = 0.0271x + 0.6604 (at 10°C)R2=0.96
y = 0.0285x + 0.7824 (at 45°C) R2=0.9314
0 0.2 0.4 0.6 0.8 1 1.2 1.4 1.6 1.8 2
0 2 4 6 8 10 12 14 16 t1/2(S)
z10°C 45°C De (mol. g -1 x 1 0 -6)
AA 800° C activated carbon y = 0.0271x + 0.6604 (at 10°C)R2=0.96
y = 0.0285x + 0.7824 (at 45°C) R2=0.9314
0 0.2 0.4 0.6 0.8 1 1.2 1.4 1.6 1.8 2 0 0.2 0.4 0.6 0.8 1 1.2 1.4 1.6 1.8 2
0 2 4 6 8 10 12 14 16 t1/2(S)
z10°C 45°C De (mol. g -1 x 1 0 -6) (c)
Figure 13: Parabolic diffusion plots of the acid blue 1 adsorption on carbon.a) Raw carbon; b) 400°C activated carbon; c) 800°C activated carbon.
CONCLUSIONS
Activated carbon, prepared from Ailanthus altissima, has surface functional groups like carboxyl groups, which disappear upon activation at 800oC, thus improving the adsorption capacity. The EDS indicates the increased relative amount of carbon with respect to oxygen with the increase in activation temperature. Molecular adsorption and stable orientation was achieved in about 15 seconds. The first order, Bangham and parabolic equations were found to apply to the kinetic adsorption data. Both the intraparticle and pore diffusion processes were involved in the interaction of dye on the carbon surface. The carbon produced from the wood of
Ailanthus altissima at 800 0C can be effectively used
as adsorbent for the removal of acid blue 1 from aqueous solutions.
ACKNOWLEDGEMENTS
The authors thank the University of Peshawar for financial support. We thank the Centralized Resource Laboratory (CRL), University of Peshawar, for providing research facilities.
NOMENCLATURE
B, α Constants
Dσ Solution concentration of dye at time t
DФ Amount adsorbed mol.g-1
F Variance ratio
h Planck constant 6.626 × 10⁻³⁴ Js
k Rate constant
kB Boltzmann constant 1.3806 × 10⁻²³ JK-1
P Significance of F statistics
SE Standard error estimate
V Volume of solution dm-3
W Weight of carbon g
REFERENCES
Aharoni, C., Sideman, S.; Hoffer, E. Adsorption of Phosphate Ions by Colloid Ion-Coated Alumina. J. Chem. Technol. Biotechnol., 29, 404 – 412 (1979).
Ahmad, I., Khan, M. A., Ishaq, M., Shakirullah, M., Bahader, A., Spectral Characterization of Superficial Coal Group, J. Eng. and Appl. Sci., 23, 117-123 (2004).
Babel, S., Kurniawan, T. A., Low Cost Adsorbent for Heavy Metal Uptake from Contaminated Water: a Review, J. Hazardous Materials, B97, 219 – 243 (2003).
Banat, I., Nigam, P., Singh, D., and Marchant, R., Microbial Decolorization of Textile - Dye Containing Effluents: a Review, Bioresour, Technol., 58, 217-227 (1996).
Bhabendra, K., Pradhan., Sandle., N. K., Effect of Oxidizing Agents Treatments on the Surface Properties of Activated Carbon, Carbon, 32, 123-1332 (1999).
Brunauer, S., Emmett, P., Teller, E. J., Adsorption of Gases in Multi-Molecular Layers, J. Am. Chem. Soc. 60, 309-319 (1938).
Cooke, N. E., Fuller, O. M., Gaikwad, R. P., FT-i.r. Spectroscopic Analysis of Coal and Coal Extracts, Fuel, 65, 1254-1259 (1986).
Derbyshire, F., Jagtoyen, M., Andrew, R., Rao, A., Martin-Gullon, I., Grulke, E., Carbon Materials in Environmental Applications, In: Radovic, L. R. (Ed.), Chemistry and Physics of Carbon, 27, Marcel Dekker, New York, 1 – 66 (2001).
Hassler, J. W., Purification with Activated Charcoal,
Chemical Publishing CO., INC. New York, 176 (1974)
Kannan, K., Sundaram, M. M. Kinetics and Mechanism of Removal of Methylene Blue by Adsorption on Various Carbons-a Comparative Study, Dyes Pig. 51, 25–40 (2001).
Karthikeyan, J., Removal of Color from Industrial Effluents. In: Trivedi, R. K. (Ed.), Pollution Management in Industries, Environmental Publication, Karad, India, 150 – 164 (1989).
Laidler, K. L., Chemical Kinetics, McGraw-Hill, New York, (1965).
Liu. Y. Some Consideration on the Langmuir Isotherm Equation, Colloids Surf. A: Physicochem. Eng. Aspects, 274, 34-36 (2006).
Lu. L., Shajwalla, V., Kong, C., Harris, D., Quantitative X-rays Analysis and its Applications to Various Coal, Carbon 39, 1821-1833 (2001). Qadeer, R., Hanif, J., Saleem, M., Afzal, M.,
Kinetics and Thermodynamics of Some Metal Ions Adsorption on Activated Charcoal from Aqueous Solution,Jour. Chem. Soc. Pak., 17, 82-86 (1995).
Ramakrishna, K. R., Viraraghavan, T., Dyes Removal Using Low Cost Adsorbent, Water Sci. Technol. 36, 189 – 196 (1997).
Snell, D. F., Hilton, C. L., Encyclopedia of Industrial Chemical Analysis, Intersc. Pub. New York, 4 (1967).
Sparks, D. L., Kinetics of Sorption/Release Reaction at the Soil Mineral/Water Interface, In: Spark, D.L (Ed.), Soil Physical Chemistry 2nd ed. CRC Press, Boca Raton, FL, (1999).
Vadivelan, V., Kumar, K. V., Equilibrium, Kinetics, Mechanism and Process Design for the Sorption of Methylene Blue onto Rice Husk, J. Colloid Interf., Sci. 286, 90 – 100 (2005).
Vaidya, A. A, and Datye, K. V., Environmental Pollution during Chemical Processing of Synthetic Fiber, Colorate, 14, 3-10 (1982).
Vickerstaff, T. The Physical Chemistry of Dyeing, Intersc. Pub., New York, p. 100 (1954).
Weber Jr., W. J., Morris, J. C., Kinetics of Adsorption on Carbon from Solution. J. Sanit. Eng. Div. ASCE 89 (SA2), pp.31–59 (1963).