www.earth-surf-dynam.net/3/105/2015/ doi:10.5194/esurf-3-105-2015
© Author(s) 2015. CC Attribution 3.0 License.
The role of velocity, pressure, and bed stress fluctuations
in bed load transport over bed forms: numerical
simulation downstream of a backward-facing step
M. W. Schmeeckle
School of Geographical Sciences and Urban Planning, Arizona State University, Tempe, Arizona, USA
Correspondence to:M. W. Schmeeckle ([email protected])
Received: 2 July 2014 – Published in Earth Surf. Dynam. Discuss.: 17 July 2014 Revised: 15 January 2015 – Accepted: 26 January 2015 – Published: 9 February 2015
Abstract. Bed load transport over ripples and dunes in rivers exhibits strong spatial and temporal variability due to the complex turbulence field caused by flow separation at bedform crests. A turbulence-resolving flow model downstream of a backward-facing step, coupled with a model integrating the equations of motion of individual sand grains, is used to investigate the physical interaction between bed load motion and turbulence downstream of separated flow. Large bed load transport events are found to correspond to low-frequency positive pressure fluctuations. Episodic penetration of fluid into the bed increases the bed stress and moves grains. Fluid penetration events are larger in magnitude near the point of reattachment than farther downstream. Models of bed load transport over ripples and dunes must incorporate the effects of these penetration events of high stress and sediment flux.
1 Introduction
The details of turbulent flow over dunes and ripples in rivers and oceans have been described by field and laboratory ex-periments (see Best, 2005, for an extensive review), as well as high-resolution, turbulence-resolving numerical simula-tions (Shimizu et al., 1999, 2001; Nelson et al., 2006; Zedler and Street, 2001; Omidyeganeh and Piomelli, 2011; Grigo-riadis et al., 2009; Stoesser et al., 2008; Chang and Con-stantinescu, 2013). However attempts to couple turbulence to the transport of sediment over bedforms have usually re-lied on empirical formulas, wherein the sediment flux is either a direct function of boundary shear stress or indi-rectly through entrainment rate and deposition rate formu-las (Niemann et al., 2011; Nguyen and Wells, 2009; Giri and Shimizu, 2006; Chou and Fringer, 2010; Paarlberg et al., 2009; Kraft et al., 2011) (although see Nabi et al., 2013, and Penko et al., 2013). Unlike suspended sediment fields, ex-periments detailing the spatiotemporal pattern of bed load transport over ripples and dunes have not been reported.
Experimental measurement of turbulence is often lim-ited to a time series of fluid velocity components at a sin-gle point or, more rarely, several points. In such instances, the detection of spatially and temporally evolving turbu-lence structures is difficult. Quadrant analysis has been used to detect certain types of turbulence structures (Lu and Willmarth, 1973; Bogard and Tiederman, 1986). Quadrant analysis involves joint examination of the fluctuating com-ponents of fluid velocity in the downstream, x, and bed-perpendicular, z, directions. u′ and w′ are the downstream and bed-perpendicular fluctuating components of fluid ve-locity. With u′ and w′ measurements plotted on a two-dimensional graph, the first quadrant (Q1) is a point with
u′>0 andw′>0; this is also known as an outward interac-tion. Quadrant 2 events (Q2,u′<0 andw′>0) are termed bursts or ejections, quadrant 3 events (Q3,u′<0 andw′<0)
are called inward interactions, and quadrant 4 events (Q4,
u′>0 andw′<0) are known as sweeps. Q2 and Q4 events
transport downstream momentum toward the bed, and are thus positive contributions to the Reynolds stress component,
−ρu′w′, whereas Q1 and Q3 events are negative
contribu-tions.
Schmeeckle (2014) used a coupled turbulence-resolving numerical model of flow and a particle model of sediment motion to simulate the interaction between turbulence and sediment movement over a flat bed. Vortical structures em-bedded within broader sweep structures were found to bring fluid into and out of the bed, and were sites of sediment en-trainment and transport. In this article I extend the model of Schmeeckle (2014) and Furbish and Schmeeckle (2013) to the case of bed load transport downstream of a backward-facing step, largely matching the experiments of Nelson et al. (1995). Quadrant analysis is extended to include sediment flux, bed stress, and fluid pressure. Flow over a backward-facing step, like that over bed forms, causes flow separation, but does not have the complicating effect of flow acceleration by an upstream sloping bed.
2 Methodology
The fluid is modeled by the large eddy simulation (LES) technique in which the spatially filtered Navier–Stokes equa-tions are integrated using the finite-volume method. The equations of motion of each sediment grain are integrated over time using the distinct element method (DEM). The sand grains are assumed to be spheres, and forces between particles are calculated when grain boundaries overlap. The LES and DEM models are coupled in momentum. The flow field is interpolated to the particle centers and used to de-rive fluid forces on the particles. In turn, each fluid force act-ing on the particles is given as a resistance term to the fluid momentum equations at the fluid cell containing the center of the particle. Only drag, pressure gradient, and buoyancy forces are included as fluid–particle forces. The bed of
par-ticles is about three to four grain diameters thick above the lower fluid boundary, and non-moving particles of the par-ticle bed rapidly damp the fluid velocity. The details of the numerical model reported here are the same as reported in Schmeeckle (2014).
The flow magnitude, step height (xstep), particle diameter
(D) and density (ρs), and flow depth of the numerical
simula-tions are specified to nearly match the experiments of Nelson et al. (1995). The computational domain extends 0.2 m up-stream of the 0.04 m backward-facing step and 1.2 m (30 step heights) downstream of the step, and 0.1 m (2.5) step heights across stream. The fluid domain in the vertical dimension ex-tends 0.16 m above the step, and downstream of the step the vertical domain is 0.2025 m. At rest, the topmost particles are roughly 0.0025 m above the lower wall. Thus, the flow height downstream of the step is about 0.2 m from the bed of parti-cles to the top of the numerical domain. The grid used in this study is a structured mesh of 4 655 000 hexagonal cells. The grid is evenly spaced in the downstream and cross-stream di-rections. The downstream and cross-stream grid lengths are 0.002 and 0.00143 m, respectively. The vertical grid spacing is nonuniform, with smaller grid cells containing the particles and near-bed flow. The vertical grid dimension is also signif-icantly reduced in a zone containing the separation bubble shear layer. The vertical dimension of cells containing parti-cles at the bottom of the numerical domain is 0.00025 m. The downstream and cross-stream grid dimensions are slightly larger than the diameter of the particles, but the particle ameters are about 3.6 times larger than the vertical grid di-mension. As such there is rarely more than one particle in a grid cell.
The domain of the DEM model begins at the step in the
x direction but otherwise coincides with the fluid domain boundaries. The particle domain is periodic in the down-stream and cross-down-stream directions. The diameters of the 415 000 particles in this simulation are randomly drawn from a normal distribution with a median of 0.9 mm and a standard deviation of 0.1 mm. The diameters are varied to avoid close packing arrangement of the bed during the simulation. The particle parameters for the DEM model are the same as in Schmeeckle (2014) except that the Young’s modulus is in-creased to 5×10⁶Pa.
Boundary conditions for fluid velocity are no shear at the upper boundary, periodic conditions in the cross-stream di-rection, and zero gradient at the outlet. The no-slip condition is applied at the lower boundary, but the fluid velocity be-comes negligible before reaching this boundary because of the presence of a bed of particles above it. The inlet bound-ary condition is specified as the velocity 0.15 m downstream of the inlet. This is similar to a periodic boundary condition wherein the inlet and outlet are the same velocity, but the recycled velocity is taken before the backward step, thus en-suring fully developed boundary layer turbulence upstream of the backward-facing step.
3 Results
Prior to recording simulation results, the flow reached dy-namic equilibrium after about 30 s of simulated time. Results reported here are for 20 s of simulated time. This length of time provided adequate statistics, but it was not so long that the bed of particles developed bedforms and areas of the bed without sufficient numbers of particles. However, bed eleva-tion changes of one to two particle diameters were apparent in response to the passage of individual turbulent events. The position, velocity, and fluid force of each particle of known diameter is recorded at 40 Hz. Similarly, the fluid velocity and pressure are saved simultaneously at 40 Hz along two near-bed horizontal slices at z=1 mm and z=5 mm and along a slice perpendicular to the cross-stream at the cen-ter of the numerical domain,y=0.05 m. The lower bound-ary of the fluid and particle domain is atz= −0.0025 m and the topmost particles of the bed at rest are at approximately
z=0. A local depth-integrated downstream sediment flux,
qsx, is calculated by summing the product of each particle
volume and velocity that is found in a 0.01×0.01 m hori-zontal area of the bed and then dividing by the local bed area (i.e., division by 0.0001 m2). Downstream bed shear stress,
τbxis calculated by summing the downstream component of
fluid force acting on all particles with centers contained in the same 0.01×0.01 m horizontal grid, and then dividing by the local bed area. The saved fluid velocity and pressure at
z=1 mm are extracted at points in the center of the grid of local bed areas used to calculate boundary stress and sed-iment flux. In this manner, the data examined in this article
-0.2 0.8 0 0.3 -70 70
10 20 30
-0.12 0.12
0
a)
b)
c)
d)
e)
f)
(m/s) (m/s) (m/s) (Pa)
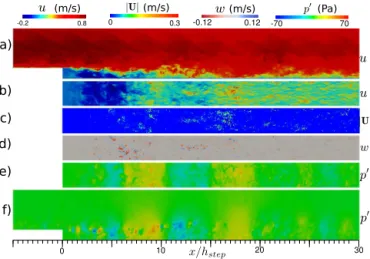
Figure 1.Visualization of the downstream fluid velocity,u; ver-tical velocity,w; particle velocity magnitude,|U|; and fluid pres-sure fluctuation,p′; at an instant in time.(a)Downstream veloc-ity on a vertical slice at the middle of the cross-stream domain. (b)Downstream velocity on a horizontal slice atz=1 mm.(c) Par-ticle velocity magnitude.(d)Vertical velocity on a horizontal slice atz=1 mm.(e)Fluid pressure fluctuation on a horizontal slice at
z=1 mm.(f)Fluid pressure at the middle of the cross-stream do-main. An animation associated with this figure can be found in the Supplement.
are of 20 s of simulated time at a rate of 40 Hz at 12 000 (1200 downstream by 10 cross-stream) points of fluid velocity and pressure, boundary shear stress, and depth-integrated down-stream sediment flux.
It should be noted that the bed stress, as defined here, is the sum particle force per bed area. It is not the near-bed Reynolds stress component,−ρu′w′. Averaged over
suffi-cient time, these two quantities are equivalent by a balance of forces. However, at a particular instant in time, there are fluid accelerations, andτbx6= −ρu′w′, except by coincidence.
Simultaneous visualization of the fluid pressure fluctua-tion,p′=p−p; downstream fluid velocity,u; and particle velocity magnitude,|U|, reveals a positive covariance of par-ticle motion with near-bed, downstream fluid velocity and fluid pressure (Fig. 1). Low-frequency, cross-channel varia-tions in pressure are apparent in Fig. 1, which were also noted in the direct numerical simulations of Le et al. (1997). Fig-ure 1 shows that positive pressFig-ure fluctuations are associated with both large near-bed downstream fluid and particle ve-locity magnitude. There are small areas of the bed with large negative vertical velocity (red areas of Fig. 1d). Fluid that penetrates the bed leads to neighboring areas where fluid ex-its the bed (blue areas of Fig. 1d). These large fluctuations in vertical velocity are associated with significant sediment motion (Fig. 1c).
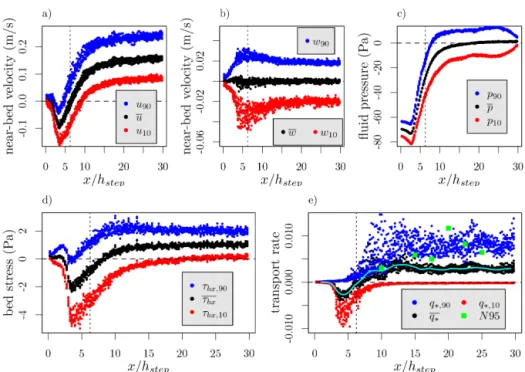
Figure 2 shows the temporal statistics (mean, 10th, and 90th percentile) vs. downstream distance for u, w, p, τbx,
andqsx. The position of the point of reattachment is plotted
Figure 2.Temporal mean and the 10th and 90th percentile flow and transport parameters are plotted against distance downstream relative to step height,x/hstep.(a)Downstream fluid velocity atz=1 mm,(b)vertical fluid velocity atz=1 mm,(c)fluid pressure atz=1 mm,(d)bed
shear stress, and(e)depth-integrated downstream sediment flux. N95 is the measured sediment flux of Nelson et al. (1995). A smoothed line of a moving average ofq∗of all points within 0.025 m upstream and downstream is also shown.
shows that the mean near-bed velocity (at z=1 mm) creases rapidly near the point of reattachment, and it in-creases, albeit much less rapidly, all the way to the down-stream outlet. Interestingly, the difference between the 90th and 10th percentile of velocity is larger near the outlet than in the reattachment zone. However, the difference between the 90th and 10th percentile of bed stress (Fig. 2d) is smaller near the outlet. The 10th percentile transport rates are essen-tially zero (or slightly negative) downstream of flow reattach-ment (Fig. 2e). The mean sedireattach-ment transport rate (Fig. 2e) increases rapidly downstream of reattachment and does not show a peak in transport at 20 step heights as do the results of Nelson et al. (1995). However, they suggested that the peak could be the result of sampling error.
The fluid pressure (Fig. 2c) rises rapidly from the recircu-lation region through the zone of reattachment (from about
x/hstep=3 to 7). The largest magnitude of this
upstream-directed pressure gradient is about 400 Pa m−1, which leads to a stress of about −0.5 Pa at x/hstep=5. This “pressure
gradient stress” is about one-third to one-quarter of the neg-ative bed stress in the recirculation and reattachment zone. However, this stress is distributed throughout the bed of par-ticles, and the resulting pressure force on individual grains is more than an order of magnitude smaller than is required to entrain the topmost grains that are able to move.
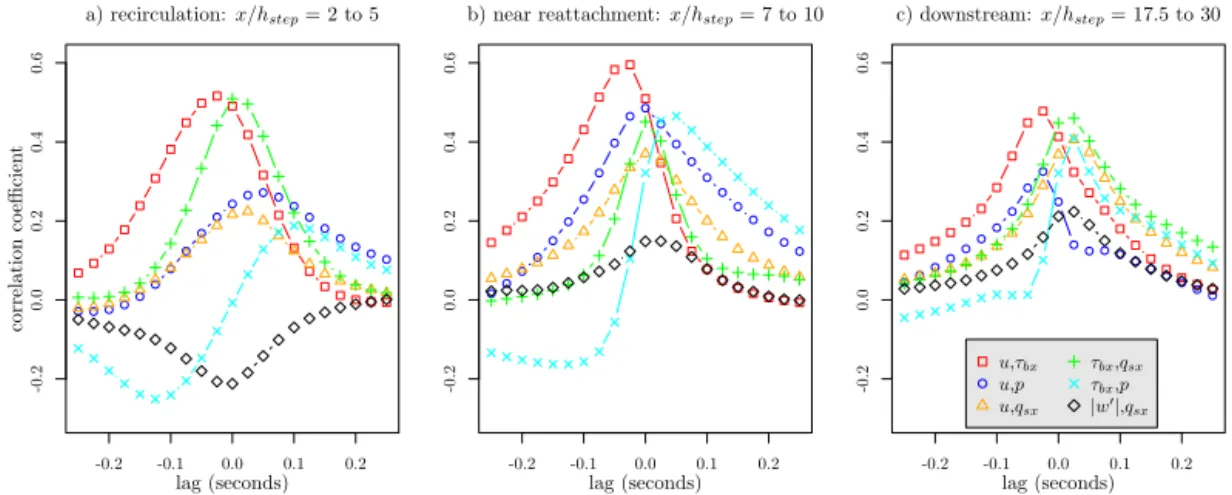
While Fig. 1 qualitatively shows the spatial covariance of some of the fluid and particle variables, Fig. 3 shows some of the significant temporal correlation pairs of variablesu,|w′|,
τbx, and p. The absolute magnitude of the vertical velocity
fluctuation,|w′|is used rather thanwbecause transport was
found to peak when the fluctuations of vertical velocity were high. It is perhaps unsurprising thatu′is positively correlated withτbxandqsx, but Fig. 3 also shows the positive correlation
with fluid pressure,p.
4 Discussion
4.1 Permeable splat events
Given that the force on bed grains results primarily from fluid drag, it is somewhat paradoxical that the temporal variance in the bed stress is much larger near reattachment, despite the smaller variance in downstream velocity at reattachment, relative to farther downstream. This apparent paradox is due to the fluctuations in vertical velocity being much larger near the point of reattachment than farther downstream (Fig. 2b). A large negative vertical velocity brings high downstream fluid velocity into the bed, thus creating peak bed stresses. Consider the plots in Fig. 2 between aboutx/hstep=8 and x/hstep=12. Figure 2a shows that the 90th percentile of the
-0.2 -0.1 0.0 0.1 0.2
-0.2
0.0
0.2
0.4
0.6
lag (seconds)
correlation
co
efficien
t
a) recirculation:x/hstep= 2 to 5
-0.2 -0.1 0.0 0.1 0.2
-0.2
0.0
0.2
0.4
0.6
lag (seconds)
b) near reattachment:x/hstep= 7 to 10
-0.2 -0.1 0.0 0.1 0.2
-0.2
0.0
0.2
0.4
0.6
lag (seconds)
c) downstream:x/hstep= 17.5 to 30
u,τbx
u,p u,qsx
τbx,qsx
τbx,p
|w′|,qsx
Figure 3.Correlation coefficients vs. time lag for various pairs of flow and transport variables as indicated in the legend in(c). The lag is of the second variable relative to the first variable in the legend shown in(c).
of vertical velocity is larger in this zone than farther down-stream. These large negative vertical velocities bring high-momentum fluid into the bed, increasing the force on grains and causing transport.
When a localized volume of fluid approaches and im-pinges on an impermeable boundary, the boundary-normal velocity must stagnate, and the fluid gets redirected to move parallel to the wall. Perot and Moin (1995) refer to these wall impingements as “splat events”, and Stoesser et al. (2008) note the occurrence of splats near flow reattachment in their simulations of turbulence over dunes. In the simulations re-ported here, the bed is a permeable boundary, and splats can penetrate the bed. To satisfy fluid continuity, infiltration of the bed by a splat must be accompanied by exfiltration of the bed surrounding the splat. Permeable splat events are ap-parent near reattachment in Fig. 1d (areas of intense red and blue) and the dynamics of the splat events are apparent in the Supplement animation of Fig. 1. Schmeeckle (2014) re-marked that significant entrainment of bed load grains occurs on the boundaries between areas of bed infiltration and exfil-tration.
The very large negative stresses in the recirculation re-gion which peak at about x/hstep=4 in Fig. 2d are due
to a negative mean vertical velocity, w, at the particle bed (Fig. 2b) and the large negative vertical velocity fluctuations,
w10. There is a mean penetration of fluid into the bed, and
there are permeable splat events. The downstream fluid ve-locity is also negative in the bed of particles due to the ad-verse pressure gradient. However, once again, the drag forces produced on the grains in this region are more broadly dis-tributed through the bed, in contrast to the bed well down-stream of flow reattachment, where the boundary shear stress is concentrated on only the topmost particles. This set of con-ditions also explains why the mean transport rate and near-bed downstream velocity are negligible even though Fig. 2d
shows that the mean boundary shear stress is negative at the point of reattachment.
4.2 Quadrant analysis
Recall that the simulation data were collected foru,w,qsx, p, and τbx simultaneously at a horizontal grid of points. In
Fig. 4 all of the data were aggregated from all points down-stream ofx/hstep=12.5. Figure 4a shows the frequency of u′–w′paired bins, and the predominance of burst and sweep events is apparent. In Fig. 4b,qsx is summed for each u′– w′bin. The bins are then normalized by dividing all bins by the bin with the maximum sum ofqsx. Figure 4b shows that
most of the transport (about 80 %) takes place during sweeps and outward interactions. This result is consistent with Nel-son et al. (1995). In Fig. 4c,τbx′ is summed for eachu′–w′
bin, and each bin is normalized by the largest magnitude bin. Percentages for each quadrant in Fig. 4c are given by the sum6τbx′ and divided by the total deviation,6|τbx′ |. Sweeps are associated with high bed stress, and bursts are associ-ated with low bed stress. The pressure deviation is summed in eachu′–w′ bin in Fig. 4d and normalized by the magni-tude of the bin with the largest magnimagni-tude. Percentages for each quadrant are given by the sum6p′and divided by the total deviation,6|p′|. Sweeps and outward interactions are associated with high-pressure events and bursts and inward interactions are associated with low-pressure events.
Figure 4.Flow and transport data binned by downstream and vertical velocity fluctuation pairs,u′–w′. Data are aggregated for all points downstream ofx/hstep=12.5.(a)Bin counts normalized by the largest bin. The total percentage of counts for each quadrant are shown.
(b)The sum of downstream sediment transport in each bin,6qsx, normalized by the bin with the largest transport sum. The percentage of
transport for each quadrant is shown.(c)The sum of the downstream bed stress fluctuation for each bin, normalized by the magnitude of the bin with the largest magnitude. Percentages shown in each quadrant are for the sum of the stress fluctuation,6τbx′ , divided by the total absolute deviation,6|τbx′ |.(d)The sum of the fluid pressure fluctuation for each bin,6p′, normalized by the magnitude of the bin with the largest magnitude. Percentages shown in each graph are for the sum of the pressure fluctuation divided by the total absolute pressure deviation,6|p′|.
0 outward
0.02
0 sweep 0.02
0 burst
0.01 i
0 inward
0.01
f
-1e-05 1e-05 N
-50 50 Pa
U X
-0.2 0.8 m/s
u
-0.15 0.3 m/s
10
0 20 30
a)
b)
c)
d)
e)
f)
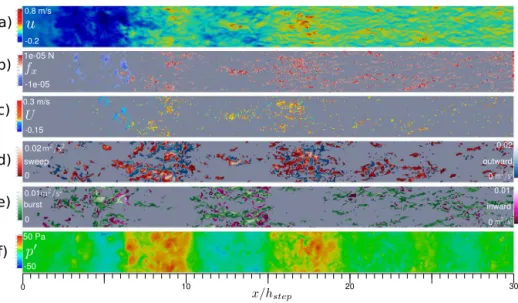
Figure 5. Flow, velocity quadrant, and transport variables at a time instant.(a)Downstream velocity at z=1 mm as shown in Fig. 1. (b)Downstream force,fx, on particles. Particles with|fx|<2×10⁻⁶N are not shown.(c)Downstream particle velocity. Particles with |U|<0.007 m s−1are not shown.(d) Sweeps and outward interactions atz=5 mm. Areas with|u′w′|<0.0004 m2s−2are not shown. (e) Bursts and inward interactions atz=5 mm. Areas with|u′w′|<0.0004 m2s−2 are not shown.(f) Near-bed pressure fluctuation at
Figs. 1 and 5 atx/hstep≈17. When a broad sweep impinges
on the permeable bed, there is infiltration and exfiltration at spatial scales smaller than the broader sweep structure. Areas of exfiltration are apparent as outward interactions.
Downstream-elongated structures of high- and low-speed fluid begin to emerge downstream of flow reattachment (Fig. 5a) (as also noted by Le et al., 1997). These emerging streaks also produce streaks of high particle forces (Fig. 4b) and particle motion (Fig. 4c).
5 Conclusions
Temporally averaged bed stress is not sufficient to spec-ify the rate of bed load transport downstream of separated flow (compare Fig. 2d and e). Most of the transport takes place at high-stress events that are associated with both high downstream velocity and high-magnitude vertical velocity events (Fig. 4b). The temporal distribution of bed stress is broader near flow reattachment than farther downstream (Fig. 4d), even though the temporal distribution of near-bed downstream velocity is less broad near flow reattachment than downstream. “Near-bed” and “in the bed” fluid veloc-ities are different. In this study near-bed was specified at
z=1 mm, which is about one sand grain diameter above the top of the bed. Negative vertical velocity events (splats) bring high downstream momentum fluid into the bed, and those bed penetration events are stronger near flow reattachment (Fig. 2b). Consequently, the 90th percentile of stress and the mean sediment flux reaches a peak in a relatively short dis-tance downstream of reattachment. This provides a probable explanation of the findings of Nelson et al. (1995) that instan-taneous, near-bed downstream velocity was not sufficient to specify the instantaneous sediment flux; the actual force on bed particles is also dependent on the penetration of turbu-lence structures into the bed. The upstream inclination of the stoss of bed forms, relative to the flat bed considered here, is expected to increase the intensity of fluid penetration events near flow reattachment.
The Supplement related to this article is available online at doi:10.5194/esurf-3-105-2015-supplement.
Acknowledgements. This material is based upon work
supported by the National Science Foundation under grant no. 1226288. All simulations were performed at the Arizona State University Advanced Computing Center (A2C2). Data produced in making this article can be obtained upon email request to the author.
Edited by: D. Parsons
References
Best, J.: The fluid dynamics of river dunes: a review and some fu-ture research directions, J. Geophys. Res.-Earth, 110, F04502, doi:10.1029/2004JF000218, 2005.
Bogard, D. and Tiederman, W.: Burst detection with single-point velocity measurements, J. Fluid Mech., 162, 389–413, 1986. Chang, K. and Constantinescu, G.: Coherent structures in flow over
two-dimensional dunes, Water Resour. Res., 49, 2446–2460, doi:10.1002/wrcr.20239, 2013.
Chou, Y.-J. and Fringer, O. B.: A model for the simulation of cou-pled flow-bed form evolution in turbulent flows, J. Geophys. Res.-Oceans, 115, C10041, doi:10.1029/2010JC006103, 2010. Furbish, D. J. and Schmeeckle, M. W.: A probabilistic derivation of
the exponential-like distribution of bed load particle velocities, Water Resour. Res., 49, 1537–1551, doi:10.1002/wrcr.20074, 2013.
Giri, S. and Shimizu, Y.: Numerical computation of sand dune mi-gration with free surface flow, Water Resour. Res., 42, W10422, doi:10.1029/2005WR004588, 2006.
Grass, A. and Ayoub, R.: Bed load transport of fine sand by laminar andturbulent flow, Coastal Eng. Proc., 1, 1589–1599, 1982. Grigoriadis, D. G. E., Balaras, E., and Dimas, A. A.: Large-eddy
simulations of unidirectional water flow over dunes, J. Geophys. Res.-Earth, 114, F02022, doi:10.1029/2008JF001014, 2009. Kraft, S., Wang, Y., and Oberlack, M.: Large eddy
simula-tion of sediment deformasimula-tion in a turbulent flow by means of level-set method, J. Hydraul. Eng., 137, 1394–1405, doi:10.1061/(ASCE)HY.1943-7900.0000439, 2011.
Le, H., Moin, P., and Kim, J.: Direct numerical simulation of tur-bulent flow over a backward-facing step, J. Fluid Mech., 330, 349–374, 1997.
Lu, S. and Willmarth, W.: Measurements of the structure of the Reynolds stress in a turbulent boundary layer, J. Fluid Mech., 60, 481–511, 1973.
Nabi, M., de Vriend, H. J., Mosselman, E., Sloff, C. J., and Shimizu, Y.: Detailed simulation of morphodynamics: 3. Ripples and dunes, Water Resour. Res., 49, 5930–5943, doi:10.1002/wrcr.20457, 2013.
Nelson, J. M., Shreve, R. L., McLean, S. R., and Drake, T. G.: Role of near-bed turbulence structure in bed load transport and bed form mechanics, Water Resour. Res., 31, 2071–2086, doi:10.1029/95WR00976, 1995.
Nelson, J. M., Burman, A. R., Shimizu, Y., McLean, S. R., Shreve, R. L., and Schmeeckle, M.: Computing flow and sedi-ment transport over bedforms, in: Proceedings of the 4th IAHR Symposium on River, Coastal and Estuarine Morphodynamics, 4–7 October 2005, Urbana, Illinois, USA, vol. 2, edited by: Parker, G. and Garcia, M., Taylor & Francis Group, London, UK, 861–872, 2006.
Nguyen, Q. and Wells, J. C.: A numerical model to study bedform development in hydraulically smooth turbulent flows, J. Hydraul. Eng., 53, 157–162, 2009.
Omidyeganeh, M. and Piomelli, U.: Large-eddy simulation of two-dimensional dunes in a steady, unidirectional flow, J. Turbul., 12, 1–31, 2011.
Paarlberg, A. J., Dohmen-Janssen, C. M., Hulscher, S. J. M. H., and Termes, P.: Modeling river dune evolution using a parameteri-zation of flow separation, J. Geophys. Res.-Earth, 114, F01014, doi:10.1029/2007JF000910, 2009.
Penko, A., Calantoni, J., Rodriguez-Abudo, S., Foster, D., and Slinn, D.: Three-dimensional mixture simulations of flow over dynamic rippled beds, J. Geophys. Res.-Oceans, 118, 1543– 1555, doi:10.1002/jgrc.20120, 2013.
Perot, B. and Moin, P.: Shear-free turbulent boundary layers, Part 1. Physical insights into near-wall turbulence, J. Fluid Mech., 295, 199–227, 1995.
Schmeeckle, M. W.: Numerical simulation of turbulence and sed-iment transport of medium sand, J. Geophys. Res.-Earth, 119, 1240–1262, doi:10.1002/2013JF002911, 2014.
Shimizu, Y., Schmeeckle, M. W., Hoshi, K., and Tateya, K.: Numer-ical simulation of turbulence over two-dimensional dunes, river, coastal and estuarine morphodynamics, in: Proceedings Interna-tional Association for Hydraulic Research Symposium, Genova, Italy, 251–260, 1999.
Shimizu, Y., Schmeeckle, M. W., and Nelson, J. M.: Direct numer-ical simulation of turbulence over two-dimensional dunes using CIP method, J. Hydrosci. Hydraul. Eng., 19, 85–92, 2001. Stoesser, T., Braun, C., García-Villalba, M., and Rodi, W.:
Turbulence structures in flow over two-dimensional dunes, J. Hydraul. Eng., 134, 42–55, doi:10.1061/(ASCE)0733-9429(2008)134:1(42), 2008.