S E Biotechnol. Agron. Soc. Environ. 2006 10 (2), 93 – 99
1. INTRODUCTION
Problems of environmental pollution by heavy metals from industrial activity represent a serious threat to human health and have been widely described (Keane, 1998; Bliefert, Perraud, 2001; Alvarez-Ayuso et al., 2003; Inglezakis, Grigoropoulou, 2003). Serious threats for Haitian community (Port-au-Prince) have been reported due to the presence of toxic heavy
metals such as lead in waste waters (Carré, 1997) and even in drinking water (Angerville et al., 2004). Due to the high toxicity related to lead, the United States Environmental Protection Agency (US EPA) since early 2004 has lowered the contamination level in drinking water from 50 to 15 μg.l-1 (X1, 2005). The
lead presence in Port-au-Prince urban environment results from activities such as paint manufacturing wastes waters, battery repairing shops, metallic gates
Investigations on Cationic Exchange Capacity and Unused
Bed Zone according to operational conditions in a Fixed
Bed Reactor for water lead removal by a natural zeolite
Pierre Naïder Fanfan
(1), Nicolas Mabon
(1), Philippe Thonart
(2), Georges Lognay
(1),
Alfred Copin
(1), Jean-Paul Barthélemy
(1)(1) Department of Analytical Chemistry. Gembloux Agricultural University (FUSAGx). Passage des Déportés, 2.
B-5030 Gembloux (Belgique). E-mail : [email protected]
(2) Walloon Centre of Industrial Biology (CWBI). Passage des Déportés, 2. B-5030 Gembloux (Belgique).
Received 21 February 2005, accepted 11 January 2006
In this study, attention has been focused on the behaviour of the Cationic Exchange Capacity (CEC) and the Unused Bed Zone (UBZ), according to the operating parameters (bed length: L, column diameter: D, particle diameter: d and
fl ow rate: Q) in a Fixed Bed Reactor (FBR). The investigations are performed for a single-component study of lead on New Zealand clinoptilolite at 25 ± 1°C. The results show a constant operating CEC of 1.00 ± 0.015 meq.g-1 which is
independent of the operational parameters listed above. The performance of the operations expressed as UBZ, shows an optimum for the ratio L/D (bed length and column diameter) fi xed at 18.1, for Q = 2.9 BV.h-1 (bed volume per hour) and
particle diameter d = 0.38 mm (the ratio particle diameter on column diameter d/D at 0.057). This maximum performance is reached with the lowest UBZ value of 5.6% of the operating CEC. Overall interpretation drawn from the results according to UBZ shows that decreasing the particles size improves the performance of ion exchange process; as well as decreasing the fl ow rate. Nevertheless, the increase of L/D to a certain extent does not improve ion exchange performances. Keywords. Cationic Exchange Capacity, Unused Bed Zone, clinoptilolite, Fixed Bed Reactor, zeolite.
Étude de la capacité dʼéchange cationique dʼune zéolite naturelle et de la zone non utilisée dʼun réacteur à lit fi xe en fonction des conditions opératoires pour lʼélimination du plomb dans lʼeau. Dans cette étude lʼattention a été portée sur la variation de la Capacité dʼÉchange Cationique (CEC) et de la Zone du Lit non Utilisée (UBZ), en fonction des paramètres opératoires (longueur du lit : L, diamètre de la colonne : D, granulométrie : d et le débit : Q) dans un réacteur à lit fi xe (FBR). Les expérimentations sont réalisées pour lʼétude du plomb sur de la clinoptilolite de Nouvelle Zélande à la température de 25 ± 1 ° C. Les résultats montrent une constante CEC opératoire de 1,00 ± 0,015 meq.g-1 qui est indépendante des paramètres
cités ci-dessus. La performance des opérations exprimée par UBZ, montre un optimum pour le rapport L/D (longueur du lit sur diamètre de la colonne) fi xé à 18,1 pour Q = 2,9 BV.h-1 (volume de lit par heure) et une granulométrie d = 0,38 mm
handicrafts, welding activities, vehicle body and motor repair shops and many other activities not cited here. Since that cation exchange on zeolites is an effective and economic way to treat industrial heavy metals contaminated wastes (Keane, 1998; Rodríguez-Iznaga
et al., 2002; Perićet al., 2003) investigations focussing on practical use of such process have been undertaken. The general aim of this study is to investigate the behaviour of lead retention by natural clinoptilolite zeolite. However it has been highlighted that recent data were scarce in that fi eld especially for clinoptilolite in Fixed Bed Reactors (FBR) (Inglezakis, Grigoropoulou, 2004). Cation Exchange Capacity (CEC) given for a material in a commercial purpose is different from the one obtained under given applied conditions by an investigator. The fi rst one may be defi ned as theoretical as it has been evaluated by chemical methods or spectrometric techniques (X ray diffraction, NMR, …). It refers to the total number of sites available on the material for cation exchange expressed in equivalents per gram. Some authors called it the Total Exchange Capacity (TEC) (Inglezakis et al., 2002). Since all these ionogenic groups on the material may not really be available for exchange, (cation hydrated radii too large to fi t into a channel (Helfferich, 1995), some of the ionogenic groups located at inaccessible sites of the material structure (Pabalan, 1994)), the CEC obtained by an operator is expected to be different. Inglezakis and his co-workers (2002), have defi ned this CEC as the Maximum Exchange Level (MEL). In this study we will be referring to CEC as the operating exchange capacity, the one obtained by an operator for a given cation. Some authors report that operating CEC is strongly dependent on the operating conditions such as fl ow rate (Q), particle diameter (d) or column geometry (L/D) (Hlaway et al., 1982; Inglezakis, Grigoropoulou, 2003). On the opposite, Lieu and Weber (1981), Helfferich (1995) agree with the basic theory which has stated that the operating CEC for a specifi c ion exchange system is independent of the experimental conditions applied to the system. The study is designed to investigate the operating CEC according to the operating parameters applied in a fi xed bed reactor such as the fl ow rate, the bed characteristics and the particle diameter of the material involved. At the same time for a better understanding of the FBR process, we will investigate the Unused Bed Zone (UBZ) which is a critical performance parameter bound to operations in FBR (Lau et al., 2003).
2. THEORETICAL
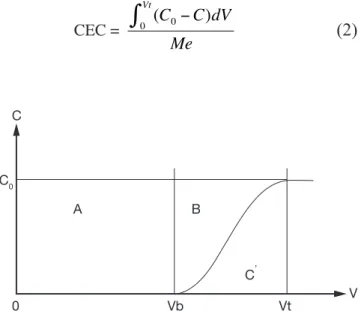
Operation in fi xed bed columns have been widely described elsewhere (Pansini, 1996). The operation in fi xed bed columns leads to the breakthrough curves
(Figure 1). This type of curve is the plotting of the cumulated effl uent volume (V) against concentration (C). From the breakthrough curves will be drawn the parameters that will permit an interpretation of the operation (Lau et al., 2003).
The Work Exchange Capacity (WEC) which is represented on the fi gure 1 by the area A. This area expresses the total amount of pollutants trapped over the material before breakthrough occurs. The later happens when a concentration (C) corresponding to a percentage of the initial concentration (C0) in the feed
reservoir is detected in the effl uent. This percentage of the initial concentration of the pollutant acceptable in the effl uent marks the limit of the WEC and is set in advance by the operator. The WEC expressed by mass unit of the material is given by the equation 1:
WEC =
Me dV C C
Vb
∫
−0 ( 0 ) =
Me C x
Vb 0
(1)
in which Me is the mass of the material used.
The operating CEC as defi ned before (Figure 1) corresponds to the sum of the A and B areas which represent the amount of cation kept over the material until complete saturation. The CEC expressed by mass unit of the material is given by the equation 2:
CEC = 0 (C0−C)dV
Vt
∫
Me
(2)
C
C0
C’
0 Vb Vt
A B
V
Figure 1. Theoretical breakthrough curve — Courbe de percée théorique.
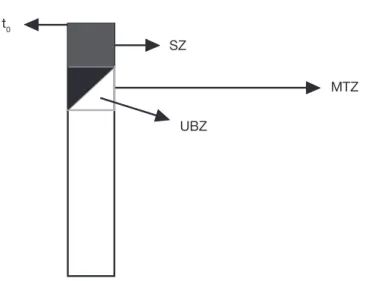
according to Nastro and Colella (1983), when t > t0, (t0 being the time corresponding to the launch of the operation) a front is constituted and moves along the column toward the end. This front keeps a constant shape during its curse and is made of three parts. This situation is illustrated in the fi gure 2.
The Saturated Zone is the exhausted area of the material where exchange has already taken place and equilibrium exists between the solid and the liquid phase.
The Mass Transfer Zone is the area where exchange is taking place and where exhaustion and equilibrium have not yet been achieved.
The Unused Bed Zone is the part of the MTZ which has not yet undergone exchange.
The concept of UBZ is of practical meaning. As seen in fi gure 2, breakthrough occurs when the front reaches the end of the column. Practically the operator decides to stop the operation at the breakthrough point which is related to a fraction of the initial allowable concentration in the effl uent. So, a remaining part of the material is systematically left unused. This fraction is fi xed according to the environmental guidelines. This unused part corresponds to the UBZ and is represented by the B area. The UBZ and the MTZ are the main surfaces which when expressed as a ratio of the total surface representing the CEC may well evaluate the FBR performance. The MTZ and the UBZ as defi ned are dimensionless and are given by the equations 3 and 4:
MTZ =
B A
C B
+
+ '
=
(
)
(
)
∫
−× − Vt
dV C C
C Vb Vt
0 0
0
(3)
UBZ =
B A
B
+ =
(
)
(
)
∫
∫
− −
Vt Vt
Vb
dV C C
dV C C
0 0
0
=
(
)
(
)
(
)
∫
∫
∫
−
− −
− Vt
Vt Vb
dV C C
dV C C dV
C C
0 0
0 0 0 0
(4)
In the case of symmetrical breakthrough curves, the B and Cʼ areas are identical and then equation 3 becomes:
MTZ =
B A
B
+ 2
= 2 UBZ =
(
)
(
Vt Vb)
Vb Vt
+ − 2
(5)
3. MATERIALS AND METHODS
3.1. Chemicals
The metal ion studied was Pb2+ from a 10-3mol.l-1
solution of Pb(NO3)2, (207.2 mg.l-1 of Pb2+). A solution
of 0.5 mol.l-1 NaNO
3, was used as pre-treatment
solution. All chemicals used were of analytical grade from Merck Eurolab (Darmstadt).
3.2. Sorbent material
The sorbent material used in this study was obtained from the « NZ Natural Zeolite, Zeotec Water » from New Zealand. According to the specifi cations, (X2, 2005) the mineral content was 75% pure clinoptilolite and mordenite with 25% impurities such as Opal C1 and smectite. The specifi c gravity is 0.65 g.cm-3. The
chemical composition of the material is summarized in table 1.
t0
MTZ SZ
UBZ
Figure 2. Dynamic of the exchange front through the column — Évolution de lʼéchange le long de la colonne. SZ: Saturated Zone; MTZ: Mass Transfer Zone; UBZ: Unused Bed Zone; t0: operation starting time — SZ : zone saturée ; MTZ : zone de transfert de masse ; UBZ : zone non utilisée du lit ; t0 : temps correspondant au début de lʼopération.
Table 1. Typical chemistry of the zeolite material — Com-position chimique de la zéolite.
The material is crushed and sieved to three different particles sizes: 0.65 mm (500 μm < Φ < 800 μm); 0.38 mm (250 μm < Φ< 500 μm); 0.20 mm (150 μ m < Φ< 250 μm), it is then washed to eliminate dust, dried at 103°C ± 2°C for 16 h, vacuumed in distilled water to eliminate gas molecules from the pores and packed on the columns.
3.3. Columns
Glass columns of 0.66 cm internal diameter equipped with adjustable plungers for length control have been used within this study. Three different column lengths 5.0 cm, 8.5 cm and 12.0 cm have been set.
3.4. Pre-treatment
Near homo ionic Na form of the material was obtained
in situ by passing through the column 50 BV (BV: Bed Volume) of the 0.5 mol.l-1 NaNO
3 solution at the fl ow
rate of ± 7 BV.h-1. The column was then rinsed in situ
with 50 BV of fresh distilled water at the same fl ow rate.
3.5. Analytical
The effl uent was automatically collected with a LKB Helirac 212 fraction collector in 20 ml glass tubes. The samples were acidifi ed with 1 ml of HCl 2M and analyzed for Pb2+ content by a Metrohm Herissau
E 502 polarograph (Switzerland). 6 ml of the acidifi ed samples (0.1M HCl) were placed in the cell and analyzed in differential pulse mode (50 mV pulse, with linear potential variation of 3 mV. sec-1) from - 0.2 to
- 0.6 V. The lead peak maximum appears at - 0.38 V (vs Ag/AgCl, saturated KCl). The LOQ was established at 10-8 M in pulse mode.
3.6. Experimental
The columns were operated in the up-fl ow mode in order to assure a complete wetting of the material. The feed was delivered to the column by mean of a Waters 515 HPLC pump with a variation of ± 0.1 ml.min-1. The exchange temperature was kept
at 25 ± 1°C. The fl ow rates were taken between 2 and 50 BV.h-1 according to Inglezakis and Grigoropoulou
(2003), who recommended between 5 and 15 BV.h-1.
Three different bed lengths (L = 5.0 cm; 8.5 cm and 12.0 cm) for a fi xed column diameter (D = 0.66 cm) allowed to be roughly in agreement with the general chromatographic principles which require a L/D ratio between ten and twenty. Finally three particles sizes (d = 0.20 mm, 0.38 mm and 0.65 mm) were selected in order to fi t the recommendations of Inczédy (1966): D/d must be taken superior to ten. The table 2 lists
the technical parameters and the experimentations carried out in this study. These runs are the result of a combination between the parameters and do not strictly follow a rigorous statistical rule. Nevertheless the variability of the experiments is of 6.85% (Fanfan
et al., 2005).
4. RESULTS
The experimental UBZ and corresponding CEC from the breakthrough curves are summarized in table 3. Practically, for the purpose of the study the breakthrough point has been fi xed at 1% (2 mg.l-1) of
the initial concentration.
5. DISCUSSION
As can be seen, it is obvious from the table 3 that the operating CEC of a zeolite operated in fi xed bed column, for a given cation does not depend on the operational parameters such as fl ow rate, column geometry or particles diameters. This fi nding is in line with Lieu, Weber (1981) and Helfferich (1995) results. For fi fteen runs achieved, with different values for the operation parameters the CEC of this material does not vary signifi cantly. The operating capacity of this clinoptilolite has been evaluated to 0.103 ± 0.002 g of lead per gram of material or 1.00 ± 0.015 meq.g-1.
The present mean result is in agreement with those found by several authors such as Leppert (1990), for lead retention on clinoptilolite. The explanation could be formulated as follows: the number of sites available
Table 2. List of the experimentations and the parameters under study — Liste des experimentations et des paramètres à lʼétude.
Run Bed length L Flow rate Q Particles size d
(cm) (BV.h-1) (mm)
1 12.0 23.40 0.38
2 12.0 2.92 0.38
3 5.0 56.20 0.38
4 5.0 7.02 0.38
5 12.0 12.50 0.65
6 12.0 12.90 0.20
7 5.0 30.00 0.65
8 5.0 31.10 0.20
9 8.5 31.40 0.65
10 8.5 32.50 0.20
11 8.5 3.90 0.65
12 8.5 4.00 0.20
13 8.5 18.60 0.38
14 5.0 31.60 0.38
on a given mass of the material for a given cation remains the same and all of them will be occupied before complete saturation occurred despite fl ow rate, particles sizes or bed geometry. This fi nding according to clinoptilolite and lead is different from others which results seem to prove the reverse (Hashimoto
et al., 1977; Inglezakis et al., 2002; Inglezakis, Grigoropoulou, 2003). The reverse is also obtained for ammonia (McLaren, Farquhar, 1973; Jörgensen
et al., 1976). Operating CEC could have been affected by the operating conditions especially where enough care hasnʼt been taken in order to avoid preferential path ways into the material. Indeed channelling causes an incomplete wetting of the zeolite particles (Hlaway
et al., 1982; Guangsheng et al., 1988). Incomplete wetting drives to partial use of the material then to a misevaluation of the real mass used and consequently to different values for the operating capacity. Another case where the CEC could have changed is, if the pre-treatment procedure differs from an experiment to another. Klieve and Semmens (1980) have reported that a clinoptilolite sample treated with sodium hydroxide has a higher CEC.
As reported before, the UBZ is a good parameter for performance evaluation in a fi xed bed reactor. As a matter of fact it can be stated that the lower the UBZ the better the operation. For a given operating CEC a low UBZ drives to a more important WEC and a sharper profi le of the breakthrough curve. Figures 3, 4 and 5 give the breakthrough curves for the experimentations with the same amount of material but different operating parameters.
The fi fteen reported curves may be divided into three categories. All the parameters calculated from those curves are fully comparable because they have been reported to the unit mass of material. In every set
Table 3. Results obtained for UBZ and CEC — Résultats obtenus pour UBZ et CEC
Run UBZ CEC (g/g)
1 0.327 0.101
2 0.057 0.104
3 0.348 0.107
4 0.227 0.106
5 0.229 0.103
6 0.143 0.103
7 0.403 0.101
8 0.197 0.103
9 0.320 0.105
10 0.124 0.102
11 0.160 0.103
12 0.117 0.104
13 0.235 0.105
14 0.259 0.104
15 0.288 0.103
Mean 0.103
STD 0.002
Figure 3. Breakthrough curves obtained for 2.26 ± 0.06 g of material — Courbes de percées obtenues pour 2,26 ± 0,06 g de matériau.
C/C0 (%)
100 90 80 70 60 50 40 30 20 10 0
0 250 500 750 1000 1250 1500
cumulated volume (ml)
Run 11 Run 10
Run 9
Run 14 Run 13
Run 12
Figure 4. Breakthrough curves obtained for 1.57 ± 0.07 g of material — Courbes de percées obtenues pour 1,57 ± 0,07 g de matériau.
100 90 80 70 60 50 40 30 20 10 0
0 250 500 750 1000 1250 1500
cumulated volume (ml)
C/C0 (%)
Run 14 Run 7 Run 8
Run 4 Run 3
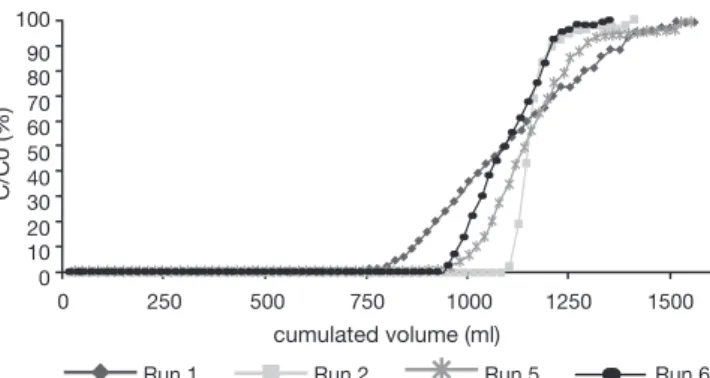
Figure 5. Breakthrough curves obtained for 0.96 ± 0.03 g of material — Courbes de percées obtenues pour 0,96 ± 0,03 g de matériau.
100
90 80 70 60 50 40 30 20 10 0
0 250 500 750 1000 1250 1500
cumulated volume (ml)
C/C0 (%)
Run 6 Run 5
of curves, the sharper ones are the ones for which better operational conditions have been achieved, leading to a very low UBZ. As shown on fi gure 3 the run 2 has led to the lowest UBZ (5.6% of the operating CEC). The operational conditions drawn from table 2 were L/D = 18.1 (for L = 12.0 cm and D = 0.66 cm), Q = 2.9 BV.h-1 and particles size d = 0.38 mm (the d/
D ratio at 0.057). We can also notice run 1 with the biggest UBZ of 32.7% of the operating CEC. The fl ow rate for this run is Q = 23.4 BV.h-1 for the same particle
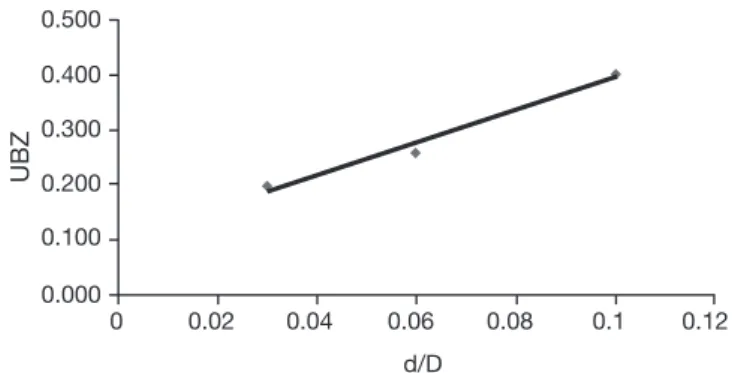
to column diameter ratio of 0.057. This observation demonstrates clearly that increasing the fl ow rate induces a decrease in the operation performance as UBZ. The following fi gures 6, 7 and 8 illustrate the variation of UBZ according to the three different operational parameters. This has to be considered as roughly informative as no statistical considerations have been made.
The results presented in fi gure 6 (indicating a diminution of UBZ according to the diminution of particles size) are in accordance with the theory: decreasing the particles size improves the performance of the ion exchange process (Hashimoto et al., 1977; Helfferich 1995; Jun-Boum et al., 2002; Inglezakis, Grigoroupoulou, 2004). Decreasing the fl ow rate improves the performance of ion exchange process; this statement has also been verifi ed by our results (Figure 7) as for Inglezakis and Grigoroupoulou (2004). On the other hand, the increase of the L/D ratio to a certain extent (Figure 8) does not seem improving the ion exchange performances.
6. CONCLUSION
The results gathered herein show that the operating capacity of a given material for a given cation operated in fi xed bed reactor is constant regardless the operational conditions applied such as the fl ow rate, the L/D ratio and the d/D ratio. The performance parameter UBZ was also investigated according to the operating conditions and this study shows that it varies with the operational conditions. Although few literature data are related to the use of UBZ as performance parameter in FBR, the results are still comparable to those obtained with the breakthrough volumes, because a diminution of the UBZ leads to an increase of the breakthrough volume. This observation is of critical importance for further scaling up of the process. This paper presents some promising results and trends in understanding the retention behaviour of lead on clinoptilolite zeolite. In a complimentary approach the ongoing study will be extended to other heavy metal cations alone or in combinations and fi nally transposed to real samples of polluted water.
Acknowledgements
The authors would like to acknowledge Doctor Inglezakis VJ., for his scientifi c support and help, the CUD (Coopération Universitaire au Développement) and the AUF (Agence Universitaire de la Francophonie) for their fi nancial support and the Department of Statistics of Gembloux University.
UBZ
0.000 0.100 0.200 0.300 0.400 0.500
0 0.02 0.04 0.06 0.08 0.1 0.12
d/D
Figure 6. Variation of UBZ according to d/D — Variation de UBZ en fonction de d/D.
UBZ
0.000 0.050 0.150 0.250 0.300 0.400
0 10 20 30 40 50 60
Q (BV.h-1)
0.100 0.200 0.350
Figure 7. Variation of UBZ according to Q (BV.h-1) —
Va-riation de UBZ en fonction de Q (BV.h-1).
UBZ
0.000 0.050 0.150 0.250 0.300 0.400
0 5 10 15 20
L/D 0.100
0.200 0.350
Bibliography
Alvarez-Ayuso E., Garcia-Sanchez A., Querol X. (2003). Purifi cation of metal electroplating waste waters using zeolites. Water Res. 37 (20), p. 4855–4862.
Angerville R., Rony FJ., Balthazard K., Emmanuel E. (2004). Assessment of human exposures to lead in drinking water. XXIX Congrès Interaméricain du Génie Sanitaire et des Sciences de lʼEnvironnement, San Juan, Porto-Rico.
Bliefert C., Perraud R. (2001). Chimie de lʼenvironnement air, eau, sols, déchets. Bruxelles : De Boeck Université, 477 p.
Carré JC. (1997). Étude de lʼimpact des peintures laques et vernis sur lʼenvironnement et la santé. Haïti : Ministère de lʼEnvironnement & lʼOPS/OMS, 36 p.
Fanfan P., Mabon N., Carletti I., Claustriaux JJ, Thonart P., Lognay G., Copin A., Barthelemy JP (2005). New model for performance prediction in fi xed bed reactors based on the approach of the unused bed zone. Water Res. 39, p. 4004–4010.
Guangsheng Z., Xingzheng L., Guangju L., Quanchang Z. (1988). Removal of copper from electroplating
ef-fl uents (potch water) using clinoptilolite. In: Kallo D., Sherry HS. Occurences, Properties and Utilization of Natural Zeolites. Budapest : Akademiai Kiado, p. 529– 539.
Hashimoto K., Miura K., Tsukano M. (1977). Experimental verifi cation of design methods for liquid phase fi xed bed absorbers. J. Chem. Eng. Jpn 10, p. 27–34.
Helfferich F. (1995). Ion Exchange. New York, Dover, p. 421.
Hlaway J., Vigh G., Olaszi V., Inczedy J. (1982). Investigations on natural Hungarian zeolite for ammonia removal. Water Res. 16, p. 417–420.
Inczédy J.(1966). Analytical applications of ion exchangers. Budapest : Akademiai Kiado, p. 1–80.
Inglezakis VJ., Grigoropoulou H. (2004). Effects of operating conditions on the removal of heavy metals by zeolite in fi xed bed reactors. J. Hazardous Mater. B112, p. 37–43.
Inglezakis VJ., Grigoropoulou H. (2003). Modeling of Ion Exchange of Pb2+ in Fixed Beds of Clinoptilolite.
Microporous and Mesoporous Mater. 61 (1-3), p. 273–282. Inglezakis VJ., Loizidou MD., Grigoropoulou H. (2002).
Equilibrium and kinetic ion exchange studies of Pb2+,
Cr3+, Fe3+ and Cu2+ on natural clinoptilolite. Water Res.
36, p. 2784–2792.
Jörgensen SE., Libor O., Graber KL., Barkacs K. (1976). Ammonia removal by use of clinoptilolite. Water Res. 10, p. 213.
Jun-Boum P., Seung-Hak L., Jae-Won L., Chae-Young L. (2002). Lab scale experiments for permeable reactive barriers against contaminated groundwater with ammonium and heavy metals using clinoptilolite. J. Hazardous Mater. 95 (1-2), p. 65–79.
Keane MA. (1998). The removal of copper and nickel from aqueous solution using Y zeolite ion exchanger. Colloids and surfaces A. Physicochem. Eng. Aspects 138, p. 11–20. Klieve JR., Semmens MJ. (1980). An evaluation of pretreated natural zeolites for ammonium removal. Water Res. 14, p. 161–168.
Lau A., Crittenden BD., Field RW. (2004). Enhancement of Liquid Phase Adsorption Column Performance By Means of Oscilatory Flow: an experimental study. Sep. Purif. Technol. 35 (2), p. 113–124.
Leppert D. (1990). Heavy metal sorption with clinoptilolite zeolite : alternatives for treating contaminated soil and water. Mining Eng. 42 (6), p. 604–608.
Lieu KT., Weber WJ. (1981). J. WPCF 53, p. 1541.
McLaren JR., Farquhar GJ. (1973). Factors affecting ammonia removal by clinoptilolite. J. Environ. Eng. Div. EE4, p. 429–446.
Nastro A., Colella C. (1983). Column ion exchange data for ammonium removal water by phillipsite tuff. Ing. Chim. Ital. 19 (5-6), p. 41–45.
Pabalan RT. (1994) Thermodynamics of ion exchange between clinoptilolite and aqueous solutions of Na+/K+ and
Na+/Ca2+. Geoch. Cosmochim. Acta 58, p. 4573–4590.
Pansini M. (1996). Natural Zeolites as Cation Exchangers for Environmental Protection. Mineral Deposita 31, p. 563–575.
Perić J., Trgo M., Vukojević Medvidović N. (2003). Removal of zinc, copper and lad by natural zeolite - a comparison of adsorption isotherms. Water Res. Artic. Press.
Rodríguez-Iznaga I., Gómez A., Rodríguez-Fuentes G., Benítez-Aguilar A. (2002). Natural clinoptilolite as an exchanger of Ni2+ and NH
4
+ ions under hydrothermal
conditions and high ammonia concentration. Microporous Mesoporous Mater. 53 (1-3), p. 71–80.
X1, US Environmental Protection Agency (2005). http://www.epa.gov/dclead. Consulted on 18/08/05. X2, NZ Natural Zeolite Zeotec Water (2005).