Air Injection in Water with Different Nozzles
Iran E. Lima Neto
1; David Z. Zhu, M.ASCE
2; and Nallamuthu Rajaratnam, F.ASCE
3Abstract:Air injection systems have a wide range of environmental engineering applications. In this study, we conducted experiments on air injection in a relatively large water tank to investigate the effect of nozzle type, including single/multiple orifice nozzles and a porous airstone, on the characteristics of the bubbles and the induced flow structure. Measurements of bubble characteristics and flow field surrounding the bubble core were obtained using a double-tip optical probe and particle image velocimetry, respectively. The results revealed that bubble velocity did not change significantly with different nozzles, but bubble size decreased significantly while interfacial area, liquid entrainment rate, and kinetic energy of the mean and turbulent flow increased significantly by using the porous airstone instead of nozzles with large orifices. The results for a nozzle with multiple orifices of small diameter are comparable to those for the airstone, which suggests the suitability of its use for systems susceptible to clogging of the pores. Correlations using adequate length and velocity scales are also proposed to describe both bubble and liquid flow characteristics. Finally, applications of the results for different artificial aeration/mixing systems are presented.
DOI:10.1061/共ASCE兲0733-9372共2008兲134:4共283兲
CE Database subject headings:Aeration; Turbulent flow; Air injection.
Introduction
Bubble plumes are widely used for artificial aeration and mixing in lakes, reservoirs, and wastewater treatment systems共Wüest et al. 1992; McCord et al. 2000; McGinnis and Little 2002; DeMoyer et al. 2003; McGinnis et al. 2004; Sahoo and Luketina 2006兲. These types of two-phase flows are formed when air or pure oxygen is continuously discharged into the water, producing bubbles that rise inducing surrounding liquid entrainment and oxygen transfer to the water. The size of the rising bubbles de-pends on bubble breakup/coalescence processes 共which depend on several factors such as turbulence, bubble collision frequency, presence of impurities, and so forth兲 and the counterbalancing effects of mass transfer and reducing pressure head acting on the bubble surface. Two important parameters that are controlled by the sizes of the bubbles are the mass transfer coefficient or liquid film coefficient, KL, and the air-water interfacial area per unit
liquid volume or specific interfacial area,a. These parameters are related to the rate of oxygen transfer to the water through the following equation, derived from Fick’s law of diffusion共Mueller et al. 2002兲
dC
dt =KLa共Cs−C兲 共1兲
whereC= dissolved oxygen共DO兲concentration in the water; and
Cs= saturation DO concentration. Correction factors forKLandCs
to account for the effects of water temperature, pressure, and pres-ence of impurities are commonly used in wastewater aeration systems共see Mueller et al. 2002兲. While the mass transfer coef-ficientKLincreases with bubble diameter, reaching a maximum of
approximately 0.05 cm/s for bubbles of about 2 mm and then decreasing as the diameter increases共Barnhart 1969; Montarjemi and Jameson 1978兲, the specific interfacial areaa decreases sig-nificantly as the mean bubble diameter increases. The sizes of the bubbles also determine their shape and velocity共Clift et al. 1978兲, which in return affect their residence time in the water and, as a consequence, the rate of oxygen transfer to the water. An experi-mental study conducted by Leitch and Baines 共1989兲 on dilute bubble plumes also showed that bubble size affects the surround-ing flow structure because the individual bubble wakes play an important role in the liquid entrainment rate. Additional liquid turbulence caused by the wakes of the bubbles and bubble colli-sion processes has also been observed recently by Brücker and Schröder共2004兲.
In artificial aeration systems, oxygen transfer to the water also occurs during bubble formation at the orifices and bubble bursting at the free surface. In principle, the oxygen transfer rate for each of these processes could also be described as a function of a mass transfer coefficient, interfacial area, and DO concentration deficit
共Eckenfelder 1959; Barnhart 1969兲, as mentioned above for rising bubbles关see Eq.共1兲兴. However, the complexity of these processes makes the estimation of the mass transfer coefficient and interfa-cial area very difficult. Following the methods of McWhirter and Hutter共1989兲and DeMoyer et al.共2003兲, Schierholz et al.共2006兲
used measurements of DO concentrations in several aeration tanks of different scales and performed a regression analysis to separate the contributions of oxygen transfer to the water from the bubbles and across the air-water surface. They reported that for 1
Ph.D. Candidate, Dept. of Civil and Environmental Engineering, Univ. of Alberta, Edmonton AB, Canada T6G 2W2. E-mail: limaneto@ ualberta.ca
2
Professor, Dept. of Civil and Environmental Engineering, Univ. of Alberta, Edmonton AB, Canada T6G 2W2 共corresponding author兲. E-mail: [email protected]
3
Professor Emeritus, Dept. of Civil and Environmental Engineering, Univ. of Alberta, Edmonton AB, Canada T6G 2W2. E-mail: [email protected]
relatively high air flow rates, fine bubble diffusers are better for bubble aeration while coarse bubble diffusers are more suitable for surface aeration. They also proposed correlations for bubble and surface volumetric mass transfer coefficients共KLa兲. A
sum-mary of standard measurement methods to estimate the total value ofKLathrough regression analysis in aeration systems is given in a recent ASCE standard-ASCE/EWRI 2-06共ASCE 2007兲. On the other hand, in the case of point-source bubble plumes in lakes or reservoirs with much larger free surface areas, additional oxygen transfer will occur through turbulent diffusion at the water surface due to the effects of circulation water flow and wind stream共see McCord et al. 2000兲. Several equations of KL for each of these
effects are summarized by Chu and Jirka共2003兲and Lima Neto et al.共2007b兲.
Sufficient circulation and mixing is also required in artificial aeration systems to disperse DO and provide uniform organic matter concentrations throughout the water. Due to the difficulty in measuring flow patterns for a particular aeration system, lim-ited information on circulation and mixing characteristics is avail-able and usually a velocity of about 0.15 m/s across the basin bottom is assumed to prevent solids deposition in degritted waste-water tanks 共WPCF 1988; Mueller et al. 2002兲. Soga and Reh-mann共2004兲, Wain and Rehmann共2005兲and García and García
共2006兲 recently conducted measurements of turbulence in the flow field surrounding a bubble plume for aeration and mixing in a wastewater tank to prevent anaerobic conditions. These mea-surements will help to evaluate the mixing requirements and as-sociated transport processes induced by a bubble plume.
Despite the importance of bubble properties and mean/ turbulent liquid flow structure on the performance of aeration/ mixing systems and their designs, very few studies have been devoted to this issue. In addition to bulk dissolved oxygen mea-surements, Rosso and Stenstrom 共2006兲roughly estimated aver-age bubble size and velocity in a relatively small aeration tank
共with diameter smaller than 40 cm兲, but no detailed information such as bubble size distribution, bubble slip velocity, interfacial area, and liquid flow structure were provided. The studies men-tioned above were conducted for diffusers occupying a large area on the bottom of the tank 共partial or total floor coverage兲. The case of point source discharges have been studied by Kobus
共1968兲, Iguchi et al.共1989, 1992兲, Swan and Moros共1993兲, Friedl and Fanneløp共2000兲, Soga and Rehmann共2004兲, Wain and Reh-mann共2005兲, and García and García共2006兲. Among these stud-ies, only Iguchi et al.共1989, 1992兲investigated the effect of the single orifice nozzle diameter on bubble properties and mean/ turbulent liquid flow structure. However, their experiments were conducted in small scale vessels 共or confined setups兲 where the flow behaves differently from unbounded bubble plumes 共see Lima Neto et al. 2007a兲.
The present investigation was similar to Iguchi’s, however, it was conducted in a much larger water tank, with the bubble plumes away from the boundaries. Multiple orifice nozzles and a porous airstone were also tested in addition to single orifice nozzles. Therefore, the aim of this work was to investigate ex-perimentally the effect of nozzle type on the characteristics of the bubbles such as bubble size, velocity, and interfacial area as well as the mean/turbulent liquid flow structure generated in a rela-tively large water tank. The results of this study are applicable to shallow water cases such as artificial aeration/mixing in wastewa-ter tanks共Mueller et al. 2002兲and rivers共Lima Neto et al. 2007b兲
and provide information for initial conditions in bubble plume models.
Experimental Apparatus and Program
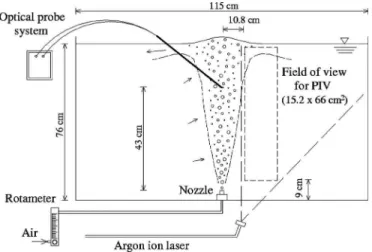
The experiments were performed in a square glass-walled tank of 1.2 m with a height of 0.8 m, shown schematically in Fig. 1. The tank was filled with tap water at 20± 1 ° C up to a depth of 0.76 m. The gas supply was taken from an air line with 1.0 atm pressure and temperature of 21± 1 ° C. Volumetric air flow rates, Qa, of
33.3 and 50.0 cm3/s were adjusted by a rotameter and discharged through different nozzles 共single/multiple orifice nozzles and a porous airstone兲, connected by a poly vinyl chloride共PVC兲pipe with inner diameter of 2.54 cm. These air flow rates were chosen because preliminary dye injection tests showed that for smaller values 共Qa= 16.7 cm3/s兲, the flow behaves like weak bubble
plumes with the entrained liquid spreading approximately with the square root of height, while for higher values 共Qa= 33.3 and 50.0 cm3/s兲, the entrained liquid spreads linearly with height, as expected for larger-scale bubble plumes 共see Leitch and Baines 1989兲. Higher air flow rates 共Qa= 66.7 cm3/s兲were not
consid-ered here because the flow became very unstable with strong surface waves being reflected from the walls of the tank. As sketched in Fig. 2, the single/multiple orifice nozzles were built from PVC caps where circular holes of different sizes were drilled, while the porous nozzle was built by drilling a circular hole of 6 mm diameter on a PVC cap and gluing a porous air-stone on its top. The nozzles of 1⫻3.0, 4⫻1.5, and 9⫻1.0 mm were designed such that the total orifice area remains the same, the single-orifice nozzle of 0.6 mm and the porous airstone being special cases. The sizes of the orifices used here were similar to those usually employed in fine and intermediate bubble diffuser systems, which range from about 0.1 to 5.0 mm 共Mueller et al. 2002兲. The nozzles were placed at the center of the tank and their exit was about 4.5 cm above the bottom. Experiments with each
Fig. 1.Schematic of experimental apparatus
nozzle and flow rate共see Table 1兲were performed separately for optical probe tests and particle image velocimetry 共PIV兲 tests, which are described in the following sections.
Optical Probe Tests
In the study, a double-tip optical fiber probe system共RBI Instru-mentation兲was used to measure bubble characteristics. The sys-tem is described as follows: A module emits infrared light via two fiber-optic cables to the tips of the probe, 2 mm apart. Each tip extends 1.5 cm and is sharpened into 30m diameter. Emitted light is refracted when water surrounds the tips, and reflected back to the module when air surrounds the tips. The reflected light passes through a semitransparent mirror combined with a prism towards a photosensitive diode in the module, and can be re-corded at a sampling rate of 1 MHz. Finally, direct amplification and detection through a threshold technique results in a two-state signal corresponding to the phase共air or water兲surrounding the tips. Thus, the double-tip optical fiber probe can measure not only void fraction and bubble frequency but also estimate through cross correlation the velocity in which a bubble travels from one tip to the other. Similar RBI double-tip optical fiber probe systems were used by Rensen and Roig 共2001兲, Boes and Hager共2003兲, Kiambi et al. 共2003兲, Chaumat et al.共2005兲, and Murzyn et al.
共2005兲to measure two-phase flow characteristics in bubbly flows. The optical probe signals were processed to calculate void fraction 共␣兲, bubble frequency 共fb兲, and velocity 共ub兲 and the
following equations given by Chanson共1997兲and Toombes and Chanson共2005兲were used to estimate the specific interfacial area 共a兲and bubble mean Sauter diameter共db兲
a= 4fb/ub 共2兲
db= 6␣/a 共3兲
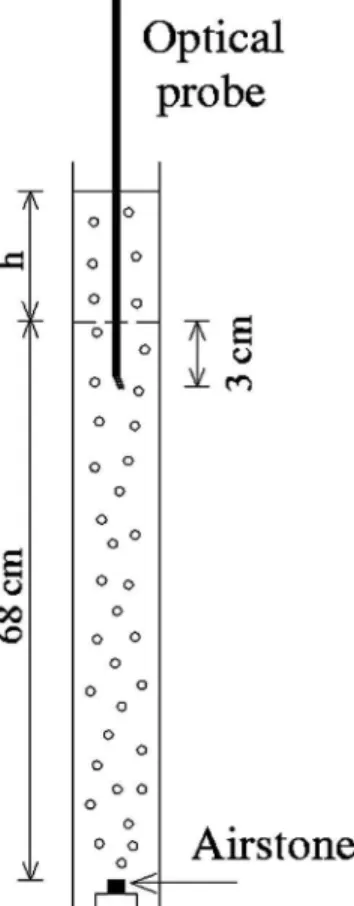
Since Eqs. 共2兲and共3兲assume that the bubbles are spherical and their motion is unidirectional, which does not often occur in artificial aeration/mixing systems, we conducted two preliminary tests to verify the accuracy of the optical probe measurements. The first test was performed in a bubble column of 5 cm diameter filled with tap water up to 68 cm, as shown schematically in Fig. 3. Air was injected from the bottom at different flow rates through the porous airstone, and the void fraction was obtained using the optical probe with the additional water level due to the presence of the bubbles also considered共see Chang et al. 2003兲. The results showed that the optical probe underestimates the void fraction by about 11%, which is in agreement with the differences of up to 14% obtained by Kiambi et al.共2003兲by comparing double op-tical probe measurements and image processing. The second test
was performed in the tank共see Fig. 1兲where air was injected at low flow rates through different nozzles to produce dilute bubble plumes containing bubbles ranging from about 2 to 10 mm volume-equivalent sphere diameter. In this case the optical probe was placed in the horizontal position with the tips 2 mm apart in the vertical direction to measure both bubble rising velocity and size. Images of these bubbles were then acquired using a high resolution charge coupled device 共CCD兲 camera 共TM-1040, Pulnix America Inc.兲controlled by a computer frame grabber sys-tem 共Streams 5, IO Industries Inc.兲 with a frame rate of 30 frames/s and exposure time of 1/4,000 s. The results showed
that the optical probes overestimate the bubble velocity by about 29% and underestimate the bubble size by about 10%. Similar results were obtained by Chaumat et al.共2005兲, who tested verti-cal bubbly flows with bubble size ranging from about 6 to 9 mm and obtained overestimations of bubble velocity of up to 32% and underestimations of bubble size of up to 20%.
Additional preliminary tests conducted in the tank with Qa
equal to 33.3 and 50.0 cm3/s clearly showed a low-frequency lateral oscillation of the bubble core of about ±5°. This nonsta-tionary nature of the flow, usually called wandering motion, per-sisted even for long-time observations 共⬎3 h兲and it was attrib-uted to buoyancy driven instabilities enhanced by the presence of the tank walls. Similar instabilities were previously reported in bubble plume experiments共Leitch and Baines 1989; Fanneløp et al. 1991; García and García 2006兲. In order to obtain stable mea-surements, tests were performed for sampling times ranging from 2 to 30 min. The results showed that 5 min was enough to obtain measurements of bubble characteristics within less than about ±10% difference. Therefore, all the bubble plume experiments were performed for 5 min duration. The measurements were
Table 1. Estimated Volumetric Mass Transfer Coefficients 共KLa兲 for
Each Experimental Condition. Values ofKLwere Obtained from
Corre-lation Given by Wüest et al.共1992兲and McGinnis and Little共2002兲as Function of Mean Bubble Diameter
Nozzle
Estimated values ofKLa
共h−1兲
Qa= 33.3 cm3/s Qa= 50.0 cm3/s
1⫻0.6 mm 12.34 15.91
1⫻3.0 mm 8.65 11.77
4⫻1.5 mm 11.04 13.83
9⫻1.0 mm 13.88 15.79
Airstone 18.96 19.16
taken for radial distances from the plume centerlinerof 0, 2, 4, and 6 cm and at a height above the nozzle exitzof 43 cm, which was far enough for bubble breakup/coalescence processes to be completed. The measurements were taken 5 min after start of air injection in the tank and the time interval between successive experiments was at least 20 min to ensure that the motion induced in the preceding experiment ceased completely. Fig. 4 shows typi-cal images of the bubbles in which bubble breakup occurs from approximately 10 to 25 cm above the nozzle exit. Bubble breakup processes were more evident for single orifice nozzles, where larger irregular bubbles were formed close to the nozzle exit due to coalescence and collapsed into much smaller spherical and ellipsoidal bubbles due to velocity gradients and turbulence. This is in contrast to the tests with multiple orifice nozzles and the airstone, where most bubbles formed at the nozzle exit were el-lipsoidal and with approximately the same size.
PIV Tests
The time criteria used for the optical probe tests were also applied for the PIV tests. In these tests, silver-coated glass particles with a density of 1.65 g/cm3 and a mean diameter of 15m were
homogenously distributed over the tank. A continuous 6 W argon ion laser operating at 488 nm 共Stabilite 2017, Spectra-Physics Lasers兲connected by a fiber-optic cable to a cylindrical lens共OZ Optics Ltd.兲illuminated a field of view of 15.2⫻66 cm2, 4.5 cm above the nozzle exit and 10.8 cm from the nozzle centerline共see Fig. 1兲. A high resolution CCD camera 共Pulnix TM-1040兲 con-trolled by a computer frame grabber system 共Streams 5, I. O. Industries Inc.兲captured images of the particles with a frame rate of 30 frames/s and exposure time of 1/60 s. The field of view corresponded to an image size of 240⫻1,040 pixels, yielding a resolution of 15.8 pixels/cm. The displacements between
subse-quent images were computed using a standard cross-correlation PIV algorithm共Heurisko, version 4.0.8, Aeon Verlag and Studio兲
with an interrogation window size of 64⫻64 pixels and 50% overlap between adjacent windows.
Because of the nonstationary nature of the flow mentioned above, a digital filtering technique was used to separate the tur-bulent motions共i.e., high-frequency signals兲and the periodic mo-tions 共i.e., low-frequency signals兲 from the original velocity
signals, and the mean/turbulent velocity components at each point were then computed using a computer algorithm written in Mat-lab共The Mathworks Inc.兲.
Measurements of the flow field within the bubble core were not possible with PIV because the bubbles were much bigger and brighter than the tracer particles and the intensity of the light reflected from them saturated the camera and corrupted the re-sults. However, an electromagnetic propeller anemometer共Omni Instruments, MiniWater20兲with internal diameter and casing of 22 and 28 mm, respectively, was used to measure mean vertical water velocity inside the bubble core. The anemometer is suitable for velocities higher than 2 cm/s with an accuracy of 2%. These
measurements were taken when the bubble plumes were in a straight vertical position and were used to estimate the relative velocity between the bubbles and the water共i.e., bubble slip ve-locity兲. Similar propeller anemometers have been used in bubble plume studies by Swan and Moros 共1993兲, Riess and Fanneløp
共1998兲, and Friedl and Fanneløp共2000兲.
It is important to stress that both optical probe and PIV tests were performed on tap water with negligible suspended solids concentration. However, if a relatively large amount of suspended solids is added to the water, the refractive index of the mixture will be close to that of the air phase and corrupt the optical probe measurements共see Boyer et al. 2002兲. The presence of suspended solids in the water will also affect the PIV measurements. The images of suspended solids need to be separated from those of tracer particles either by using fluorescent tracer particles or by size and geometry separation共see Kiger and Pan 2000兲. Note that in our PIV tests, the weight concentration of tracer particles was so small 共less than 0.001%兲 that their interactions with the bubbles were considered negligible.
Experimental Results and Analysis
Bubble Characteristics
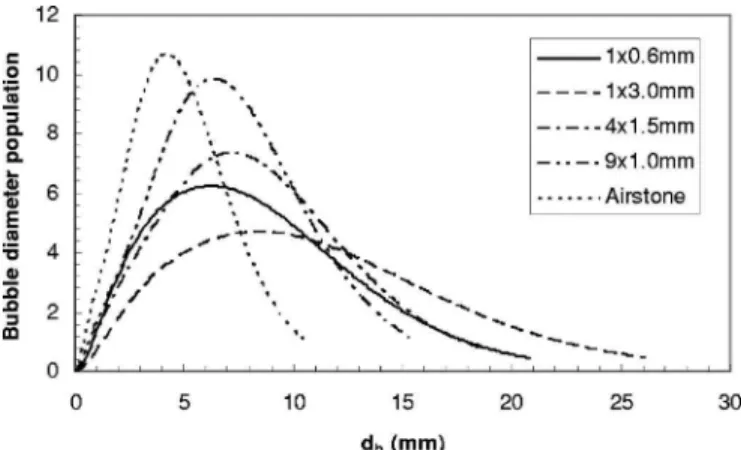
The time series of void fraction indicated a low-frequency peri-odic fluctuation about the mean value of about 0.03 Hz, corre-sponding approximately to the lateral oscillation of the bubble core. Fig. 5 shows typical void fraction time series measured with the two fiber-optic tips of the RBI probe. The time-averaged ra-dial distributions of all void fraction共and bubble frequency兲 mea-surements followed Gaussian curves similar to those obtained by Swan and Moros 共1993兲 and Friedl and Fanneløp 共2000兲. Our discussion will focus, however, on the time-averaged radial dis-tributions of bubble mean Sauter diameter, velocity, and specific interfacial area, which are considered of major importance in ar-tificial aeration systems. Fig. 6 shows typical bubble size distri-butions obtained from measurements at the plume centerline. These distributions resemble gamma or log-normal curves with more uniform bubble sizes 共narrower band兲 as the number of orifices increases and their size decreases. Fig. 7 shows typical radial distributions of mean Sauter diameter, velocity, and specific interfacial area. It can be seen that while the bubble mean Sauter diameter and velocity distributions are well described by a straight line, the specific interfacial area distribution follows a Gaussian curve.
As the bubble velocity is the combination of the water velocity and the bubble slip velocity, the water velocity within the plume was measured using the Omni anemometer. Fig. 7共b兲shows that the water velocity decreased linearly from the maximum at the center of the plume to close to zero at the edge of the plume. In
addition, the bubble slip velocity was about 0.55 m/s, which is
higher than the terminal bubble velocity of about 0.30 m/s given
by Clift et al. 共1978兲for isolated bubbles of similar diameters. This may be because trailing bubbles in the wake of leading bubbles rise faster than isolated bubbles due to drag reduction, as observed by Ruzicka 共2000兲. These measurements are important because bubble plume models accounting for oxygen transfer to the water usually assume uniform distributions共top hat兲of bubble characteristics, as well as constant slip velocities equal to the terminal bubble velocities given by Clift et al.共see Wüest et al. 1992兲.
Fig. 8 summarizes the average radial values of bubble mean Sauter diameter 共db兲, absolute bubble velocity共ub兲, and specific
interfacial area共¯a兲for each experimental condition. It can be seen that bubble mean Sauter diameter could be decreased by about 50% while interfacial area could be increased by about 90% by using the porous airstone instead of the single orifice nozzle of 3.0 mm. On the other hand, absolute bubble velocity did not change significantly, as observed by Iguchi et al.共1989, 1992兲in a confined bubble plume setup. However, their values were about 30% smaller than those obtained here for similar air flow rates and orifice diameters. This may be attributed to smaller bubbles due to stronger breakup processes in their confined setup as well as lower liquid entrainment rate, which will be discussed further in this paper. The results of bubble mean Sauter diameter and interfacial area for the multiple orifice nozzle of 9⫻1.0 mm are comparable to those for the airstone. This means that for systems susceptible to rapid clogging, such as porous nozzles in wastewa-ter treatment tanks and natural wawastewa-ter bodies with high
concentra-Fig. 5. Typical void fraction time series for two fiber-optic tips of RBI probe: measurements taken atr= 2 cm and z= 43 cm 共nozzle type: 4⫻1.5 mm,Qa= 50.0 cm3/s兲
Fig. 6.Typical bubble size distributions obtained from measurements atr= 0 cm andz= 43 cm共Qa= 33.3 cm3/s兲
Fig. 7.Typical radial distributions of:共a兲bubble mean Sauter diam-eter共also indicating standard deviations兲;共b兲absolute bubble velocity
tion of suspended solids and/or organic matter, the use of multiple small-orifice nozzles may be preferable rather than the use of porous airstones. Note that our porous airstone clogged after some tests and needed cleaning to reduce the friction head losses and achieve the desired air flow rates. The results for the single orifice nozzle of 0.6 mm were similar to those of the multiple-orifice nozzle of 9⫻1.0 mm, but the latter produced bubbles of more uniform size 共see Fig. 6兲. The single orifice nozzle of 0.6 mm presented some advantage over the single orifice nozzle of 3.0 mm and the multiple-orifice nozzle of 4⫻1.5 mm because the high-velocity jet issuing from its exit produced more bubbles of smaller size due to very strong bubble breakup processes共 es-pecially for the higher air flow rate兲.
In order to normalize the results and make them applicable to other bubble plume conditions, dimensional analysis was con-ducted. Using the Buckingham’s Pi theorem and assuming that the forces due to viscosity, surface tension, and compressibility are negligible compared to the forces due to momentum and
buoyancy, under fully turbulent flow conditions in a shallow water tank, the radial distributions ofdb,ub, andafor a specific
height above the nozzle can be described by the following rela-tion
冋
db L,ub
U,aL
册
=f冋
rL,F
册
共4兲where L= length scale defined byL=共Qa2/g兲1/5; and U= velocity scale defined by U=Qa/L2. The third parameter F= densimetric
Froude number defined byF=Ue/
冑
deg共w−a兲/w, in whichwand a= water and air density, respectively, and Ue and de
= equivalent velocity and diameter for each nozzle, respectively. Since our experiments were conducted for nozzles ranging from single/multiple orifices to a porous airstone, it was not possible to estimate values ofUeandde共i.e.,F兲for each nozzle in order to
collapse all the experimental data in one single curve. Therefore, we neglectedFand obtained the following dimensionless corre-lations by adjusting straight lines to the radial distributions ofdb
anduband a Gaussian curve to the radial distribution ofa, the
variation corresponding approximately to the upper and lower limits obtained with different nozzles
db
L =共0.75 ± 33 %兲− 0.35
冉
rL
冊
共5兲ub
U =共2.70 ± 11 %兲− 0.13
冉
rL
冊
共6兲aL=共0.23 ± 41 %兲e−0.12共r/L兲
共7兲
Fig. 9 shows the adjustment of Eqs. 共5兲–共7兲to experimental data. Not only were good adjustments obtained, but the upper and lower limits represented by dashed lines also clearly show the maximum variation of each parameter with nozzle type共e.g., di-mensionless bubble diameter decreases when using the porous airstone instead of the single orifice nozzle of 3.0 mm兲. This con-firms that F is of secondary importance for our sets of experi-ments.
Surrounding Flow Structure
Similar to void fraction measurements, the liquid velocity time series obtained from PIV measurements also indicated a low-frequency periodic fluctuation about the mean. Fig. 10 shows a typical power spectrum of the horizontal and vertical velocity components,uandv. A line with a slope of −5/3 is also shown to indicate the presence of Kolmogorov’s inertial subrange. A domi-nant frequency of about 0.03 Hz was obtained for the velocity signals near the bubble core. Notice that this frequency was the same obtained from void fraction measurements, which implies that the periodic fluctuation of the velocity signals was caused mainly due to the wandering motion共i.e., bubble core oscillation兲. Because of this nonstationary nature of the flow surrounding the bubble plumes, a digital filtering technique was used to separate the turbulent motions共i.e., high-frequency signals兲from the peri-odic motions 共i.e., low-frequency signals兲. A fixed cutoff fre-quency of 0.2 Hz was used for all the experimental conditions. This frequency was selected to be higher than the dominant fre-quency in the spectrum, as described by García and García共2006兲
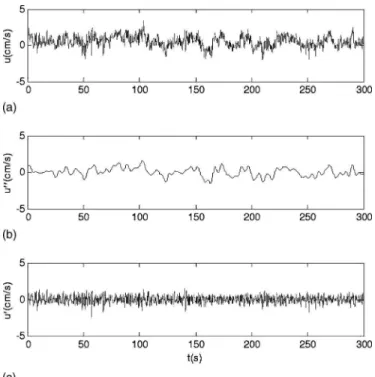
and Lima Neto et al.共2007a兲. Thus, a Butterworth high-pass filter of sixth order was used to eliminate the mean 共u¯ and ¯兲v and low-frequency periodic共u⬙andv⬙兲velocity fluctuations from the original velocity signal and estimate the turbulent 共
high-Fig. 8. Average radial values of:共a兲 bubble mean Sauter diameter;
frequency兲 velocity fluctuations u⬘ and v⬘, where u=¯u+u⬘+u⬙ andv=¯v+v⬘+v⬙. An example of this velocity decomposition is shown in Fig. 11. Although the periodic velocity fluctuations were significant, our discussion will focus on the axial distributions of mean/turbulent velocity components near the bubble core, which are important for estimation of the entrainment rate and kinetic energy of the mean/turbulent flow.
A typical time-averaged flow field is shown in Fig. 12. It can be seen that the mean horizontal velocity component,¯u, decreases with axial distance from the nozzle while the vertical velocity component,¯v, increases until the flow approaches the surface jet region. The initial thickness of the surface jet obtained here was
of about 12 cm for all experiments, which is consistent with the thickness of about 1/6 of water depth obtained by Fanneløp et al. 共1991兲and Riess and Fanneløp 共1998兲for the flow around line-source bubble plumes. Therefore, the cumulative volumetric en-trainment rate,Qw, was estimated by integrating the product of¯u 共measured at r= 10.8 cm兲 by the surface area of a cylinder of radiusrc= 10.8 cm surrounding the bubble core fromz1= 4.5 cm toz2= 59 cm, where¯u becomes approximately zero and the bor-der of the surface jet region is reached
Fig. 9.Adjustment of Eqs.共5兲–共7兲to experimental data, with dashed lines indicating approximately maximum variation of each parameter with nozzle type
Fig. 10.Power spectrums of horizontal and vertical velocity compo-nents 共Guand Gv兲measured at r= 10.8 cm andz= 43 cm indicating
dominant frequency共0.03 Hz兲and presence of inertial subrange共line with slope of −5/3兲 共nozzle type: 9⫻1.0 mm,Qa= 33.3 cm3/s兲
Fig. 11.Velocity decomposition:共a兲original velocity signalu mea-sured at r= 10.8 cm and z= 43 cm; 共b兲 periodic velocity component
u⬙; 共c兲 turbulent velocity component u⬘ 共nozzle type: 9⫻1.0 mm,
Qw共z兲=
冕
z1z u
¯共z兲2rcdz 共8兲
The kinetic energy of the mean flow 共MKE兲 and turbulent kinetic energy 共TKE兲 were calculated 共for measurements at r
= 10.8 cm兲using the following equations
MKE =12关共¯u兲2+共v¯兲2兴 共9兲
TKE =12关共u⬘兲2+共v
⬘兲2+共w
⬘兲2兴 共10兲
Because swirl motion was avoided during the measurements, we assumed that the third mean velocity componentw¯ was equal to zero in Eq.共9兲. We also assumed that the third turbulent veloc-ity componentw⬘was equal tov⬘in Eq.共10兲. This assumption is supported by measurements of turbulent stresses. Fig. 13 shows typical axial distributions of the turbulent horizontal normal stresses, vertical normal stresses, and shear stresses. It can be seen that the horizontal normal stresses are slightly higher than the vertical normal stresses and that the shear stresses are very small, which implies that the turbulent flow field is nearly isotropic. Therefore, the assumption of共w⬘兲2=共v
⬘兲2 is reasonable. The in-crease in magnitude of the stresses with air flow rate and height is in agreement with the measurements of turbulent kinetic energy, dissipation, and eddy diffusivity obtained, respectively, by García and García 共2006兲, Soga and Rehmann 共2004兲, and Wain and Rehmann 共2005兲 for the flow field surrounding a large-scale bubble plume. Iguchi et al.共1989, 1992兲found that the magnitude of the turbulent fluctuations at the bubble core centerline in-creases with air flow rate but dein-creases with height in a confined bubble plume setup.
Typical axial distributions of the cumulative entrainment rate and kinetic energy of the mean flow and turbulent kinetic energy are shown in Fig. 14. It can be seen that the variation ofQwwith
height is well described by a straight line. Notice that this straight line applies for the region above approximately 10 cm from the nozzle exit, where the bubbles are expected to reach their terminal slip velocity, the flow becomes fully established, and the cumula-tive entrainment rate increases linearly with height 共see Leitch and Baines 1989兲. The variations of MKE and TKE with height are well described by a polynomial curve and an exponential curve, respectively, but the discrepancy between the measure-ments of TKE and the exponential curve increases as the flow approaches the surface jet region.
It is important to compare the water flow rate Qw obtained
from the PIV measurements共Fig. 14兲with that from the velocity measurements 关Fig. 7共b兲兴. The values ofQwat 43 cm above the
nozzles were obtained by integration of the mean vertical veloci-ties关see Fig. 7共b兲兴, assuming a linear decay of centerline velocity up to aboutr= 9 cm, where the vertical velocity becomes approxi-mately zero. Overall the values ofQwobtained with direct
veloc-ity measurement within the plume were approximately 10% larger than those measured with PIV. Note that we added 500 cm3/s to the values ofQw measured with PIV to account for the fact that
these measurements were taken fromz1= 4.5 cm above the nozzle exit关see Fig. 14共a兲兴. Some discrepancy between these techniques was expected because the measurements with the anemometer were taken when the bubble plumes were in a straight vertical position while the measurements with PIV were averaged over 5 min, which also included the effects of wandering motion. The cumulative entrainment rates obtained here were about 30% higher than those obtained by Iguchi et al.共1991兲in a confined bubble plume setup for similar air flow rates and orifice diam-eters.
The total entrainment rates and the depth-averaged values of kinetic energy of the mean flow and turbulent kinetic energy for each experimental condition are summarized in Fig. 15. It can be seen that the use of the airstone increases the entrainment rate by about 60% and the kinetic energy of the mean flow and turbulent kinetic energy by about 60 and 80%, respectively, when com-pared to the use of the multiple orifice nozzle of 4⫻1.5 mm. The results for the multiple orifice nozzle of 9⫻1.0 mm are compa-rable to those for the airstone, which confirms the suitability of its use for systems susceptible to rapid clogging of porous nozzles. Although the single orifice nozzle of 0.6 mm induced lower en-trainment rates than the multiple orifice nozzle of 9⫻1.0 mm, it
Fig. 12.Time-averaged flow field indicating velocity scale of 3 cm/s 共nozzle type: 9⫻1.0 mm,Qa= 33.3 cm3/s兲
Fig. 13.Typical axial variation of turbulent stresses measured at r
presented higher kinetic energy of the mean/turbulent flow than all the other nonporous nozzles because of the high momentum added to the flow due to the high-velocity jet. These results differ from those of Iguchi et al.共1989, 1992兲, who found that the mean velocity and the magnitude of the turbulent fluctuations at the bubble core centerline were independent of single orifice diameter in a confined bubble plume setup.
Similarly to the analysis for bubble characteristics, dimen-sional analysis gives the following relation to describe the axial variations ofQw, MKE, and TKE for a specific distance from the
bubble core
冋
Qw Qa,共MKE兲 0.5
U ,
共TKE兲0.5 U
册
=f冋
z
L,F
册
共11兲Again, we neglectedFand obtained the following
dimension-less correlations by adjusting a straight line, a polynomial curve, and an exponential curve to the axial variations ofQw, MKE, and
TKE, respectively, the variation corresponding approximately to the upper and lower limits obtained with different nozzles
Qw Qa
= 3 +共1.15 ± 26 %兲
冉
zL
冊
共12兲共MKE兲0.5
U = − 5x10 −5
冉
zL
冊
2+ 0.0031
冉
zL
冊
+共0.03 ± 45 %兲 共13兲共TKE兲0.5
U =共0.014 ± 40 %兲e 0.013共z/L兲
共14兲
Fig. 16 shows a reasonably good correlation of Eqs.共12兲–共14兲
to experimental data. The upper and lower limits represented by
Fig. 14.Typical axial variation of:共a兲cumulative entrainment rate;
共b兲 kinetic energy of mean flow; and 共c兲 turbulent kinetic energy
共nozzle type: 9⫻1.0 mm, Qa= 33.3 cm3/s兲. Measurements shown were taken atr= 10.8 cm.
dashed lines clearly show the maximum variation of each param-eter with nozzle type 共e.g., dimensionless entrainment rate in-creases when using the porous airstone instead of the multiple orifice nozzle of 4⫻1.5 mm兲. The results also confirm that the effects ofFare relatively small for our experimental conditions.
Applications
The above results can be used to compare the aeration potential of air injection with different nozzles in shallow wastewater tanks and rivers. An example would be the use of mean bubble diameter and interfacial area to estimate the volumetric mass transfer co-efficient 共KLa兲 for each nozzle. Table 1 presents estimations of
this coefficient considering the correlation given by Wüest et al.
共1992兲and McGinnis and Little共2002兲forKLas a function of the
mean bubble diameter. The values of KLa ranged from 8.65 h−1 for the single orifice nozzle of 3.0 mm to 19.16 h−1for the porous airstone, and are within the range from 0.12 h−1for coarse bubble diffusers to 40.15 h−1for very fine bubble diffusers obtained by Schierholz et al.共2006兲. This suggests that the nozzles evaluated in this study behaved similarly to their fine bubble diffusers. Note that even higher values ofKLaare expected in rivers because of enhanced turbulence and bubble breakup processes due to the effect of crossflow. Since the KLa values due to bursting of
bubbles at the water surface obtained by Schierholz et al. for fine bubble diffusers decreased from about 45 to 5% of those due to bubble plume aeration as the air flow rate decreased, we expect a contribution even smaller than 5% in our tests because our flow rates were much smaller.
The correlations obtained here can be applied to predict bubble characteristics and surrounding flow structure in aeration/mixing systems for air flow rates and nozzles similar to those tested in this study. An example of this application would be a bubble plume in a wastewater tank of 4 m diameter and 1.8 m depth where a circulation flow of about 30, 000 cm3/s is desired to prevent suspended solids deposition and formation of an anaero-bic layer at the bottom. Thus, considering an initial surface jet thickness of about 30 cm共i.e., 1/6 of water depth, as mentioned above兲, the correlation given by Eq.共12兲predicts an air flow rate
Qa of 415 cm3/s to attain such a requirement. In this case, we
could use a circular nozzle of 90 orifices of 1.0 mm diameter with similar flow rate per orifice as the nozzle of 9⫻1.0 mm tested here. Notice that this assumption is not expected to be valid for much higher flow rates per orifice because continuous bubble jets are formed and the flow pattern changes significantly, as the su-personic flow studies conducted by Kobus共1968兲. Similar analy-sis can be applied for the porous airstone, but the flow rate per unit area of the stone should be considered instead of the flow rate per orifice.
It is also important to note that, in real wastewater treatment plants, the presence of suspended solids may affect the movement and morphology of the bubbles. Although little is known about the effect of suspended solids and other impurities on bubble swarms, studies on isolated bubbles show that it results in de-creased bubble slip velocities due to inde-creased drag forces. The curve given by Clift et al. 共1978兲shows that the difference be-tween bubble slip velocity in pure and contaminated water sys-tems varies by about 30% for the range of bubble equivalent diameters of 3 – 12 mm obtained in our study. In this case, we expect that decreases in bubble slip velocity will decrease the turbulence levels and the induced liquid volume flux by generat-ing wakes behind the bubbles with lower velocities 共see Leitch and Baines 1989兲. On the other hand, we expect a counterbalanc-ing effect of increased turbulence due to particle-particle and particle-bubble interactions. Therefore, in wastewater treatment systems, we believe that our correlation for liquid volume flux would give reasonably accurate results with an error of less than about 30% due to the presence of suspended solids in the water. This study also provides information such as bubble size dis-tribution and entrainment rate for initial conditions in integral bubble plume models共see Wüest et al. 1992兲and turbulent flow structure for evaluation and validation of computational fluid dy-namics models for more detailed analysis of bubble plume sys-tems共see Buscalia et al. 2002兲. Besides information on surface jet thickness and flow rate can be applied to estimate surface aeration due to turbulent diffusion共see Chu and Jirka 2003兲.
Summary and Conclusions
An experimental study on air injection in a relatively large water tank was performed to investigate the effect of nozzle type, in-cluding single/multiple orifice nozzles and a porous airstone, on the characteristics of the bubbles and the surrounding liquid flow structure. The results revealed that radial distributions of bubble size and velocity were well described by a straight line, while the specific interfacial area followed a Gaussian curve. Bubble slip velocity was found to be higher than the terminal bubble velocity obtained from the literature for isolated bubbles. The water veloc-ity within the bubble plume was found to decrease linearly from the center of the plume to close to zero at the edge of the plume. The variation of cumulative liquid entrainment rate with height was well described by a straight line, while the variations of ki-netic energy of the mean flow and turbulent kiki-netic energy near the bubble core were well described by a polynomial curve and an exponential curve, respectively.
Although bubble velocity did not change significantly, bubble mean Sauter diameter could be decreased by about 50% while air-water specific interfacial area could be increased by about 90% by using the porous airstone instead of a single orifice nozzle of 3.0 mm diameter. The use of the airstone could also increase the liquid entrainment rate by about 60% and the kinetic energy of the mean and turbulent flow near the bubble core by about 60 and 80%, respectively. The results for a nozzle with nine orifices of 1.0 mm diameter are comparable to those for the airstone, which suggests the suitability of nozzles with multiple orifices of small diameter for systems susceptible to clogging of porous nozzles such as wastewater treatment tanks and natural water bodies with a high concentration of suspended solids and/or or-ganic matter.
Dimensionless correlations using length and velocity scales based on the air flow rates described well the radial variations of the bubble properties and the axial variations of the entrainment rate and kinetic energy of the mean flow and turbulent kinetic energy near the bubble core, and are suggested here for design purposes of artificial aeration/mixing systems. Finally, applica-tions of the results such as estimation of the volumetric mass transfer coefficient and entrainment rate for different artificial aeration/mixing systems are presented.
Acknowledgments
The first writer is supported by the Coordination for the Improve-ment of Higher Education Personnel Foundation共CAPES兲, Min-istry of Education, Brazil. The writers are grateful to Perry Fedun and Chris Krath for building the experimental apparatus.
Notation
The following symbols are used in this paper: a ⫽ air-water specific interfacial area共m−1兲; C ⫽ dissolved oxygen共DO兲concentration in water
共mg/L兲;
Cs ⫽ saturation DO concentration in water共mg/L兲; db ⫽ bubble mean Sauter diameter共mm兲;
fb ⫽ bubble frequency共Hz兲;
L ⫽ length scale defined byL=共Qa2/g兲1/5共cm兲; MKE ⫽ kinetic energy of the mean flow共cm2/s2兲;
Qa ⫽ volumetric air flow rate共cm3/s兲;
Qw ⫽ volumetric entrainment rate共cm3/s兲; r ⫽ radial distance from plume centerline共cm兲; TKE ⫽ turbulent kinetic energy共cm2/s2兲;
U ⫽ velocity scale defined byU=Qa/L2共cm/s兲; ub ⫽ bubble velocity共m/s兲;
u⬘u⬘ ⫽ horizontal normal stress due to turbulent fluctuations共cm2/s2兲;
u
¯,¯v ⫽ time-averaged horizontal and vertical velocity component共cm/s兲;
u⬘v⬘ ⫽ shear stress due to turbulent fluctuations 共cm2/s2兲;
u⬘,v⬘ ⫽ turbulent horizontal and vertical velocity fluctuation共cm/s兲;
u⬙,v⬙ ⫽ periodic horizontal and vertical velocity fluctuation共cm/s兲;
v⬘v⬘ ⫽ vertical normal stress due to turbulent fluctuations 共cm2/s2兲;
z ⫽ axial distance from the nozzle exit共cm兲; and
␣ ⫽ air concentration or void fraction共%兲.
References
ASCE.共2007兲. “Measurement of oxygen transfer in clean water.”ASCE/ EWRI 2-06, Reston, Va.
Barnhart, E. L. 共1969兲. “Transfer of oxygen in aqueous solutions.” J. Sanit. Engrg. Div., 95共3兲, 645–661.
Boes, R. M., and Hager, W. H.共2003兲. “Two-phase flow characteristics of stepped spillways.”J. Hydraul. Eng., 129共9兲, 661–670.
Boyer, C., Duquenne, A. M., and Wild, G.共2002兲. “Measuring techniques in gas-liquid and gas-liquid-solid reactors.”Chem. Eng. Sci., 57共16兲, 3185–3215.
Brücker, C., and Schröder, W.共2004兲“PIV-study on bubble interaction and wakes in multiphase flows.” Bubbly flows-Analysis, modelling and calculation, M. Sommerfeld, ed., Springer, Berlin.
Buscalia, G. C., Bombardelli, F. A., and García, M. H.共2002兲. “Numeri-cal modeling of large-s“Numeri-cale bubble plumes accounting for mass trans-fer effects.”Int. J. Multiphase Flow, 28共11兲, 1763–1785.
Chang, K. A., Lim, H. J., and Su, C. B.共2003兲. “Fiber optic reflectometer for velocity and fraction ratio measurements in multiphase flows.”
Rev. Sci. Instrum., 74共7兲, 3559–3565.
Chanson, H.共1997兲“Measuring air-water interface area in supercritical open channel flow.”Water Res., 31共6兲, 1414–1420.
Chaumat, H., Billet-Duquenne, A. M., Augier, F., Mathieu, C., and Del-mas, H.共2005兲. “Application of the double optic probe technique to distorted tumbling bubbles in aqueous or organic liquid.”Chem. Eng. Sci., 60共22兲, 6134–6145.
Chu, C. R., and Jirka, G. H. 共2003兲. “Wind and stream flow induced reaeration.”J. Environ. Eng., 129共12兲, 1129–1136.
Clift, R., Grace, J. R., and Weber, M. E. 共1978兲. Bubbles, drops and particles, Academic, New York.
DeMoyer, C. D., Schierholz, E. L., Gulliver, J. S., and Wilhelms, S. C. 共2003兲. “Impact of bubble and free surface oxygen transfer on dif-fused aeration systems.”Water Res., 37共8兲, 1890–1904.
Eckenfelder, W. W. 共1959兲. “Absorption of oxygen from air bubbles in water.”J. Sanit. Engrg. Div., 85共4兲, 89–99.
Fanneløp, T. K., Hirschberg, S., and Küffer, J.共1991兲. “Surface current and recirculating cells generated by bubble curtains and jets.”J. Fluid Mech., 229, 629–657.
Friedl, M. J., and Fanneløp, T. K. 共2000兲. “Bubble plumes and their interaction with the water surface.”Appl. Ocean. Res., 22共2兲, 119– 128.
García, C. M., and García, M. H.共2006兲. “Characterization of flow tur-bulence in large-scale bubble-plume experiments.” Exp. Fluids,
41共1兲, 91–101.
characteristics in the buoyancy region of a vertical bubbling jet.”ISIJ Int., 32, 747–754.
Iguchi, M., Takeuchi, H., and Morita, Z.共1991兲. “The flow field in air-water vertical bubbling jets in a cylindrical vessel.” ISIJ Int., 31, 246–253.
Iguchi, M., Tani, J., Uemura, T., Kawabata, H., Takeuchi, H., and Morita, Z.共1989兲. “The characteristics of water and bubbling jets in a cylin-drical vessel with bottom blowing.”ISIJ Int., 29, 309–317. Kiambi, S. L., Duquenne, A. M., Dupont, J. B., Colin, C., Risso, F., and
Delmas, H.共2003兲. “Measurements of bubble characteristics: Com-parison between double optical probe and imaging.”Can. J. Chem. Eng., 81共3–4兲, 764–770.
Kiger, K. T., and Pan, C.共2000兲. “PIV technique for the simultaneous measurement of dilute two-phase flows.”J. Fluids Eng., 122共4兲, 811– 818.
Kobus, H.共1968兲. “The motion of bubbles in liquids.”Characteristics of self-aerated free-surface flows, Water and waste water—Current re-search and practice, L. Rao and H. Kobus, eds., Vol. 10, Erich Schim-idt Verlag, Berlin.
Leitch, A. M., and Baines, W. D.共1989兲. “Liquid volume flux in a weak bubble plume.”J. Fluid Mech., 205, 77–98.
Lima Neto, I. E., Zhu, D. Z., and Rajaratnam, N.共2007a兲. “Effect of tank size and geometry on the flow induced by circular bubble plumes and water jets.”J. Hydraul. Eng.in press.
Lima Neto, I. E., Zhu, D. Z., Rajaratnam, N., Yu, T., Spafford, M., and McEachern, P.共2007b兲. “Dissolved oxygen downstream of an effluent outfall in an ice-covered river: Natural and artificial aeration.”J. En-viron. Eng., 133共11兲, 1051–1060.
McCord, S. A., Schladow, S. G., and Miller, T. G. 共2000兲. “Modeling artificial aeration kinetics in ice-covered lakes.” J. Environ. Eng.,
126共1兲, 21–31.
McGinnins, D. F., and Little, J. C.共2002兲. “Predicting diffused-bubble oxygen transfer rate using the discrete-bubble model.” Water Res.,
36共18兲, 4627–4635.
McGinnis, D. F., Lorke, A., Wüest, A., Stockli, A., and Little, J. C. 共2004兲. “Interaction between a bubble plume and the near field in a stratified lake.”Water Resour. Res., 40共10兲, W10206.
McWhirter, J. R., and Hutter, J. C.共1989兲. “Improved oxygen mass trans-fer modeling for diffused/subsurface aeration systems.” AIChE J.,
35共9兲, 1527–1534.
Motarjemi, M., and Jameson, G. J. 共1978兲. “Mass transfer from very small bubbles—The optimum bubble size for aeration.”Chem. Eng. Sci., 33共11兲, 1415–1423.
Mueller, J. A., Boyle, W. C., and Pöpel, H. J.共2002兲.Aeration: Principles and practice, CRC, New York.
Murzyn, F., Mouaze, D., and Chaplin, J. R.共2005兲. “Optical fibre probe measurements of bubbly flow in hydraulic jumps.”Int. J. Multiphase Flow, 31共1兲, 141–154.
Rensen, J., and Roig, V. 共2001兲. “Experimental study of the unsteady structure of a confined bubble plume.”Int. J. Multiphase Flow, 27共8兲, 1431–1449.
Riess, I. R., and Fanneløp, T. K.共1998兲. “Recirculation flow generated by line-source bubble plumes.”J. Hydraul. Eng., 124共9兲, 932–940. Rosso, D., and Stenstrom, M. K. 共2006兲. “Surfactant effects on
alpha-factors in aeration systems.”Water Res., 40共7兲, 1397–1404. Ruzicka, M. C.共2000兲. “On bubbles rising in line.”Int. J. Multiphase
Flow, 26共7兲, 1141–1181.
Sahoo, G. B., and Luketina, D.共2006兲. “Response of a tropical reservoir to bubbler destratification.”J. Environ. Eng., 132共7兲, 736–746. Schierholz, E. L., Gulliver, J. S., Wilhelms, S. C., and Henneman, H. E.
共2006兲. “Gas transfer from air diffusers.”Water Res., 40共5兲, 1018– 1026.
Soga, C. L. M., and Rehmann, C. R. 共2004兲. “Dissipation of turbulent kinetic energy near a bubble plume.”J. Hydraul. Eng., 130共5兲, 441– 449.
Swan, C., and Moros, A.共1993兲. “The hydrodynamics of a subsea blow-out.”Appl. Ocean. Res., 15共2兲, 269–280.
Toombes, L., and Chanson, H. 共2005兲. “Air-water mass transfer on a stepped waterway.”J. Environ. Eng., 131共10兲, 1377–1386.
Wain, D. J., and Rehmann, C. R.共2005兲. “Eddy diffusivity near bubble plumes.”Water Resour. Res., 41共9兲, W09409.
Water Pollution Control Federation共WPCF兲.共1988兲.Aeration—Manual of practice, No. FD-13, Alexandria, Va.