www.atmos-chem-phys.net/9/1723/2009/ © Author(s) 2009. This work is distributed under the Creative Commons Attribution 3.0 License.
Chemistry
and Physics
Tropospheric ozone climatology at two Southern Hemisphere
tropical/subtropical sites, (Reunion Island and Irene, South Africa)
from ozonesondes, LIDAR, and in situ aircraft measurements
G. Clain1, J. L. Baray1,2, R. Delmas1, R. Diab3, J. Leclair de Bellevue4, P. Keckhut4,5, F. Posny1, J. M. Metzger1, and J. P. Cammas6
1Laboratoire de L’Atmosph`ere et des Cyclones (LACy), UMR-CNRS 8105, 15, av. Ren´e Cassin, BP 7151,
97715 St-Denis Cedex 9, La R´eunion, France
2Institut Pierre-Simon Laplace (IPSL), Univ. Versailles Saint Quentin, 5 Boulevard d’Alembert, 78280 Guyancourt, France 3School of environmental science, University of KwaZulu-Natal, Durban, South Africa
4Service d’A´eronomie (SA), UMR-CNRS 7620 Univ. Pierre et Marie Curie, 4 place Jussieu, 75252 Paris Cedex 05, France 5Service d’A´eronomie (SA), UMR-CNRS 7620 Verri`eres le Buisson, 91371, France
6Laboratoire d’A´erologie (LA), UMR-CNRS 5560 14, av. Edouard Belin, 31400 Toulouse, France
Received: 12 March 2008 – Published in Atmos. Chem. Phys. Discuss.: 9 June 2008 Revised: 23 January 2009 – Accepted: 23 January 2009 – Published: 6 March 2009
Abstract. This paper presents a climatology and trends of tropospheric ozone in the Southwestern Indian Ocean (Re-union Island) and South Africa (Irene and Johannesburg). This study is based on a multi-instrumental dataset: PTU-O3
ozonesondes, DIAL LIDAR and MOZAIC airborne instru-mentation.
The seasonal profiles of tropospheric ozone at Reunion Island have been calculated from two different data sets: ozonesondes and LIDAR. The two climatological profiles are similar, except in austral summer when the LIDAR profiles show greater values in the free troposphere, and in the up-per troposphere when the LIDAR profiles show lower values during all seasons. These results show that the climatological value of LIDAR profiles must be discussed with care since LIDAR measurements can be performed only under clear sky conditions, and the upper limit of the profile depends on the signal strength.
In addition, linear trends have been calculated from ozonesonde data at Reunion and Irene. Considering the whole tropospheric column, the trend is slightly positive for Reunion, and more clearly positive for Irene. Trend calcula-tions have also been made separating the troposphere into
Correspondence to:G. Clain (gaelle.clain@univ-reunion.fr)
three layers, and separating the dataset into seasons. Re-sults show that the positive trend for Irene is governed by the lower layer that is affected by industrial pollution and biomass burning. On the contrary, for Reunion Island, the strongest trends are observed in the upper troposphere, and in winter when stratosphere-troposphere exchange is more frequently expected.
1 Introduction
Ozone is a major greenhouse gas (Lacis et al., 1990), and tropospheric oxidant (Martin et al., 2003). Understanding the climatological characteristics of tropospheric ozone pro-duction and fluxes in subtropical regions is important for assessing ozone’s direct effect on climate (Watson et al., 2001; Pachauri and Reisinger, 2007) and its role in atmo-spheric chemistry on both regional and global scales. The tropospheric ozone budget is influenced by transport from the stratosphere and in situ photochemical production asso-ciated with ozone precursors emitted by anthropogenic activ-ity, biomass burning and lightning (Stevenson et al., 2006).
Reunion island (20.8◦S, 55.5◦E) is located near the south-ern limit of the tropics, in the Indian Ocean, 1000 km east of Madagascar. For this region, the dynamical mechanisms influencing tropospheric ozone distribution have been docu-mented, including intrusions of stratospheric air masses via tropopause folds (Baray et al., 1998), Rossby wave breaking (Postel and Hitchman, 1999) and mid latitude cut off lows (Baray et al, 2003). A study of the effect of tropical convec-tion on tropospheric ozone has also been reported (Leclair de Bellevue et al.,2006) and showed some differences between the two sites, Reunion and Irene. In addition, photochemi-cal sources have been identified: biomass burning activity in Southern Africa and Madagascar during austral spring asso-ciated with long range transport of air masses are a cause of tropospheric ozone increase over Reunion Island (Baldy et al., 1996; Taupin et al., 2002). At this site, the influence of biomass burning activity has been identified between 5 and 12 km on tropospheric ozone profiles (Randriambelo et al., 2000).
Johannesburg (26.1◦S, 28.0◦E) and Irene (25.9◦S, 28.22◦E) are located about 3000 km southwest of Reunion, closer to ozone precursor sources. From a dynamical per-spective, the site of Irene is less affected by tropical convec-tion but more affected by the subtropical jet stream activity than Reunion.
A tropical ozone climatology has been established by Thompson et al. (2003) using SHADOZ network data, and Diab et al. (2004) focused their study on Irene and Johan-nesburg sites. Climatologies of stratospheric intrusions have been conducted over the Pacific and Atlantic Oceans by Waugh and Polvani (2000) and at a global scale by James et al. (2003). However, the ozone climatology and the long term trends have not been analyzed using the same approach at two tropical/subtropical sites in the region of Southern Africa and the Western Indian Ocean; this is the objective of the present study.
A wide range of ozone data is available at Reunion and Irene. In addition to ozonesonde profiles, in-situ measure-ments from commercial aircraft (MOZAIC data) and verti-cal ozone profiles from LIDAR will be used. This dataset is presented in Sect. 2. Section 3 focuses on the geophysical context for each site and the regional sources of ozone pre-cursors. In the fourth Section, we 1) examine and compare all datasets in order to ensure the consistency between the var-ious measurement techniques; 2) present the monthly mean ozone distributions and 3) calculate long term ozone trends. In Sect. 5 we discuss the influence of data sampling and bias on LIDAR and ozonesonde ozone values above Reunion, and discuss possible causes of the seasonal ozone variation and long term ozone trends above both sites.
2 Instrumentation and dataset features
2.1 Ozonesondes
An ozonesonde program began in 1992 at Reunion and the dataset now includes 17 years of usable data. At Irene, ozonesondes were regularly launched between July 1990 and October 1993 (Diab et al., 2004). Since 1998, when the two sites joined the SHADOZ program (Thompson et al., 2003), ozonesondes are launched regularly on a weekly basis. At Reunion, profiles are collected regularly each week and the frequency of soundings is less affected by weather considera-tions than by possible technical issues. At Reunion and Irene, the total number of profiles over the 8-year period ranges, respectively, between 13 and 28 profiles per month and be-tween 13 and 20 profiles per month (Fig. 3).
The SHADOZ program aims to provide a consistent dataset of tropospheric and stratospheric ozone in the South-ern Hemisphere. The program originally intended to sup-plement the sparse amount of tropospheric ozone data in the Southern Hemisphere compared to the abundant data in the Northern Hemisphere. The SHADOZ network involves 15 stations, distributed so as to have good coverage across the tropical and subtropical Southern Hemisphere.
The Irene and Reunion stations use ozonesondes equipped with an Electrochemical concentration cell (ECC) for mea-suring ozone and Vaisala RS80 radiosondes for meamea-suring temperature, pressure and humidity. The cathode KI solution is 1% buffered at Irene and 0.5% buffered at Reunion. The vertical extension of profiles range from ground level (24 m at Reunion, 1524 m at Irene) up to burst altitude, which is located between 30 km and 35 km in most cases. Smit et al. (2007) evaluate ECC-sonde precision to be better than
±(3–5)% and accuracy about±(5–10)% below 30 km
alti-tude. Further details about ozonesonde precision and accu-racy can be found in Smit et al. (2007), who compared the performances of SPC-6A and ENSCI-Z ozonesondes. Since 2007, horizontal wind measurements have been made at Re-union by GPS, simultaneously with ozone and PTU measure-ments.
In this article, the climatological study (Figs. 4, 5) focuses on 8 common years of data (1998–2006, Table 1) for the two sites. With a considerable number of profiles (Table 1), the ozone climatology benefits from a greater regularity in the ozonesonde time distribution during this period. The trend section uses the whole dataset for the two sites in order to examine the longest possible time period.
2.2 LIDAR
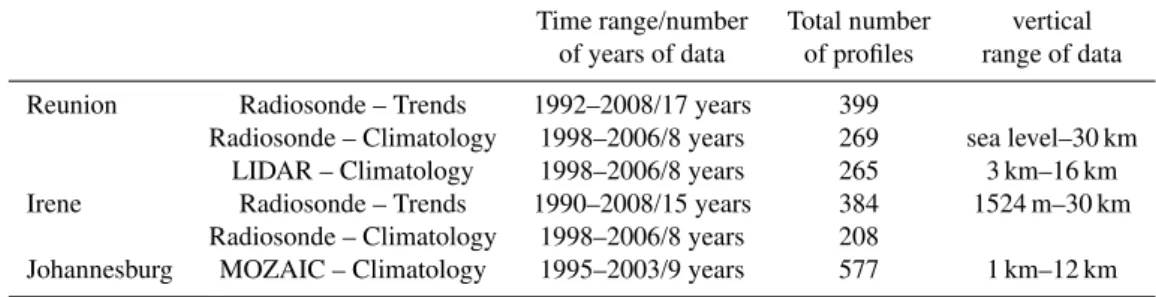
Table 1.Features of the dataset: period of measurements, total number of ozone profiles and altitude range used for climatology and trend studies in Sect. 4.
Time range/number Total number vertical of years of data of profiles range of data
Reunion Radiosonde – Trends 1992–2008/17 years 399
Radiosonde – Climatology 1998–2006/8 years 269 sea level–30 km LIDAR – Climatology 1998–2006/8 years 265 3 km–16 km Irene Radiosonde – Trends 1990–2008/15 years 384 1524 m–30 km
Radiosonde – Climatology 1998–2006/8 years 208
Johannesburg MOZAIC – Climatology 1995–2003/9 years 577 1 km–12 km
high pressure deuterium cell. LIDAR profiles are taken sev-eral times a week with a 150 m vertical resolution between 3 km and the tropical tropopause height of 17 km. The limits of the vertical domain for each profile are closely related to the atmospheric conditions. Details on the DIAL ozone LI-DAR at Reunion are given in Baray et al. (1999) and on all the instrumentation of OPAR (Observatoire de Physique de l’Atmosph`ere de la Reunion) in Baray et al. (2006).
2.3 MOZAIC
The MOZAIC program (Measurement of Ozone and Water Vapour by Airbus In-Service Aircraft) was launched in 1994 by European scientists, Airbus and several commercial air-lines in order to collect ozone water vapour, carbon monox-ide and total odd nitrogen (NOy) data to validate global
chemistry transport models (Marenco et al., 1998; Thouret et al., 1998). The program uses equipment installed aboard long haul Airbus A340 aircraft flying from Europe, and the data have recently been used to derive an ozone climatology of the upper troposphere (9–12 km) (Thouret et al., 2006). The accuracy of the ozone measurements is evaluated at
±2 ppbv±2% (Marenco et al., 1998; Thouret et al., 2006).
The MOZAIC data used in this paper include 577 flights to and from Johannesburg between July 1995 and January 2003. The monthly distribution is given in Fig. 3.
MOZAIC and LIDAR datasets contain a great number of profiles, 577 and 265 profiles, respectively (Fig. 3, Table 1), but the profiles are sporadically distributed in time compared to the SHADOZ data.
3 Geophysical context and regional sources of ozone precursors
3.1 Reunion Island 3.1.1 Dynamical context
Reunion is located in the subsidence region of the South-ern Hemisphere Hadley cell. The island meteorology is sub-ject to subtropical, tropical and temperate influences of the
general circulation. The South Indian Ocean anticyclone, and perturbations carried in the westerlies affect the island (Randriambelo et al., 2003). The influence of the subtropi-cal jet stream on the island is at a maximum during winter. In Fig. 2a mean zonal wind profiles derived from one year of GPS sonde data between August 2007 and March 2008 at Reunion are presented. A maximum is observed during aus-tral winter. This maximum is consistent with the vicinity of the subtropical jet at this time of year (Fig. 2b). For more details about the dynamical context of the region, Preston-Whyte and Tyson (1988) have documented the circulation patterns in South Africa and the adjacent Atlantic and Indian Oceans.
Ozone increases due to stratospheric intrusions have been detected in South Africa and over the Indian Ocean. These intrusions take place in association with meteorological dis-turbances such as tropopause folds induced by the subtrop-ical jet stream, cut off lows, tropsubtrop-ical cyclones (Baray et al., 1998, 1999, 2003), westerly waves and frontal zones. Ac-cording to James et al.’s climatology (2003) stratospheric in-trusions in the southern subtropical region maximise during austral winter.
3.1.2 Regional sources
Fig. 1. Schematic representation of meteorological processes af-fecting tropospheric ozone over subequatorial Africa (Diab et al., 2004). Industrial, biomass burning, and biogenic sources of ozone precursors are also shown. The locations of Johannesburg, Irene, and Reunion are represented by “J”,“I”, and “R”, respectively.
Southern Africa and the South Atlantic and Indian Oceans (Randriambelo et al., 1999). Aghedo et al. (2007) recently determined that 70% of the tropospheric ozone produced by African emissions is exported outside the continent. Meteo-rological analysis based on trajectory statistics showed that a large part of African emissions might be advected to the Indian Ocean (Garstang et al., 1996; Piketh et al., 2002). Mechanisms responsible for regional dispersion of biomass burning emissions have been documented (Baldy et al., 1996; Taupin et al., 1999, 2002). A climatology by Randriambelo et al. (1999) based on ozonesonde and satellite data focuses on the relative importance of the different mechanisms. 3.2 Irene
3.2.1 Dynamical context
The atmospheric circulation at Irene (25.9◦S, 28.22◦E) is dominated by the subtropical anticyclone within which sub-sidence and recirculation cause the accumulation of pollu-tants on large temporal and spatial scales (Garstang et al., 1996; Tyson et al., 1996; Piketh et al., 2002). As a con-sequence, a 5 km deep haze layer forms over South Africa, capped by a persistent subsidence inversion (Cosijn and Tyson, 1996). The frequency of this anticyclonic circulation is higher during winter (79% in June, July) than during sum-mer (11% in December) (Tyson and Preston-Whyte, 2000). The system is disrupted when a mid-latitude westerly wave crosses the south of South Africa. As a result trace gases including ozone precursors and aerosols circulate inside the stable layer until they are finally released eastward as a gi-ant plume centred at 31◦S along the east coast (Tyson et al., 1996).
Fig. 2. (a)Zonal wind speed between August 2007 and September 2008 at Reunion from GPS sonde data. (b) Mean austral winter wind fields at 300 hPa derived from NCEP data (1984–2004).
Fig. 3.Cumulative monthly distribution of profiles for each type of data.
3.2.2 Regional Sources
In addition to stratospheric sources, ozone in the region sur-rounding Irene is produced photochemically from biomass burning, biogenic and anthropogenic emissions as well as lightning NOxemissions (Aghedo et al., 2007). The
emis-sion of VOCs significantly influences atmospheric chem-istry because of their high reactivity and result in the for-mation (or destruction) of tropospheric ozone in high (or low) NOxconditions (Aghedo et al., 2007). Volatile Organic
Compounds (VOCs) are also naturally emitted by vegetation (Kesselmeier and Staudt, 1999).
Fig. 4. Seasonal ozone profiles and standard deviation (ppbv) be-tween 3 and 15 km derived from ozonesonde data (blue lines) and from LIDAR data (red lines) at Reunion during(a)spring (SON)(b)
summer (DJF)(c)autumn (MAM) and(d)winter (JJA). The num-ber of profiles used for each DIAL LIDAR climatological profile is given on the right in green.
During summer, the tropical easterlies from the Indian Ocean cause moist air to be advected over Irene. Strong con-vective activity is a daily phenomenon and can promote rapid vertical uplift of surface pollutants, which leads to an ozone enhancement in the mid- to upper troposphere (Ziemke et al., 2009). Lightning from these convective storms can also be responsible for an increase in tropospheric ozone via ozone production from lightning NOx emissions (Schumann and
Huntrieser, 2007). Collier et al. (2006) state that South Africa and Madagascar lightning activity maximise during austral spring and summer.
Anthropogenic emissions of ozone precursors are an im-portant factor in the ozone budget. Irene is located close to two urban-industrial areas: Pretoria and Johannesburg. The station is also 100 km downwind from the main power gen-erating area of South Africa, with 11 large coal-fired power plants (Diab et al., 2004). Domestic use of biofuels also con-tributes to ozone precursors. The GEIA inventory (Benkovitz et al., 1996) evaluates South Africa’s NOxemissions as 1.8%
of global anthropogenic emissions, and according to Wells et al. (1996) and Held and Mphepya (2000), 91% of the South African NOxemissions originate from industry.
Fig. 5.Monthly distribution of the mean tropospheric ozone mixing ratio (0–130 ppbv) between 3 and 16 km altitude for different sites and different types of data.(a)LIDAR Reunion,(b)SHADOZ Re-union,(c)MOZAIC Johannesburg,(d)SHADOZ Irene.
4 Climatology and trends: results
4.1 Comparison of LIDAR and sonde climatological ozone profiles at Reunion
The mean seasonal vertical distribution of ozone and stan-dard deviations at Reunion (Fig. 4) have been derived from LIDAR data (red lines) and from ozonesonde data (blue lines). Panels (a) to (d) depict austral spring, summer, au-tumn and winter seasons, respectively. Seasonal profiles de-rived from the two datasets have similar values between 3 km and 11 km for winter and spring, and in autumn the greatest agreement is between 3 and 13 km. LIDAR seasonal files show lower ozone mixing ratios than ozonesonde pro-files above 11 km for spring and winter, and above 13 km for autumn and summer. This difference which appears in the climatology is not found during simultaneous measurements (Baray et al., 1999).
In summer, ozonesonde and LIDAR measurements are consistent in the lower troposphere below 5 km. Above 13 km, in summer (and all seasons) the LIDAR climatology yields smaller values than the ozonesonde profiles. Between 5 km and 13 km in summer, the LIDAR profile shows higher values than the sounding profile. The maximum difference between the two profiles in this altitude range is 13 ppbv at 9.5 km.
4.2 Ozone monthly mean distribution
Table 2.Trend values calculated at Reunion and Irene, in DU by decade and the equivalent in percentage per decade, for total tropospheric columns, for the lower (2–4 km), middle (2–4 km) and upper troposphere (10–16 km) and for each season. The lower limitLis 1 km for Reunion Island and 2 km for Irene. The data time range is mentioned after the site name. Non statistically significant trends are in italic.
Altitude Reunion 1992–2008 Irene 1990–2008 Irene 1998–2008 range (km), Slope Slope Slope Slope Slope Slope
Season (DU/decade) (%/decade) (DU/decade) (%/decade) (DU/decade) (%/decade)
L-16 1.94±1.81 5.67±5.28 1.81±0.97 5.21±2.78 2.47±3.01 6.93±8.44 2–4 0.01±0.37 0.12±6.91 0.93±0.26 14.37±4.01 2.08±0.86 30.45±12.52 4–10 0.70±0.93 4.37±5.81 0.63±0.52 3.99±3.31 1.11±1.56 6.91±9.67 10–16 1.31±0.62 12.34±5.82 0.24±0.44 1.92±3.51 −0.61±1.45 −4.82±11.43 L-16, DJF 1.38±3.12 4.55±10.32 2.41±1.95 7.16±5.79 1.60±6.13 4.61±17.62
2–4, DJF −0.40±0.65 −9.34±15.20 1.31±0.57 20.53±9.03 2.04±1.83 29.48±26.46 4–10, DJF 0.45±1.66 3.15±11.76 0.99±1.17 6.22±7.39 0.16±3.65 0.96±22.33 10–16, DJF 1.58±1.32 16.07±13.43 0.25±0.63 2.19±5.49 −0.25±1.96 −2.14±16.86 L-16, MAM 0.20±2.47 0.69±8.57 0.43±1.10 1.46±3.70 1.22±3.37 4.08±11.25
2–4, MAM −0.18±0.45 −4.00±10.13 0.71±0.31 12.99±5.67 2.12±1.24 36.38±21.17 4–10, MAM 0.38±1.32 2.84±9.93 −0.11±0.68 −0.85±5.14 −1.16±2.115 −8.71±15.88 10–16, MAM 0.38±0.93 4.12±10.15 −0.14±0.61 −1.25±5.58 0.54±2.14 5.02±19.80
L-16, JJA 4.14±3.70 11.95±10.67 3.12±1.74 9.18±3.70 14.98±13.77 5.50±4.82 2–4, JJA 0.12±0.88 2.10±15.69 0.69±0.52 11.51±5.67 1.98±1.63 31.55±25.92 4–10, JJA 2.00±1.97 12.34±12.17 1.70±0.88 11.39±5.14 4.40±2.17 28.26±13.95 10–16, JJA 1.86±0.97 18.30±9.51 0.73±1.08 5.57±5.58 −1.08±3.40 −7.99±25.11 L-16, SON 2.69±2.47 6.18±5.69 2.70±1.66 6.55±4.02 5.50±4.82 12.99±11.39 2–4, SON 0.40±0.50 5.71±7.21 1.17±0.49 14.96±6.22 2.39±1.49 28.89±18.08 4–10, SON 0.45±1.30 2.20±6.34 0.77±0.96 4.04±5.04 2.70±2.69 13.98±13.95 10–16, SON 1.58±1.10 11.84±8.25 0.76±0.84 5.33±5.85 0.41±2.81 2.80±19.06
depict LIDAR data, SHADOZ data from Reunion, MOZAIC data from Johannesburg, and SHADOZ data from Irene re-spectively. The lower altitude limit of 3 km is imposed by the LIDAR data; and 16 km is below the tropopause height: Sivakumar et al. (2006) located the mean altitudes of the lapse rate tropopause and the cold point tropopause respectively at 17 km and 16 km of altitude at Reunion from 13 years of ozonesonde data.
Each data type shows a springtime maximum. The great-est values are found in the SHADOZ data (Panels b, d), and Irene data shows values greater than 90 ppbv above 10 km. MOZAIC and LIDAR data also exhibit a springtime peak but the ozone mixing ratios are seldom above 80 ppbv in the lower and mid-troposphere above Johannesburg.
The LIDAR ozone mixing ratio at Reunion (Panel a) shows greater values in January than the mixing ratio derived from SHADOZ data. Specifically LIDAR data display ozone values varying between 80 and 90 ppbv between 9 and 12 km. For the same altitude, the SHADOZ ozone mixing ratio has values between 50 and 70 ppbv. This result is consistent with summer seasonal profiles shown in the previous section.
Upper tropospheric ozone mixing ratios at Irene are greater than at Reunion. During winter, the ozonopause is lower at Irene, with the 100 ppbv ozone contour about 1– 2 km lower above Irene than Reunion.
During summer, values above 70 ppbv are found at Irene at 10 km altitude and above. At Reunion, such values are not recorded below an altitude of 11 km. The MOZAIC and SHADOZ plots for South Africa show an ozone enhance-ment in the mid-troposphere where values exceed 60 ppbv up to the end of summer (January–February).
4.3 Long-term Tropospheric ozone behaviour at Reunion Island and Irene based on linear trend calculations In this section, we examine the linear trends of the com-plete ozone datasets of Reunion Island and Irene which cover the periods 1992–2008 and 1990–2008 respectively, with a gap of data for Irene between 1994 and 1998. Hence the trends for Irene have been calculated for both the 1990–2008 and the 1998–2008 datasets, however in this paper we focus mainly on the longest time period. We also calculated ozone trends for different tropospheric layers above the two mea-surement sites (Table 2).
To examine the linear trend, the following equation is used:
Ozone=τ t+β (1)
Fig. 6.Ozone trends for the tropospheric layer between 1 and 16 km at Reunion(a)and between 2 and 16 km at Irene(b). The dashed line shows the trend at Irene calculated from the 1998–2008 dataset.
confidence interval. This error gives a statistical estimation of the influence of the variability of ozone data on the esti-mation of the linear trend (Montgomery et al., 2006). Ozone trends have been calculated in atmospheric layers in DU per decade (1 DU=2.69×10¹⁶molec/cm2)and in % per decade (Table 2).
Ozone trends calculated at Reunion and Irene are pre-sented in Fig. 6. The lower limit of the tropospheric column is 1 km at Reunion, and 2 km at Irene, because of the differ-ent altitudes of the two sites. The upper limit has been fixed at 16 km, below the tropical tropopause height (Sivakumar et al., 2006). Considering the whole column, the tropospheric trend is positive (1.94±1.81 DU/decade) for Reunion, and for Irene (1.81±0.97 DU/decade).
In order to examine the potential influence of the two main sources of ozone in the region, viz. anthropogenic and biomass burning pollution of the lower layers and stratosphere-troposphere exchange, the troposphere has been separated into three layers: one below 4 km, the altitude where the trade wind inversion occurs (Taupin et al., 1999), and the free troposphere which is separated into two equal parts: the mid-troposphere between 4 and 10 km and the up-per troposphere between 10 and 16 km.
Some differences between the two sites appear (Fig. 7, Ta-ble 2):
– The trend for the lower layer at Irene is clearly positive (0.93±0.26 DU/decade), while at Reunion no trend is observed.
– The trend for the mid-troposphere at Irene is pos-itive (0.63±0.52 DU/decade) but less than the layer
below. The weaker trend (0.24±0.44 DU/decade)
observed in the upper troposphere is not signifi-cant. For Reunion, the trend behaviour is oppo-site: the mid-troposphere trend is positive but not statistically significant (0.70±0.93 DU/decade). The
stronger trend is observed in the upper troposphere (1.31±0.62 DU/decade).
Fig. 7.Ozone trends between 2 and 4 km at Reunion(a)and Irene
(b), between 4 and 10 km at Reunion(c)and Irene(d), and between 10 and 16 km at Reunion(e)and Irene(f). The dashed lines show trends at Irene calculated from the 1998–2008 dataset.
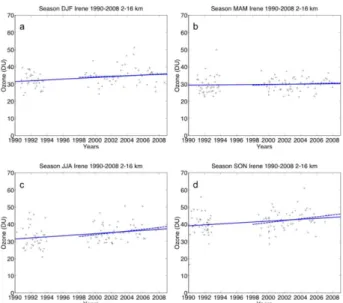
To investigate further the influence of the stratospheric and photochemical mechanisms, seasonal trends are presented in Fig. 8 for Reunion and Fig. 9 for Irene. Table 2 shows the seasonal trends for each tropospheric layer at the two sites.
The total tropospheric column shows no significant trend for the two sites during the March-April-May (MAM) sea-son.
For Reunion, the most positive trends have been observed in September-October-November (SON) (2.69±2.47 DU/decade) and maximise in
June-July-August (JJA) (4.14±3.70 DU/decade). The stronger trend
during SON is located in the upper troposphere and during JJA, in the mid and upper troposphere.
In contrast, for Irene, the trend is strong in SON (2.70±1.66 DU/decade), and also in December-January-February (DJF) (2.41±1.95 DU/decade), both with higher values in the lower troposphere, and in JJA (3.12±1.74 DU/decade) the trend maximise between 4 km
Fig. 8.Ozone trends for the tropospheric layer between 1 and 16 km at Reunion in December-January-February(a), March-April-May
(b), June-July-August(c), et September-October-November(d).
5 Discussion
5.1 Comparison of ozone DIAL and sonde climatological profiles at Reunion
Figure 4 shows that apart from the summer case, the sea-sonal profiles of tropospheric ozone derived from LIDAR and ozonesonde data are in agreement between 3 km and 11 km to 13 km according to the season. Within this range of altitude, LIDAR and ozonesonde data have the same cli-matological value for austral spring, autumn and winter.
LIDAR profiles show for all seasons lower ozone mixing ratio than the ozonesonde profiles in the upper troposphere. Because of the absorption of the LIDAR beam by ozone molecules, when the LIDAR signal is weakened in the up-per part of the profiles, the vertical limits of LIDAR ozone profiles are often below an altitude where high ozone mixing ratios are found. Therefore, the number of profiles used to build the climatological values are fewer in the upper tropo-sphere and profiles with high ozone mixing ratio in the upper troposphere are small in number in the LIDAR dataset. Con-trary to the LIDAR technique, the measurement of ozone by ozonesondes is not affected by the amount of ozone. This gives rise to some differences in the upper tropospheric cli-matology. The upper tropospheric DIAL ozone climatology is not representative of the true ozone climatology, despite individual DIAL profiles extending through the whole tropo-sphere being available.
Finally, we observe that the LIDAR summer profile shows more ozone than the ozonesonde summer profile between 5 km and 13 km. The difference observed is compara-ble to the difference between the two ozone climatological
Fig. 9.Same as Fig. 8 but between 2 and 16 km at Irene. The dashed lines show trends at Irene calculated from the 1998–2008 dataset.
profiles obtained in the presence and absence of tropical convection (Fig. 4 of Leclair de Bellevue et al., 2006). While ozonesonde measurements can be performed in broad weather conditions, LIDAR measurements can be performed only during nights and with clear sky conditions. Moreover, summer corresponds to the rainy season at Reunion and con-vection exerts a complex role on ozone formation and its ver-tical distribution. Uplift of ozone poor air masses into the tro-posphere in convective systems results in low values of ozone in the upper troposphere, while deep convection in the vicin-ity of STE processes along the subtropical jet stream can be associated with ozone enhancement in the mid-troposphere (Leclair de Bellevue et al., 2006).
5.2 Monthly mean distributions
Figure 5 shows evidence of a lower ozonopause at Irene during austral winter. Irene is located at 25.9◦S, a more southerly latitude than Reunion (21.0◦S), and consequently experiences a greater influence from the subtropical jet stream during winter than Reunion (Fig. 2). In addition, ac-cording to James et al. (2003) the stratospheric intrusions maximise at 30◦S in the Southern Hemisphere during aus-tral winter. Therefore, the lower position of the ozonopause at Irene is consistent with a strong influence of stratospheric intrusions during winter in South Africa.
production in south Africa maximises during summer. The quick redistribution of surface pollutants and lightning NOx
production can be responsible for a mid- and upper tropo-spheric ozone enhancement.
Considering the South African data for January, the ozone enhancement (above 60 ppbv) in the mid-troposphere ap-pears to be a continuation of the enhanced mid-tropospheric ozone observed since October. This broad mid-tropospheric ozone enhancement may be due to the transition from a strong stratospheric influence in spring to a photochemical influence in summer. According to Diab (2004) Irene is lo-cated in an active urban industrial region. Domestic emis-sions during summer coupled with convection might explain this phenomenon.
5.3 Ozone trends
At Reunion, layers below 4 km are not directly influenced by biomass burning and stratosphere-troposphere exchange because of the easterly trade wind regime. These layers are only impacted by local sources and transport across the In-dian Ocean. At Irene, local sources of pollution and biomass burning can both occur. For the two sites, the two layers 4– 10 km and 10–16 km can be directly influenced by biomass burning and stratosphere-troposphere exchange.
Irene has a positive trend for the lower layer but this is not the case at Reunion (Table 2). Under the hypothesis of an increase of biomass burning and pollution in South Africa, a positive trend of ozone over South Africa is consistent be-cause of a persistent synoptic recirculation which occurs over South Africa (Preston-Whyte and Tyson, 1988). However, the increase in pollution and biomass burning activity since the 1990s needs to be confirmed by further investigation. On the contrary, lower layers over Reunion are less directly in-fluenced by biomass burning because of the easterly trade wind regime (Baldy et al., 1996).
Regarding the three tropospheric layers, we observe that the trend at Irene decreases with altitude, suggesting that the tropospheric trend at Irene is mainly governed by the lower layers of the troposphere, and specifically by a change in biomass burning and pollution influences.
At Reunion, the strongest trend occurs between 10 km and 16 km. The reason for this positive trend for the upper layer is an interesting issue and we draw two hypotheses: first, the influence of the increase of biomass burning and pol-lution can play a role: the trend values in the upper tropo-sphere at Reunion could be related to the complex dynamical mechanisms which are necessary for Reunion Island tropo-spheric ozone to be influenced by biomass burning: injection of pollutants in the free troposphere by convection, mix-then-cook scheme and ozone production during westerly transport (Chatfield and Delany, 1990; Baldy et al., 1996). The sec-ond hypothesis is an increase in stratosphere-troposphere ex-change which could be induced by climate ex-change.
For the studied sites, it has been established that:
– The influence of biomass burning is at a maximum in SON season (Baldy etal., 1996; Randriambelo et al., 2000).
– The influence of stratosphere-troposphere exchange in-duced by the subtropical jet stream is at a maximum in JJA, because of the location of the jet stream close to the latitude of Reunion (Baray et al., 1998; Randriambelo et al., 2000).
– For Reunion, deep convection along the edge of the sub-tropical jet where stratosphere to troposphere exchange occurs is at a maximum in DJF (Leclair de Bellevue et al., 2006).
– The MAM season could be representative of background ozone levels, since the influences of stratosphere-troposphere exchange and biomass burning are weak.
Taking these considerations into account, the total column seasonal trends (Figs. 8, 9) are discussed.
– The two sites effectively show weak and non significant trends for MAM.
– For Reunion, trends maximise in JJA. This suggests that stratosphere-troposphere exchange is the most impor-tant influence as it is the most active ozone source dur-ing this season.
6 Conclusions
In this study we have presented the climatology of tropo-spheric ozone in the south-western part of the Indian Ocean (Reunion Island) and South Africa (Irene, Johannesburg), and the tropospheric ozone trends. The comparison of the seasonal profiles of tropospheric ozone of Reunion Island obtained from ozonesondes and LIDAR showed that the two climatological profiles are generally in good agreement, ex-cept in austral summer with higher values for the LIDAR profiles in the free troposphere, and lower values in the up-per troposphere for all the seasons. Because of the nature of LIDAR retrievals (measurements performed only under clear sky conditions, and an upper limit depending on the signal strength) the LIDAR profile is not representative of the true ozone climatology in the whole troposphere.
Linear trends have been calculated from ozonesonde data at Reunion and Irene. Considering the whole tropospheric column, the trend is positive for the two sites. The trend calculations have been repeated, stratifying the troposphere into three columns, and separating the dataset into seasons. The increase in tropospheric ozone observed over Irene oc-curs mainly in the lower layers, similar to observations of Oltmans et al. (2006) over other sites of the Southern Hemi-sphere. It could be associated with an increase in pollution and biomass burning. Our study outlines some differences between Irene and Reunion Island, which has a positive trend in the upper troposphere but not in the lower troposphere, and a stronger trend in winter when stratosphere-troposphere ex-change peaks.
Clearly, measurements of other trace gases and detailed modelling studies are required to determine the origin of ozone above these two sites. Our short term intention is to study the temporal and vertical distribution of anomalies in the tropospheric ozone column over Irene and Reunion. In order to discern the influence of different sources, the cli-matology and trends of tropospheric ozone, as well as CO measurements and the convective transport index from the MOPITT satellite (Deeter et al., 2003) will be analysed. The long term perspective is to provide a complete quantification of all the sources influencing the tropospheric ozone budget in the region using a Lagrangian approach and to compare the results with those obtained from a global chemical trans-port model.
Acknowledgements. The authors thank the French regional,
na-tional (INSU, CNRS) and internana-tional (NASA/GFSC) organi-sations for supporting the OPAR (Observatoire de Physique de l’Atmosph`ere de la R´eunion) station. The regional administration provides funding to G. Clain for her PhD.
We thank the SHADOZ network for the ozonesonde data, in par-ticular G. J. R. Coetzee, Principal Investigator at Irene. We also thank G´erard Ancellet who initiated the tropospheric LIDAR mea-surements at Reunion. Yann Courcoux, St´ephane Richard and Patrick Hernandez now in charge of LIDAR data also receive our gratitude.
We acknowledge MOZAIC Principal Investigators, Val´erie Thouret and Philippe N´ed´elec for providing the ozone data, as well as the airlines (Lufthansa, Air France and Austria) who carry free of charge the MOZAIC instrumentation and perform the maintenance since 1994.
Finally, we thank the editor Owen Cooper and the two anonymous referees for their constructive remarks which helped us to improve this manuscript.
Edited by: O. Cooper
References
Aghedo, A. M., Schultz, M. G., and Rast, S.: The influence of African air pollution on regional and global tropospheric ozone, Atmos. Chem. Phys., 7, 1193–1212, 2007,
http://www.atmos-chem-phys.net/7/1193/2007/.
Andreae, M. O., Fishman, J., and Lindesay, J.: The Southern Trop-ical Atlantic Experiment (STARE): Transport and Atmospheric Chemistry near the Equator-Atlantic (TRACE A) and Southern African Fire-Atmosphere Research Initiative (SAFARI): An in-troduction, J. Geophys. Res., 101, 23519–23520, 1996. Baldy, S., Ancellet, G., Bessafi, M., Badr, A., and Lan Sun Luk,
D.: Field observations of the vertical distribution of tropospheric ozone at the island of Reunion (southern tropics), J. Geophys. Res., 101(D19), 23835–23850, 1996.
Baray, J. L., Ancellet, G., Taupin, F. G., Bessafi, M., Baldy, S., and Keckhut, P.: Subtropical tropopause break as a possible strato-spheric source of ozone in the tropical troposphere, J. Atmos. Sol.-Terr. Phy., 60(1), 27–36, 1998.
Baray J. L., Ancellet, G., Randriambelo, T., and Baldy, S.: Trop-ical cyclone Marlene and stratosphere-troposphere exchange, J. Geophys. Res., 104(D11), 13953–13970, 1999.
Baray, J. L., Leveau, J., Porteneuve, J., Ancellet, G., Keckhut, P., Posny, F., and Baldy, S.: Description and evaluation of a tropo-spheric ozone LIDAR implemented on an existing LIDAR in the southern subtropics, Appl. Optics, 38(33), 6808–6817, 1999. Baray, J. L., Baldy, S., Diab, R. D., and Cammas, J. P.:
Dynam-ical study of a tropDynam-ical cut-off low over South Africa, and its impact on tropospheric ozone, Atmos. Environ., 37(11), 1475– 1488, 2003.
Baray, J. L., Leveau, J., Baldy, S., Jouzel, J., Keckhut, P., Berga-metti, G., Ancellet, G., Bencherif, H., Cadet, B., Carleer, M., David, C., De Mazi`ere, M., Faduilhe, D., Godin Beekmann, S., Goloub, P., Goutail, F., Metzger, J. M., Morel, B., Pommereau, J. P., Porteneuve, J., Portafaix, T., Posny, F., Robert, L., and Van Roozendael, M.: An instrumented station for the survey of ozone and climate change in the southern tropics: Scientific motivation, technical description and future plans, J. Environ. Monitor., 8, 1020–1028, doi:10.1039/b607762e, 2006.
Benkovitz, C. M., Scholtz, M. T., Pacyna, J., Tarrason, L., Dignon, J., Voldner, E. C., Spiro, P. A., Logan, J. A., and Graedel, T. E.: Global gridded inventories of anthropogenic emissions of sulfur and nitrogen, J. Geophys. Res., 101, 29239–29254, 1996. Chatfield, R. B. and Delany, A. C.: Convection links biomass
Collier, A. B., Hughes, A. R. W., Lichtenberger, J., and Steinbach, P.:Seasonal and diurnal variation of lightning activity over south-ern Africa and correlation with European whistler observations, Ann. Geophys., 24, 529–542, 2006,
http://www.ann-geophys.net/24/529/2006/.
Cosijn, C. and Tyson, P. D.: Stable discontinuities in the atmosphere over South Africa, S. Afr. J. Sci., 92, 381–386, 1996.
Deeter, M. N., Emmons, L. K., Francis, G. L., Edwards, D. P., Gille, J. C., Warner, J. X., Khattatov, B., Ziskin, D., Lamarque, J.-F., Ho, S.-P., Yuding, V., Attie, J.-L., Packman, D., Chen, J., Mao, D., and Drummond, J. R.: Operational carbon moNOxide retrieval algorithm and selected results for
the MOPITT instrument, J. Geophys. Res., 108(D14), 4399, doi:10.1029/2002JD003186, 2003.
Diab, R. D., Thompson, A. M., Mari, K., Ramsay, L., and Coet-zee, G. J. R.: Tropospheric ozone climatology over Irene, South Africa, From 1990 to 1994 and 1998 to 2002, J. Geophys. Res., 109, D20301, doi:10.1029/2004JD004793, 2004.
Garstang, M., Tyson, P. D., Swap, R., Edwards, M., Kalleberg, P., and Lindsay, J. A.: Horizontal and vertical transport of air over Southern Africa, J. Geophys. Res., 101, 23721–23736, 1996. Gettelman, A., Birner, T., Eyring, V., Akiyoshi, H., Plummer, D.
A., Dameris, M., Bekki, S., Lef´evre, F., Lott, F., Br¨uhl, C., Shi-bata, K., Rozanov, E., Mancini, E., Pitari, G., Struthers, H., Tian, W., and Kinnison, D. E.: The Tropical Tropopause Layer 1960– 2100, Atmos. Chem. Phys. Discuss., 8, 1367–1413, 2008, http://www.atmos-chem-phys-discuss.net/8/1367/2008/. Held, G. and Mphepya, J.: Wet and dry deposition in South
Africa, Proceedings, XI Congresso Brasiliero de Meteorologia (CDROM), SBMET, Rio de Janeiro, 16–20 Outubro 2000, Paper QA00002, 2824–2833, 2000.
James, P., Stohl, A., Forster, C., Eckhardt, S., Seibert, P., and Frank, A.: A15-year climatology of stratosphere-troposphere exchange with a Lagrangian particle dispersion model: 1. Methodology and validation, J. Geophys. Res., 108(D12), 8519, doi:10.1029/2002JD002637, 2003.
Kesselmeier, J. and Staudt, M.: Biogenic volatile organic com-pounds (VOC): An overview on emission, physiology and ecol-ogy, J. Atmos. Chem., 33, 23–88, 1999.
Lacis, A. A., Wuebbles, D. J., and Logan, J. A.: Radiative Forcing of Climate by Changes in the Vertical Distribution of Ozone, J. Geophys. Res., 95(D7), 9971–9981, 1990.
Leclair De Bellevue, J., R´echou, A., Baray, J. L., Ancellet, G., and Diab, R. D.: Signatures of stratosphere to troposphere, transport near deep convective events in the southern subtropics, J. Geo-phys. Res., 111, D24107, doi:10.1029/2005JD006947, 2006. Lu, H.-C. and Chang T.-S.: Meteorologically adjusted trends of
daily maximum ozone concentrations in Taipei, Taiwan, Atmos. Environ., 39, 6491–6501, 2005.
Marenco, A., Medale, J. C., and Prieur, S.: Study of tropospheric ozone in the tropical belt (Africa, America) from STRATOZ and TROPOZ campaigns, Atmos. Environ. 11, 2823–2834, 1990. Marenco, A., Thouret, V., N´ed´elec, P., Smit, H. G., Helten, M.,
Kley, D., Karcher, F., Simon, P., Law, K., Pyle, J., Poshmann, G., Von Wrede, R., Hume, C., and Cook, T.: Measurement of ozone and water vapor by Airbus in service aircraft: The MOZAIC air-borne programme, an overview, J. Geophys. Res., 103, 25631– 25642, 1998.
Martin, R. V., Jacob, D. J. , Yantosca, R. M., Chin, M., and Ginoux,
P.: Global and regional decreases in tropospheric oxidants from photochemical effects of aerosols, J. Geophys. Res., 108(D3), 4097, doi:10.1029/2002JD002622, 2003.
Montgomery, D. C., Peck, E. A., and Geoffrey Vining, G.: Intro-duction to Linear Regression Analysis, ISBN:978-0-471-75495-4, 4th edition, 640 pp., August 2006.
Oltmans, S. J., Lefohn, A. S., Harrisa, J. M., Galbally, I., Scheel, H. E., Bodeker, G., Brunke, E., Claude, H., Tarasick, D., John-son, B. J., Simmonds, P., Shadwick, D., Anlauf, K., Hayden, K., Schmidlil, F., Fujimoto, T., Akagi, K., Meyer, C., Nichol, S., Davies, J., Redondas, A., and Cuevas, E.: Long-term changes in tropospheric ozone, Atmos. Environ., 40, 3156–3173, 2006. Pachauri, R. K, Reisinger, A., Albritton, D. L., Barker, T.,
Bash-makov, I. A., Canziani, O., Christ, R., Cubasch, U., Davidson, O., Gitay, H., Griggs, D., Halsnaes, K., Houghton, J., House, J., Kundzewicz, Z., Lal, M., Leary, N., Magadza, C., McCarthy, J. J., Mitchell, J. F. B., Moreira, J. R., Munasinghe, M., Noble, I., Pachauri, R., Pittock, B., Prather, M., Richels, R. G., Robinson, J. B., Sathaye, J., Schneider, S., Scholes, R., Stocker, T., Sun-dararaman, N., Swart, R., Taniguchi, T., and Zhou, D.: IPCC, 2007: Climate Change 2007: Synthesis Report, Contribution of Working Groups I, II and III to the Fourth Assessment Report of the Intergovernmental Panel on Climate Change, IPCC, Geneva, Switzerland, 104 pp., 2007.
Piketh, S. J., Swap, R. J., Maenhaut, W., Annegarn, H. J., and Formenti, P.: Chemical evidence of long range atmospheric transport over south Africa, J. Geophys. Res., 107(D24), 4817, doi:10.1029/2002JD002056, 2002.
Postel, G. A. and Hitchman, M. H.: A climatology of Rossby wave breaking along the subtropical tropopause, J. Atmos. Sci., 56, 359–373, 1999.
Preston-Whyte, R. A. and Tyson, P. D.: The atmosphere and weather of Southern Africa, Oxford university press Cape Town, South Africa, 1988.
Randriambelo, T., Baray, J. L., Baldy, S., Bremaud, P., and Caut-enet, S.: A case study of extreme tropospheric ozone contamina-tion in the tropics using in-situ, satellite and meteorological data, J. Geophys. Res, 26, N(9), 1287–1290, 1999.
Randriambelo, T., Baray, J. L., and Baldy, S.: The effect of biomass burning, convective venting and transport on tropospheric ozone over the Indian Ocean: Reunion island field observations, J. Geo-phys. Res, 105(D9), 11813–11832, 2000.
Randriambelo, T., Baray, J. L., Baldy, S., Thompson, A. M., Olt-mans, S., and Keckhut, P.: Investigation of the short-time vari-ability of tropical tropospheric ozone, Ann. Geophys., 21(9), 2095–2106, 2003.
Sivakumar, V., Baray, J. L., Baldy, S., and Bencherif, H.: Tropopause characteristics over a southern subtropical site, Re-union Island (21◦S, 55◦E): Using radiosonde-ozonesonde data, J. Geophys. Res., 111, D19111, doi:10.1029/2005JD006430, 2006.
Schumann, U. and Huntrieser, H.: The global lightning-induced ni-trogen oxides source, Atmos. Chem. Phys., 7, 3823–3907, 2007, http://www.atmos-chem-phys.net/7/3823/2007/.
Stevenson, D. S, Dentener, F. J., Schultz, M. G., Ellingsen, K., van Noije, T. P. C., Wild, O., Zeng, G., Amann, M., Ather-ton, C. S., Bell, N., Bergmann, D. J., Bey, I., Butler, T., Co-fala, J., Collins, W. J., Derwent, R. G., Doherty, R. M., Drevet, J., Eskes, H. J., Fiore, A. M., Gauss, M., Hauglustaine, D. A., Horowitz, L. W., Isaksen, I. S. A., Krol, M. C., Lamarque, J.-F., Lawrence, M. G., Montanaro, V., M¨uller, J.-J.-F., Pitari, G., Prather, M. J., Pyle, J. A., Rast, S., Rodriguez, J. M., Sander-son, M. G., Savage, N. H., Shindell, D. T., Strahan, S. E., Sudo, K., and Szopa, S.: Multimodel ensemble simulations of present-day and near-future tropospheric ozone, J. Geophys. Res., 111, D08301, doi:10.1029/2005JD006338, 2006.
Swap, R. J., Annegarn, H. J., Suttles, J. T., King, M. D., Plat-nick, S., Privette, J. L., and Scholes, R. J.: Africa burning: A thematic analysis of the Southern African Regional Science Initiative (SAFARI 2000), J. Geophys. Res., 108(D13), 8465, doi:10.1029/2003JD003747, 2003.
Taupin, F. G., Bessafi, M., Baldy, S., and Bremaud, P. J.: Tropo-spheric ozone above the southwestern Indian Ocean is strongly linked to dynamical conditions prevailing in the tropics, J. Geo-phys. Res., 104(D7), 8057–8066, 1999.
Taupin, F. G., Beekmann, S., Br´emaud, P. J., and Randriambelo, T.: Ozone generation over the Indian Ocean during the South African biomass-burning period: case study of October 1992, Annales Geophysicae, 20, 547–557, 2002.
Thompson, A. M., Witte, J. C., McPeters, R. D., Oltmans, S. J., Schmidlin, F. J., Logan, J. A., Fujiwara, M., Kirchhoff, V. W. J. H., Posny, F., Coetzee, G. J. R., Hoegger, B., Kawakami, S., Ogawa, T., Johnson, B. J., V¨omel, H., and Labow, G.: South-ern Hemisphere ADditional Ozonesondes (SHADOZ) 1998– 2000 tropical ozone climatology, 1. Comparison with TOMS and ground-based measurements, J. Geophys. Res., 108, 8238, doi:10.129/2001JD000967, 2003.
Thompson, A. M., Witte, J. C., Oltmans, S. J., Schmidlin, F. J., Logan, J. A., Fujiwara, M., Kirchhoff, V. W. J. H., Posny, F., Coetzee, G. J. R., Hoegger, B., Kawakami, S., Ogawa, T., For-tuin, J. P. F., and Kelder, H. M.: Southern Hemisphere ADdi-tional Ozonesondes (SHADOZ) 1998–2000 tropical ozone cli-matology, 2. Tropospheric Variability and the Zonal Wave-One, J. Geophys. Res., 108, 8241, doi:10.129/2002JD002241, 2003.
Thouret, V., Marenco, A., Logan, J., N´ed´elec, P., and Grouhel, C.: Comparisons of ozone measurements from the MOZAIC air-borne program and the ozone sounding network at eight loca-tions, J. Geophys. Res., 103, 25695–25720, 1998.
Thouret, V., Cammas, J.-P., Sauvage, B., Athier, G., Zbinden, R., N´ed´elec, P., Simon, P., and Karcher, F.: Tropopause referenced ozone climatology and inter-annual variability (1994–2003) from the MOZAIC programme, Atmos. Chem. Phys., 6, 1033–1051, 2006, http://www.atmos-chem-phys.net/6/1033/2006/.
Tyson, P. D., Garstang, M., and Swap, R.: Large scale recirculation of air over Southern Africa, J. Appl. Meteorol., 35, 2218–2236, 1996.
Tyson, P. D. and Preston-Whyte, R. A.: the weather and Climate of Southern Africa, Oxford Univ. Press, New York, USA, 2000. Watson, R. T., Albritton, D. L., Barker, T., Bashmakov, I. A.,
Canziani, O., Christ, R., Cubasch, U., Davidson, O., Gitay, H., Griggs, D., Halsnaes, K., Houghton, J., House, J., Kundzewicz, Z., Lal, M., Leary, N., Magadza, C., McCarthy, J. J., Mitchell, J. F. B., Moreira, J. R., Munasinghe, M., Noble, I., Pachauri, R., Pittock, B., Prather, M., Richels, R. G., Robinson, J. B., Sathaye, J., Schneider, S., Scholes, R., Stocker, T., Sundararaman, N., Swart, R., Taniguchi, T., and Zhou, D.: IPCC, 2001: Climate Change 2001: Synthesis Report, A Contribution of Working Groups I, II, and III to the Third Assessment Report of the Inte-governmental Panel on Climate Change, IPCC, Cambridge Uni-versity Press, Cambridge, UK, and New York, NY, USA, 398 pp., 2001.
Waugh, D. W. and Polvani, L. M.: Climatology of intrusions into the tropical upper troposphere, Geophys. Res. Lett., 27, 3857– 3860, 2000.
Wells, R., Lloyd, S., and Turner, C.: National air pollution source inventory, in: Air pollution and its impacts on the South African highveld, edited by: Held, G., Gore, B. J., Surridge, A. D., Tosen, G. R., Turner, C. R., and Walmsley, R. D., Environmental Scien-tific Association, Cleveland, USA, 3–9, 1996.