VKMM 007 BY RESPONSE SURFACE METHODOLOGY
Muthu Manikandan1, Vijayaraghavan Kannan1, Blagajana Herzog Velikonja2, Lejla Paši 2*
1
Centre for Advanced Studies in Botany, University of Madras, Guindy Campus, Chennai 600 025, India; 2Department of Biology, Biotechnical Faculty, University of Ljubljana, Ve na pot 111, 1000 Ljubljana, Slovenia.
Submitted: June 04, 2010; Returned to authors for corrections: July 19, 2010; Approved: January 13, 2011.
ABSTRACT
The production of halophilic thermostable protease by Haloferax lucentensis VKMM 007 was optimized
using a statistical approach. In accordance with factorial design, soluble starch, gelatin, KCl and MgSO4
were selected among 27 variables tested. Next, a second-order quadratic model was estimated and optimal
medium concentrations were determined based on quadratic regression equation generated by model. These
were 5.14 g L-1 of KCl, 6.57 g L-1of MgSO4, 9.05 g L -1
of gelatin and 5.27 g L-1of soluble starch in high salts media supplemented with 0.5% (w/v) of beef extract and peptone, respectively. In these optimal conditions,
the obtained protease concentration of 6.80 U mL-1 was in agreement with the predicted protease concentration and was further improved to 7.02 U mL-1 by increasing the concentration of NaCl in the medium to 25% (w/v). An overall 4.0-fold increase in protease production was achieved in the optimized
medium compared to activity obtained in initial medium.
Key words: cultivation media; Haloferax lucentensis; Response surface methodology; optimization;
halophilic protease.
INTRODUCTION
Proteases from halophilic extremophiles retain activity at
conditions of high salt, offer the possibility of cost-reduction
by allowing for production under non-sterile conditions (7) and
are more likely to aid in industrial processes where high salt
concentrations inhibit mesophilic enzymes (11). However, low
growth rates of halophilic extremophiles, in particular
halophilic archaea, often act to hamper all further
biotechnological advances. In a previous study, we studied
protease production in a halophilic euryarchaeon Haloferax
lucentensis VKMM 007 belonging to Halobacteriaceae family.
The purified protease was stable in a wide range of
temperatures (20°C-70°C), NaCl concentrations (0.85 M-5.13
M) and pH (5.0–9.0). Additionally, it remained stable or only
marginally inhibited in the presence of various polar and
non-polar solvents, surfactants and reducing agents (6). However,
the observed protease production (1.78 U mL-1) was low.
Manikandan, M. et al. Protease production by H. lucentensis
As each organism or strain has its own set of conditions
required for maximal enzyme production, extracellular
protease production is under influence of physical growth
factors or growth media composition. In particular, variations
in the C/N ratio, the presence of some easily metabolizable
sugars and the presence of metal ions can influence the amount
of protease produced (5, 13). Growth medium parameters with
significant impact on growth rate and enzyme production can
be selected using statistical evaluation of experimental design.
Furthermore, calculations of the optimal level of each
parameter for a given target can be performed in order to
improve product yield, reduce development time and overall
process costs. To this aim, response surface methodology (9) is
widely used (e.g. 10, 12). Accordingly, the present study
presents a sequential optimization strategy to improve the
production of halophilic, thermotolerant and organic-solvent
tolerant protease produced by Haloferax lucentensis VKMM
007. As a first step, we have used a one-variable-at-a-time
approach to address the most important among the variables
studied. In a second step, we have determined the optimum
levels of significant variables identified through
response-surface methodology. The last step involved experimental
verification of the theoretical solution to validate the quadratic
model.
MATERIALS AND METHODS
The experiments conducted in this study were carried out
in triplicates. All media components were purchased from
Himedia Laboratories, Mumbai, India.
For the optimization of medium components and their
concentration, the cells of Haloferax lucentensis VKMM 007
(GenBank accession number DQ915814) were propagated in
initial medium pH 7.5 containing (g L-1): beef extract 5.0, peptone 5.0, NaCl 18.0, MgCl2 5.14, Na2SO4 4.06, NaHCO3
0.2, H3BO3 0.03, KBr 0.1, KCl 0.69, CaCl2 1.14, SrCl2 0.026,
NaF 0.003, NaSiO3 0.002, FeSO4 0.001. The microorganisms
were grown in 125 ml Erlenmeyer flasks containing 25 ml
growth medium, incubated at 40oC for 48 hours under shaking conditions of 150 rpm in a Thermostatic orbital shaker (Sub
zero Inc, Chennai, India). The flasks were inoculated with 1%
(v/v) of 48-hours-old culture of Haloferax lucentensis VKMM
007 grown in initial growth medium. Upon cultivation, the
cells were harvested by centrifugation (10000 × g, 15 min) and
the cell-free supernatant was used for the enzyme
determination. The quantitative estimation of protease activity
was carried out according to McDonald and Chen (8). One unit
(U) of protease activity was expressed as the amount of
enzyme that liberated 1 µM tyrosine min-1 under assay conditions.
In a factorial experiment, 27 different media components
were screened to select for nutrients that significantly
influenced the growth of model organism. These were
considered as explanatory variables at concentration levels of
0.5% (w/v), 1.0% (w/v) and 1.5% (w/v), respectively. A
response variable, protease activity (U mL-1) of Haloferax lucentensis VKMM 007 cell culture supernatant, was measured
after 48 hours of incubation.
To determine the response pattern and synergy of
variables the full 2k composite design was performed giving 2k
+2k+n0 combinations where k is the number of independent
variables and n0 is the number of replications of the
experiments at centre point. This provided 30 experimental
runs performed with four factors at five coded levels (–2 –1, 0,
+1 and +2) in duplicate, with central points in triplicate to
determine the experimental error (1). The coded and actual
values of the variables are presented in Table 1. The responses
of the input variables were evaluated as a function of protease
production, measured as protease activity obtained after 48
hours of cultivation and coded by Yp (U mL-1). The
relationship of variables was determined by fitting a second
order polynomial equation to data obtained from the 30 runs.
Design-based experimental data were matched according to the
= = + =
+
+
=
4 1 , 4 1 4 1 0 2 j i j i ij i i ii i i ip
x
x
x
x
Y
β
β
β
β
(1)Where Yp is the predicted response (protease activity of
Haloferax lucentensis obtained in growth medium and
measured as the amount of units per ml of culture broth), 0 is a
constant; i, linear terms coefficients; ii, quadratic terms
coefficients and ij, interaction coefficients. The relation
between the coded forms of the input variable and the actual
values of chosen variables is described as Eq. (2).
X
X
X
x
i iδ
0
−
=
i= 1,2.. k (2)Where xi is the coded value and Xi the actual value of an independent variable, X0 is the value of Xi at the center point
and δX is the step change of the variable. The above
calculations were performed using Design Expert 7.0,
(Stat-Ease, Minneapolis, USA).
Table 1. Coded and uncoded values of experimental variables used in the central composite experiment design
Coded levels Independent variables
-2 -1 0 +1 +2
X1, KCl (g L-1) 0.0 2.5 5.0 7.5 10.0
X2, MgSO4 (g L-1) 0.0 3.0 6.0 9.0 12.0
X3, gelatin (g L-1) 0.0 5.0 10.0 15.0 20.0
X4, soluble starch (g L-1) 0.0 2.5 5.0 7.5 10.0
RESULTS AND DISCUSSION
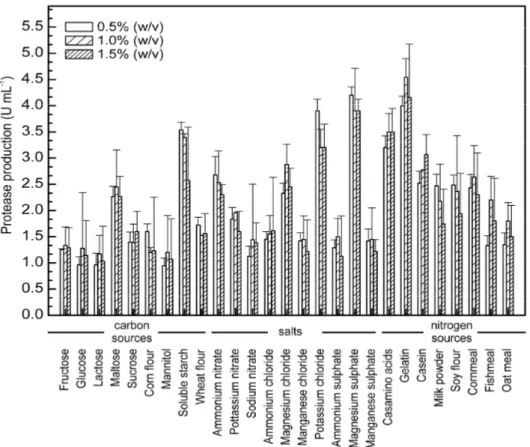
Amongst 27 media components tested, KCl (X1), MgSO4
(X2), gelatin (X3) and soluble starch (X4) showed significant
effect on protease production (Figure 1) and were chosen as
four variables (denominated as X1, X2, X3 and X4) for response
surface methodology based growth medium optimization. The
experimental design and predicted responses for each
combination of the variables are given in Table 2. The maximal
protease production in cell culture of model organism was
noted in experimental runs in which the concentrations of all
four tested variables were at zero concentration level. In these
experiments, the protease concentration levels ranged from 6.2
U mL-1 to 6.8 U mL-1.
Based on above responses, Sequential model sum of
squares (type I), Lack of Fit tests and model summary statistics
a quadratic model was suggested. The ANOVA of the
quadratic regression model demonstrated that the computed F
-value was several times greater of tabulated F-value of 2.34
indicating that the model was significant at a high confidence
level. The significance of the model was also indicated by low
probability P-value (P<0.0001) and the value of the adjusted
determination coefficient (Adj R2=0.887) (3). The 'Lack of Fit F-value' of 2.34 was not significant at all observed limits of
variables for protease production, indicating that the model
thus found fit may significantly describe the variation of the
responses. The value of the determination coefficient
(R2=0.9417) demonstrated that only 5.83% of the total variations were not explained by the model. A lower value of
coefficient of variation (CV=6.91%) showed that the
experiments conducted were precise and reliable (1).
The significance of each coefficient in the model was
established by estimating P-values (Table 3.). The quadratic
effects (X1 2
, X3 2
) of KCl and gelatin had significant effect on
protease production by model organism. These values were
followed in P-values by interactive effect of MgSO4 and
gelatin (X2X3), linear and quadratic effects of MgSO4 (X2, X22)
and interactive effect of KCl and MgSO4 (X1 X2). The
remaining probability values had less significant effect on the
Manikandan, M. et al. Protease production by H. lucentensis
Figure 1. Effects of different nutrient sources and their concentration in culture media on average maximal protease production in cell cultures of
Haloferax lucentensis VKMM 007. Each bar represents the mean ± SD of three replicates.
Table 2. Central composite design and experimental values obtained
X1 X2 X3 X4 Protease production (U mL-1)
STD
order Run order KCl MgSO4 gelatin starch Actual Predicted
1 24 -1 -1 -1 -1 3.5 3.529
2 6 +1 -1 -1 -1 4.0 4.038
3 4 -1 1 -1 -1 6.2 5.987
4 21 +1 1 -1 -1 5.0 5.295
5 17 -1 -1 1 -1 4.3 4.220
6 25 +1 -1 1 -1 4.8 4.829
7 19 -1 1 1 -1 4.3 4.779
8 23 +1 1 1 -1 4.3 4.187
9 15 -1 -1 -1 1 3.8 4.037
10 14 +1 -1 -1 1 5.6 4.895
11 18 -1 1 -1 1 6.0 5.745
12 26 +1 1 -1 1 5.2 5.404
13 3 -1 -1 1 1 5.1 4.579
14 5 +1 -1 1 1 5.2 5.537
15 30 -1 1 1 1 4.3 4.387
16 2 +1 1 1 1 4.4 4.145
17 8 -2 -2 0 0 3.2 3.266
18 9 +2 -2 0 0 3.5 3.533
19 27 0 -2 0 0 4.6 4.866
20 13 0 2 0 0 6.1 5.933
21 1 0 0 -2 0 4.5 4.633
22 12 0 0 2 0 4.1 4.066
23 10 0 0 0 -2 5.8 5.516
24 11 0 0 0 2 5.6 5.983
25* 7 0 0 0 0 6.8 6.350
26 20 0 0 0 0 6.2 6.350
27 16 0 0 0 0 6.5 6.350
Table 3. ANOVA response for linear, quadratic and interactive effect of factors used in the model
Model term Coefficient estimate Standard error P-value
Intercept -6.350 0.160 -
X1 0.067 0.079 0.4119
X2 0.027 0.079 0.0042
X3 -0.140 0.079 0.0931
X4 0.120 0.079 0.1603
X1 2
-0.740 0.074 < 0.0001
X2 2
-0.240 0.074 0.0058
X3 2
-0.034 0.074 < 0.0001
X4 2
-0.500 0.074 0.0605
X1X2 -0.150 0.097 0.0073
X1X3 0.025 0.097 0.7996
X1X4 0.088 0.097 0.3800
X2X3 -0.480 0.097 0.0002
X2X4 -0.190 0.097 0.0716
X3X4 -0.037 0.097 0.7037
The quadratic mathematical model, which included all
terms regardless of their significance level, can be given as Eq.
(3):
Yp=6.35+ 0.067 x1 +0.27 x2-0.14 x3+0.12 x4-0.30 x1 x2+0.025 x1 x3+0.088 x1x4 -0.48 x2x3 -0.19 x2x4-0.037 x3x4-0.74 x12-0.24 x22-0.50 x3
2
-0.15x4 2
(3)
Where Yp is the predicted protease concentration and x1,
x2, x3 and x4, the coded variables of KCl, MgSO4, gelatin and
soluble starch, respectively.
This regression equation was solved by the method of
Myers and Montgomery (9). Maximum protease production of
6.57 U mL-1 was predicted to be obtained in initial medium containing 5.14 g L-1 of KCl, 6.57 g L-1 of MgSO4, 9.05 g L-1
of gelatin and 5.27 g L-1 of soluble starch.
The maximal protease concentration obtained
experimentally was 6.50 U mL-1 and was very close to predicted response obtained at centre points (average of six
centre points was 6.53 U mL-1).
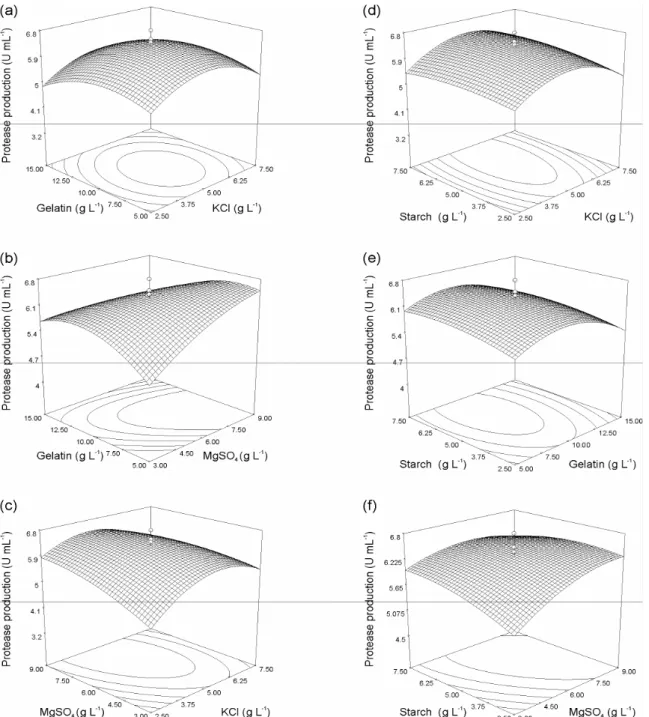
In order to further assess the effect of independent
variables on the protease production by Haloferax lucentensis
VKMM 007, two-dimensional contour plots and
three-dimensional response surface plots were generated from the
regression equation by keeping the two variables at zero and
changing the other two variables with different combinations
(Figure 2). These interactions indicated that previously
predicted medium concentration values were optimal for
maximal protease production. All the factor values of four
variables were found to be present within the design space.
These notion were futher supported by validation experiment
conducted using the predicted values for the four variables
studied which resulted in the maximal protease production of
6.80 U mL-1. Finally, protease production was observed in optimized medium in NaCl concentration range from 5% to
25% (w/v). In these experiments, maximal protease production
was obtained after 48 hours of cell growth and was highest in
media supplemented with 20% (w/v) and 25% (w/v) NaCl with
respective protease concentrations of 7.00 U mL-1 and 7.02 U mL-1.
The time required for cell cultures to reach maximal protease
production using optimized medium is significantly shorter
than reported for other halophilic protease producers. Protease
production in halophilic archaea Halobacterium salinarum and
Halobacterium sp. PB 407 reached maximal levels after 96
hours of incubation (4,2), while cultures of Halogeometricum
sp. TSS 101 supported maximal protease production after 86
hours of incubation (14). Compared to initial medium
Manikandan, M. et al. Protease production by H. lucentensis
production. This increase was further improved to 4.08-fold by
increasing the concentration of NaCl in the medium to 20%
(w/v) and 25% (w/v).
In conclusion, the experimental design presented in this
study effectively defined optimal medium composition, which
supported enhanced protease production in cultures of
Haloferax lucentensis VKMM 007. Given the simplicity and
low-cost of preparation of optimized medium, we consider the
results of this study useful for highly efficient production of
this halophilic protease on a bioreactor scale.
Figure 2. Response-surface and contour plots for the effects on protease production in cell cultures of Haloferax lucentensis
VKMM 007. From top to bottom left panel: gelatin (X3) and KCl (X1); gelatin (X3) and MgSO4 (X2); MgSO4 (X2) and KCl (X1);
ACKNOWLEDGEMENTS
This work was supported by a grant from the Government
of India Ministry of Science and Technology to Centre for
Advanced studies in Botany, University of Madras and
Ministry for School and Sports of the Republic of Slovenia
research program P1-0198.
REFERENCES
1. Box, G.E.P.; Hunte, W.G.; Hunte, J.S. (1978). Statistics for experimenters. John Wiley and Sons, New York.
2. Kanlayakrit, W.; Preeyanuch, B.; Takuji, O.; Masatoshi, G. (2004). Production and characterization of protease from an extremely halophilic Halobacterium sp. PB407. Kasetsart J. Nat. Sci. 38 (5), 15-20.
3. Khuri, A.I.; Cornell, J.A. (1987). Response surfaces, design and analysis. Marcel Decker Inc., New York.
4. Kim, J.; Dordick, J.S. (1997). Unusual salt and solvent dependence of a protease from an extreme halophile. Biotechnol. Bioeng. 55 (3), 471-479. 5. Kole, M.M.; Draper, I.; Gerson, D.F. (1988). Production of protease by Bacillus subtilis using simultaneous control of glucose and ammonium concentrations. J. Chem. Technol. Biotechnol. 41 (3), 197-206.
6. Manikandan, M.; Paši , L.; Kannan, V. (2009). Purification and biological characterization of a halophilic thermostable protease from Haloferax lucentensis VKMM 007. World J. Microbiol. Biotechnol. 25 (12), 1007-1017.
7. Margesin, R.; Schinner, F. (2001). Potential of halotolerant and halophilic microorganisms for biotechnology. Extremophiles 5 (2), 73-83.
8. McDonald, C.E.; Chen, L.L. (1965). The Lowry modification of the folin reagent for determination of proteinase activity. Anal. Biochem. 10 (1),
175-177.
9. Myers, R.H.; Montgomery, D.C. (2002). Response Surface Methodology: Process and Product Optimization Using Designed Experiments. John Wiley and Sons, New York.
10. Pansuriya, R.C.; Singhal, R.S. (2009). Response surface methodology for optimization of production of lovastatin by solid state fermentation. Braz. J. Microbiol. 41 (1), 164-172.
11. Ruiz, D.M.; De Castro, R.E. (2007). Effect of organic solvents on the activity and stability of an extracellular protease secreted by the haloalkaliphilic archaeon Natrialba magadii. J. Ind. Microbiol. Biotechnol. 34 (2), 111-115.
12. Swain, M.R.; Kar, S.; Ray, R.C. (2009) Exo-polygalacturonase production by Bacillus subtilis CM5 in solid state fermentation using cassava bagasse. Braz. J. Microbiol. 40 (3), 636-648.
13. Varela, H.; Ferrari, M.D.; Belobrajdic, L.; Weyrauch, R.; Loperena, L. (1996). Effect of medium composition on the production by a new Bacillus subtilis isolate of protease with promising unhairing activity. World J. Microbiol. Biotechnol. 12 (6), 643-645.
14. Vidyasagar, M.; Prakash, S.B.; Sreeramulu, K. (2006). Optimization of culture conditions for the production of haloalkaliphilic thermostable protease from an extremely halophilic archaeon Halogeometricum sp. TSS101. Lett. Appl. Microbiol. 43 (5), 385–391.