Submitted16 November 2015
Accepted 16 January 2016
Published22 February 2016
Corresponding author
Ving Ching Chong, [email protected]
Academic editor
María Ángeles Esteban
Additional Information and Declarations can be found on page 12
DOI10.7717/peerj.1664
Copyright
2016 Salimi et al.
Distributed under
Creative Commons CC-BY 4.0
OPEN ACCESS
Fully-automated identification of fish
species based on otolith contour: using
short-time Fourier transform and
discriminant analysis (STFT-DA)
Nima Salimi1, Kar Hoe Loh2, Sarinder Kaur Dhillon1and Ving Ching Chong1,2
1Institute of Biological Sciences, University of Malaya, Kuala Lumpur, Malaysia 2Institute of Ocean & Earth Sciences, University of Malaya, Kuala Lumpur, Malaysia
ABSTRACT
Background. Fish species may be identified based on their unique otolith shape or contour. Several pattern recognition methods have been proposed to classify fish species through morphological features of the otolith contours. However, there has been no fully-automated species identification model with the accuracy higher than 80%. The purpose of the current study is to develop a fully-automated model, based on the otolith contours, to identify the fish species with the high classification accuracy.
Methods. Images of the right sagittal otoliths of 14 fish species from three families namely Sciaenidae, Ariidae, and Engraulidae were used to develop the proposed identification model. Short-time Fourier transform (STFT) was used, for the first time in the area of otolith shape analysis, to extract important features of the otolith contours. Discriminant Analysis (DA), as a classification technique, was used to train and test the model based on the extracted features.
Results.Performance of the model was demonstrated using species from three families separately, as well as all species combined. Overall classification accuracy of the model was greater than 90% for all cases. In addition, effects of STFT variables on the performance of the identification model were explored in this study.
Conclusions.Short-time Fourier transform could determine important features of the otolith outlines. The fully-automated model proposed in this study (STFT-DA) could predict species of an unknown specimen with acceptable identification accuracy. The model codes can be accessed athttp://mybiodiversityontologies.um.edu.my/Otolith/
andhttps://peerj.com/preprints/1517/. The current model has flexibility to be used for more species and families in future studies.
SubjectsAquaculture, Fisheries and Fish Science, Bioinformatics, Marine Biology, Taxonomy, Computational Science
Keywords Automated taxon identification, Otolith shape analysis, Short-time Fourier transform, Discriminant analysis
INTRODUCTION
Dietrich & Pooley, 1994; Farr & Chesmore, 2007; Gaston & O’Neill, 2004; Jonker et al., 2000;La Salle et al., 2009;Larios et al., 2008;MacLeod, Benfield & Culverhouse, 2010; Parisi-Baradad et al., 2010;Potamitis, 2014;Watson, O’Neill & Kitching, 2003;Watson & Dallwitz, 1991;Zhao et al., 2013). In marine biology, identification of the fish species based on the otolith image analysis has been an interesting area due to its applications in the palaeontological and ecological sciences (Aguirre & Lombarte, 1999;Arellano et al., 1995; Bowen, 2000;Fitch & Brownell Jr, 1968;Lombarte & Castellón, 1991;Reichenbacher et al., 2007). Parisi-Baradad et al. (2010) developed the first automated taxon classification system through the shape analysis of the otolith contour. In order to extract the important morphological features of the otolith contour, external outline of the otolith was first converted to a one-dimensional (1D) signal. This representative signal was obtained by calculating the distances between the outline points and the center of gravity of the otolith image. Then, wavelet transform (WT) was applied on the 1D signal to extract useful features of the otolith outline. Using WT, irregularities of the otolith contours were quantified and localized appropriately; this is the advantage of WT over other feature extractors such as Fourier transform (FT) and elliptical Fourier descriptors (EFD) used in the other studies (Parisi-Baradad et al., 2005;Sadighzadeh et al., 2012). Even though their proposed model could identify the family of the specimens with 94% accuracy, the performance of the system dropped significantly at the species level (72%) (Parisi-Baradad et al., 2010). Therefore, the aim of the present study is to develop a fully-automated identification model with improved classification accuracy at the level of species.
Fourteen fish species from three different families namely Engraulidae, Sciaenidae, and Ariidae were used in this study. Short-time Fourier transform (STFT) is a conventional signal processing technique (Allen, 1997;Oppenheim, Schafer & Buck, 1999;Rabiner & Schafer, 1978) which to our knowledge has not yet been employed in the area of otolith image processing. STFT was applied in this study to extract morphological features of the otolith contours.
MATERIALS AND METHODS
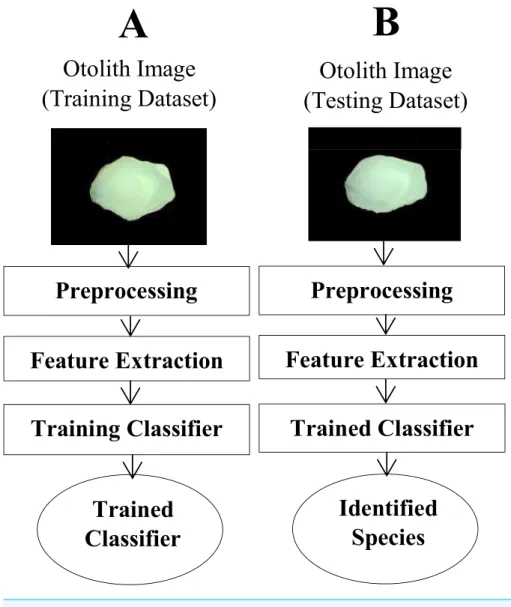
Images of the right sagittal otoliths were captured using a stereomicroscope (Olympus DP25FW, 6.3X magnification) attached with a digital camera. Proximal view of the otolith, dorsal edge facing up and posterior end facing the positive direction, was used in this study. The proposed image identification system was implemented in MATLAB (MATLABR Release 2013a, The MathWorks, Inc., Kuala Lumpur, Malaysia).Figure 1
illustrates the schematic diagram of the fully-automated image recognition model represented in this study. Different stages of this system are detailed as follows.
Preprocessing
Figure 1 A schematic diagram of the proposed image identification system.(A) shows different stages for training the model, and the testing part of the system is illustrated in the (B).
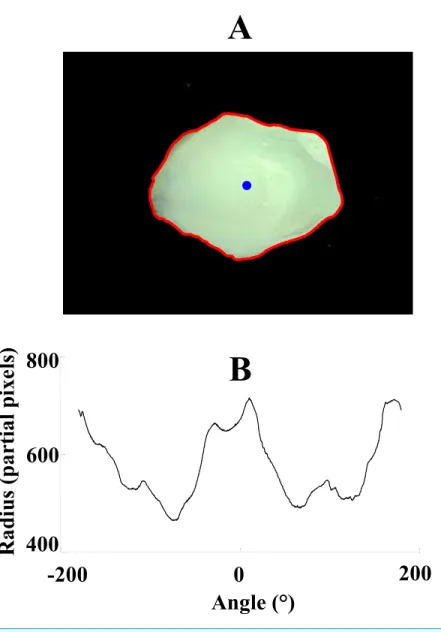
in obtaining the binary images for the otoliths with a wide range of transparency. After clearing the borders and filling the holes, the small objects (objects that had fewer than 50,000 pixels) were removed from the binary images. Then, coordinates of the boundary (outline) pixels as well as the center of gravity were calculated. By having these coordinates, characteristic 1D signals, which are the distances between the boundary pixels and center of gravity as a function of the corresponding angles, were determined.Figure 2shows an image of the otolith with its representative 1D signal.
Feature extraction
Figure 2 Image of an otolith (A) with its corresponding 1D signal (B).1D signal was obtained by calcu-lating the radius, distances between the boundary pixels (red) and the center of gravity (blue), as a func-tion of angle.
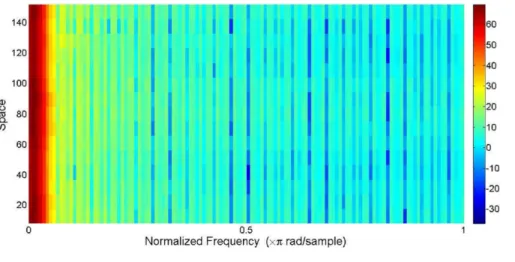
Figure 3 The spectrogram of the characteristic signal shown inFig. 2.The original signal was resam-pled to 1,000 points before calculating the short-time Fourier transform (STFT). The color bar indicates estimates of the power spectral density (PSD). STFT of the spatial-domain signal was calculated with sam-pling frequency of 2π.
then standardized by calculating the corresponding z-scores (Z_ABSs:z-scores of the absolute values and Z_ANGs: z-scores of the angles). In each segment of the signal, two important parameters were determined: maximum of the Z_ABSs (MAXABS) and
maximum of Z_ANGs (MAXANG). Having 16 segments in each signal, 32 attributes (16
MAXABS+16 MAXANG) were extracted from each representative signal. In this way, each
otolith image was converted to a 32-element vector in which the first 16 elements were MAXABSvalues and the rest were the values of MAXANG. The contribution of each feature
type (absolute and angle) to the performance of the model was also explored and the obtained results are demonstrated in the next section.
Classification
The characteristic vectors obtained from the previous stage were utilized as inputs to the Discriminant Analysis (DA) classifier in order to train and test the identification system. Fourteen species from three different families were used in this study (Table 1). All otoliths were extracted from fish obtained from fish landing sites or the wet markets. No ethics clearance was required from the University of Malaya—Institutional Animal Care and Use Committee (UM-IACUC).
RESULTS
Three different fish families (Sciaenidae, Ariidae, and Engraulidae) were used separately to train and test the model. In addition, the proposed image identification model was evaluated for all 14 species combined.
Engraulidae family
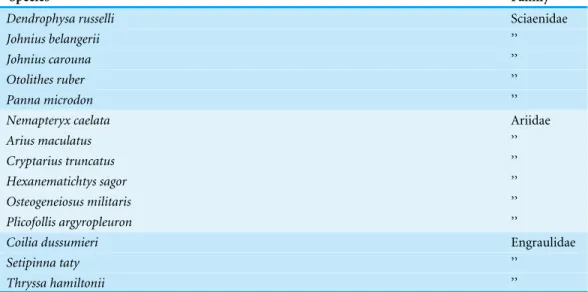
Table 1 Fish species used in the proposed fully-automated identification system.
Species Family
Dendrophysa russelli Sciaenidae
Johnius belangerii ’’
Johnius carouna ’’
Otolithes ruber ’’
Panna microdon ’’
Nemapteryx caelata Ariidae
Arius maculatus ’’
Cryptarius truncatus ’’
Hexanematichtys sagor ’’
Osteogeneiosus militaris ’’
Plicofollis argyropleuron ’’
Coilia dussumieri Engraulidae
Setipinna taty ’’
Thryssa hamiltonii ’’
Table 2 Confusion matrix for the classification results of the Engraulidae family.The predicted species (columns) are compared with the species confirmed by an expert (rows).
Coilia dussumieri Setipinna taty Thryssa hamiltonii Coilia dussumieri 10 (100%) 0 (0%) 0 (0%)
Setipinna taty 0 (0%) 10 (100%) 0 (0%)
Thryssa hamiltonii 0 (0%) 1 (10%) 9 (90%)
specimens per species (total of 30 images for testing the model).Table 2demonstrates the confusion matrix obtained from the predicted species in this family.
All of the 10 specimens from the Coilia dussumieriandSetipinna taty species were classified correctly. For theThryssa hamiltoniispecies, one specimen was misclassified as theSetipinna taty species. Overall, 29 out of 30 specimens from the Engraulidae family (∼97%) were correctly predicted as the target species.
Sciaenidae family
Table 3 Confusion matrix obtained from five species of the Sciaenidae family.The columns indicate the predicted species by the identification model, while rows indicate the target species.
Dendrophysa russelli Johnius belangerii Johnius carouna Otolithes ruber Panna microdon
Dendrophysa russelli 9 (90%) 0 (0%) 0 (0%) 1 (10%) 0 (0%)
Johnius belangerii 0 (0%) 10 (100%) 0 (0%) 0 (0%) 0 (0%)
Johnius carouna 0 (0%) 0 (0%) 10 (100%) 0 (0%) 0 (0%)
Otolithes ruber 1 (10%) 0 (0%) 0 (0%) 9 (90%) 0 (0%)
Panna microdon 0 (0%) 0 (0%) 0 (0%) 0 (0%) 10 (100%)
Table 4 Classification results (confusion matrix) of the Ariidae family.Outputs of the identification model (columns) are compared with the tar-get species (rows).
Nemapteryx caelatus
Arius maculatus
Cryptarius truncatus
Hexanematichtys sagor
Osteogeneiosus militaris
Plicofollis argyropleuron
Nemapteryx caelatus 8 (80%) 0 (0%) 2 (20%) 0 (0%) 0 (0%) 0 (0%)
Arius maculatus 0 (0%) 10 (100%) 0 (0%) 0 (0%) 0 (0%) 0 (0%)
Cryptarius truncatus 1 (10%) 0 (0%) 9 (90%) 0 (0%) 0 (0%) 0 (0%)
Hexanematichtys sagor 0 (0%) 0 (0%) 0 (0%) 10 (100%) 0 (0%) 0 (0%)
Osteogeneiosus militaris 1 (10%) 0 (0%) 0 (0%) 0 (0%) 9 (90%) 0 (0%)
Plicofollis argyropleuron 0 (0%) 0 (0%) 0 (0%) 0 (0%) 0 (0%) 10 (100%)
Ariidae family
Six species from the Ariidae family were also used in this study. The number of specimens per species for training and testing the model were 18 and 10, respectively. The classification results obtained from this family are shown inTable 4. Overall accuracy of the model in this family was∼93% which is slightly less than the other two families. The lowest classification accuracy (80%) in this family was for the Nemapteryx caelatus. Two specimens of the Nemapteryx caelatus species were predicted as the Cryptarius truncatus. Three species namelyArius maculatus,Hexanematichtys sagor andPlicofollis argyropleuronhad 100% correct prediction results. The accuracy of the model for theCryptarius truncatusand Osteogeneiosus militarisspecies was 90%. Both of these species had one specimen that was misclassified asNemapteryx caelatus.
All three families
Table 5 Confusion matrix for the identification results obtained from 14 species of three different families.In each target species (rows), numbers of specimens are indicated in the corresponding pre-dicted species (columns). Species areDendrophysa russelli(1),Johnius belangerii(2),Johnius carouna(3),
Otolithes ruber(4),Panna microdon(5),Nemapteryx caelatus(6),Arius maculatus(7),Cryptarius truncatus
(8),Hexanematichtys sagor(9),Osteogeneiosus militaris(10),Plicofollis argyropleuron(11),Coilia dussum-ieri(12),Setipinna taty(13),Thryssa hamiltonii(14).
1 2 3 4 5 6 7 8 9 10 11 12 13 14
1 8 0 0 2 0 0 0 0 0 0 0 0 0 0
2 0 10 0 0 0 0 0 0 0 0 0 0 0 0
3 0 0 10 0 0 0 0 0 0 0 0 0 0 0
4 1 0 0 9 0 0 0 0 0 0 0 0 0 0
5 0 0 0 0 10 0 0 0 0 0 0 0 0 0
6 0 0 0 0 0 7 0 2 0 0 1 0 0 0
7 0 0 0 0 0 0 10 0 0 0 0 0 0 0
8 0 0 0 0 0 3 0 7 0 0 0 0 0 0
9 0 0 0 0 0 0 0 0 10 0 0 0 0 0
10 0 0 0 0 0 0 0 1 0 9 0 0 0 0
11 0 0 0 0 0 0 0 0 0 0 10 0 0 0
12 0 0 0 0 0 0 0 0 0 0 0 10 0 0
13 0 0 0 0 0 0 0 0 0 0 0 0 9 1
14 0 0 0 0 0 0 0 0 0 0 0 0 0 10
family, had the most numbers of misclassified specimens among the 14 species used in this study. The classification accuracy forOtolithes ruber,Osteogeneiosus militaris, andSetipinna tatywas 90%. It is worth-noting that there was no cross-family misclassification for all six species that had at least one misclassified specimen (all six species had specimens correctly classified in their families). As a result, developing a model that first identifies the family and then species cannot lead to an improvement in the overall accuracy of the system.
Contribution of MAXABS and MAXANGto the system performance
To explore the contribution of MAXABSand MAXANGto the performance of the system,
each feature type was separately used to train and test the model. Table 6shows the classification results obtained by using each feature type separately (16-element vector) and their combined features (32-element vector). For all four data sets used in this study, the best identification result was achieved using the 32-element vector. For the Engraulidae, Sciaenidae and the combined families, using only the MAXANGresulted in higher accuracy
compared to using only the MAXABS. However, the performance of the model was better
for the Ariidae family by using the 16-element vector obtained from the absolute features (MAXABS). This result suggests that both phase and absolute features should be taken into
account when the model is trained with different fish families.
Effect of the windowing function
Table 6 Performance of the model using absolute, phase angle, and combined features (rows) for all four data sets (columns) used in this study.
Extracted features Overall accuracy
Engraulidae family Sciaenidae family Ariidae family All families
16 MAXABS 87% 84% 87% 84%
16 MAXANG 93% 94% 78% 86%
16 MAXABS+16MAXANG 97% 96% 93% 92%
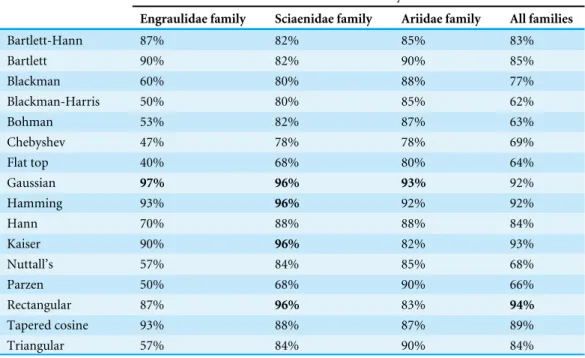
Table 7 Classification results of the model for 16 different window functions.Using each window function (rows), the model performance was calculated for all four datasets (columns).
Window functions Overall accuracy
Engraulidae family Sciaenidae family Ariidae family All families
Bartlett-Hann 87% 82% 85% 83%
Bartlett 90% 82% 90% 85%
Blackman 60% 80% 88% 77%
Blackman-Harris 50% 80% 85% 62%
Bohman 53% 82% 87% 63%
Chebyshev 47% 78% 78% 69%
Flat top 40% 68% 80% 64%
Gaussian 97% 96% 93% 92%
Hamming 93% 96% 92% 92%
Hann 70% 88% 88% 84%
Kaiser 90% 96% 82% 93%
Nuttall’s 57% 84% 85% 68%
Parzen 50% 68% 90% 66%
Rectangular 87% 96% 83% 94%
Tapered cosine 93% 88% 87% 89%
Triangular 57% 84% 90% 84%
DISCUSSION
The identification model proposed in this study could predict the species of an unknown specimen from the Engraulidae, Sciaenidae, and Ariidae family with the overall accuracy of 97%, 96%, and 93%, respectively. Even after combining three families the accuracy of the model remained above 90% (∼92%), which is noticeably higher than the results obtained by the identification model proposed in the most related study (∼72%) (Parisi-Baradad et al., 2010). It is noted that training datasets used in the present study were relatively small (19, 20, and 18 specimens per species for Sciaenidae, Engraulidae, and Ariidae family, respectively). Using more samples in the training sets could lead to increasing the accuracy of the model.
Two spectral analysis methods namely Fourier transform (FT) and wavelet transform (WT) have been applied in the previous studies as the feature extractors (Castonguay, Simard & Gagnon, 1991;Parisi-Baradad et al., 2005;Parisi-Baradad et al., 2010). Short-time Fourier transform (STFT) has been utilized in the present study, for the first Short-time in the area of otolith image recognition, to extract the spectral features of the 1D signal obtained from the fish otolith contour. By using the maximum (standardized) values of the absolutes and phase angles of the STFT-transformed signal, a relatively low number of features (32) was extracted which is desired for the classification systems applying machine learning techniques. On the other hand, multiscale decomposition of the 1D signal using wavelet transform (WT) as proposed byParisi-Baradad et al. (2005)andParisi-Baradad et al. (2010)resulted in the extraction of a large number of attributes.
As was demonstrated in the previous section (Table 7), the choice of window function had a direct effect on the performance of the system. In addition to the type of windowing function, the number of points of the window function and the number of overlapped samples played important roles in the classification results. The proposed model was also tested with a variety of these two parameters (not reported here), and the best match was selected (i.e., 100 window points and 40 overlapped samples). Each 1D signal was broken into 16 segments by setting these two parameters to the optimized values. These two parameters were however optimized for the Gaussian window only. The performance of other window types (seeTable 7) may be increased by changing the values of these two parameters (i.e., changing the number of segments/spatial resolution).
Two classification techniques namely Decision Tree and Discriminant Analysis were tested in this study (the results obtained by the Decision Tree are not shown here) and the latter was selected due to more accurate results. However, there are other classification methods such as Naive Bayes, Nearest Neighbors, Support Vector Machine, and Neural Network which may improve the performance of the model in future studies.
Comparison among existing otolith classification models, in terms of correct species identification, is a difficult task since these models are developed based on different datasets (different fish species obtained from different geographical regions). For instance, the AFORO database of fish otoliths, as used by Parisi-Baradad et al. (2010), consisted of 420 species from mainly western Mediterranean and Antarctic waters (Lombarte et al., 2006;Parisi-Baradad et al., 2010). However, the performance of the automated taxon identification (ATI) model ofParisi-Baradad et al. (2010)was evaluated based on only five species (from five families) in one test, and 50 species (from 35 families) in another test. In both tests, the accuracy of the ATI model at the species level was 72%. The STFT-DA model proposed in the present study classified five species within the same family (Sciaenidae) with an overall accuracy of 96%; while 14 species (from three families) were classified with an overall 92% accuracy. The STFT-DA model could also be tested with species from the AFORO or other databases if the model is trained with sufficient number of samples per species from the corresponding databases. It is expected that the addition of more species to the STFT-DA model would decrease the prediction accuracy. On the other hand, model prediction of species may be improved if the size of the training sets is increased, more outline features as in other views are added, or better classification techniques are used. Moreover, combining the outline features extracted by the STFT-DA model with other morphological attributes such as features of the sulcus acusticus (Tuset, Lombarte & Assis, 2008) may further improve classification accuracy for databases comprising a large number of species. Nonetheless, given the high number of marine fish species in the world, so far over 15,300 species reported by the first Census of Marine Life (ScienceDaily, 2003), a more pragmatic approach would be to limit the number of species by classifying them within a smaller geographical region, water body, country or fish habitat.
CONCLUSIONS
ACKNOWLEDGEMENTS
We would like to thank Cecilia Chu and Suellina Binti Sulaiman for capturing the otolith images. The University of Malaya is acknowledged for providing research facilities.
ADDITIONAL INFORMATION AND DECLARATIONS
Funding
This work was supported by University of Malaya Research Grants (UMRG), RP008-2012C and RP008-2012A. The funders had no role in study design, data collection and analysis, decision to publish, or preparation of the manuscript.
Grant Disclosures
The following grant information was disclosed by the authors:
University of Malaya Research Grants (UMRG): RP008-2012C, RP008-2012A.
Competing Interests
The authors declare there are no competing interests.
Author Contributions
• Nima Salimi conceived and designed the experiments, performed the experiments, analyzed the data, contributed reagents/materials/analysis tools, wrote the paper, prepared figures and/or tables.
• Kar Hoe Loh performed the experiments, contributed reagents/materials/analysis tools, reviewed drafts of the paper.
• Sarinder Kaur Dhillon and Ving Ching Chong conceived and designed the experiments, reviewed drafts of the paper.
Animal Ethics
The following information was supplied relating to ethical approvals (i.e., approving body and any reference numbers):
1. University of Malaya-Institutional Animal Care and Use Committee (UM-IACUC). 2. No approval was required since project was based on dead fish collected from fish landings.
Data Availability
The following information was supplied regarding data availability:
Data sets (Otolith images) as well as MATLAB codes are available as Supplemental Information.
Supplemental Information
Supplemental information for this article can be found online athttp://dx.doi.org/10.7717/
REFERENCES
Aguirre H, Lombarte A. 1999.Ecomorphological comparisons of sagittae in Mullus barbatus and M. surmuletus.Journal of Fish Biology55:105–114
DOI 10.1111/j.1095-8649.1999.tb00660.x.
Allen JB. 1997.Short term spectral analysis, synthesis, and modification by discrete Fourier transform.IEEE Transactions on Acoustics, Speech and Signal Processing 4:21–24.
Arbuckle T, Schröder S, Steinhage V, Wittmann D. 2001.Biodiversity informatics in action: identification and monitoring of bee species using ABIS. In:Proc 15th int symp informatics for environmental protection. 425–430.
Arellano R, Hamerlynck O, Vincx M, Mees J, Hostens K, Gijselinck W. 1995.
Changes in the ratio of the sulcus acusticus area to the sagitta area of Pomatoschis-tus minuPomatoschis-tus and P. lozanoi (Pisces, Gobiidae).Marine Biology 122:355–360
DOI 10.1007/BF00350868.
Bowen W. 2000.Reconstruction of pinniped diets: accounting for complete digestion of otoliths and cephalopod beaks.Canadian Journal of Fisheries and Aquatic Sciences 57:898–905DOI 10.1139/f00-032.
Castonguay M, Simard P, Gagnon P. 1991.Usefulness of Fourier analysis of otolith shape for Atlantic mackerel (Scomber scombrus) stock discrimination.Canadian Journal of Fisheries and Aquatic Sciences48:296–302DOI 10.1139/f91-041. Chun J, Lee J-H, Jung Y, Kim M, Kim S, Kim BK, Lim Y-W. 2007.EzTaxon: a
web-based tool for the identification of prokaryotes web-based on 16S ribosomal RNA gene sequences.International Journal of Systematic and Evolutionary Microbiology 57:2259–2261DOI 10.1099/ijs.0.64915-0.
Cope JS, Corney D, Clark JY, Remagnino P, Wilkin P. 2012.Plant species identifi-cation using digital morphometrics: a review.Expert Systems with Applications 39:7562–7573DOI 10.1016/j.eswa.2012.01.073.
Culverhouse PF, Simpson R, Ellis R, Lindley J, Williams R, Parsini T, Reguera B, Bravo I, Zoppoli R, Earnshaw G. 1996.Automatic classification of field-collected dinoflag-ellates by artificial neural network.Marine Ecology Progress Series139:281–287
DOI 10.3354/meps139281.
Dietrich CH, Pooley CD. 1994.Automated identification of leafhoppers (Homoptera: Cicadellidae: Draeculacephala Ball).Annals of the Entomological Society of America 87:412–423DOI 10.1093/aesa/87.4.412.
Farr I, Chesmore D. 2007.Automated bioacoustic detection and identification of wood-boring insects for quarantine screening and insect ecology. In:Proceedings of the international conference on bioacoustics. 201–208.
Fitch JE, Brownell Jr RL. 1968.Fish otoliths in cetacean stomachs and their importance in interpreting feeding habits.Journal of the Fisheries Board of Canada25:2561–2574
Gaston KJ, O’Neill MA. 2004.Automated species identification: why not?Philosophical Transactions of the Royal Society of London B: Biological Sciences359:655–667
DOI 10.1098/rstb.2003.1442.
Jonker R, Groben R, Tarran G, Medlin L, Wilkins M, García L, Zabala L, Boddy L. 2000.Automated identification and characterisation of microbial popula-tions using flow cytometry: the AIMS project.Scientia Marina64:225–234
DOI 10.3989/scimar.2000.64n2225.
Larios N, Deng H, Zhang W, Sarpola M, Yuen J, Paasch R, Moldenke A, Lytle DA, Correa SR, Mortensen EN. 2008.Automated insect identification through concate-nated histograms of local appearance features: feature vector generation and region detection for deformable objects.Machine Vision and Applications19:105–123
DOI 10.1007/s00138-007-0086-y.
La Salle J, Wheeler Q, Jackway P, Winterton S, Hobern D, Lovell D. 2009.Accelerating taxonomic discovery through automated character extraction.Zootaxa2217:43–55. Lombarte A, Castellón A. 1991.Interspecific and intraspecific otolith variability in the
genus Merluccius as determined by image analysis.Canadian Journal of Zoology 69:2442–2449DOI 10.1139/z91-343.
Lombarte A, Chic Ò, Parisi-Baradad V, Olivella R, Piera J, García-Ladona E. 2006.A web-based environment for shape analysis of fish otoliths. The AFORO database. Scientia Marina70:147–152 DOI 10.3989/scimar.2006.70n1147.
MacLeod N, Benfield M, Culverhouse P. 2010.Time to automate identification.Nature 467:154–155DOI 10.1038/467154a.
Oppenheim AV, Schafer RW, Buck JR. 1999.Discrete-time signal processing. 2nd edition. Upper Saddle River: Prentice Hall.
Parisi-Baradad V, Lombarte A, García-Ladona E, Cabestany J, Piera J, Chic O. 2005. Otolith shape contour analysis using affine transformation invariant wavelet
transforms and curvature scale space representation.Marine and Freshwater Research 56:795–804DOI 10.1071/MF04162.
Parisi-Baradad V, Manjabacas A, Lombarte A, Olivella R, Chic Ò, Piera J, García-Ladona E. 2010.Automated Taxon Identification of Teleost fishes using an otolith online database—AFORO.Fisheries Research105:13–20
DOI 10.1016/j.fishres.2010.02.005.
Potamitis I. 2014.Automatic classification of a taxon-rich community recorded in the wild.PLoS ONE9(5):e96936.
Rabiner LR, Schafer RW. 1978.Digital processing of speech signals. Englewood Cliffs: Prentice Hall.
Reichenbacher B, Sienknecht U, Küchenhoff H, Fenske N. 2007.Combined otolith morphology and morphometry for assessing taxonomy and diversity in fossil and extant killifish (Aphanius,†Prolebias).Journal of Morphology268:898–915
DOI 10.1002/jmor.10561.
of closely related species of Lutjanus spp. from the Persian Gulf.Marine Biology Research8:802–814 DOI 10.1080/17451000.2012.692163.
ScienceDaily. 2003.How many fish in the sea? census of marine life launches first report. Available athttp:// www.sciencedaily.com/ releases/ 2003/ 10/ 031024064333.htm. Tuset VM, Lombarte A, Assis CA. 2008.Otolith atlas for the western Mediterranean,
north and central eastern Atlantic.Scientia Marina72:7–198
DOI 10.3989/scimar.2008.72s17.
Watson L, Dallwitz MJ. 1991.The families of angiosperms: automated descriptions, with interactive identification and information retrieval.Australian Systematic Botany 4:681–695DOI 10.1071/SB9910681.
Watson AT, O’Neill MA, Kitching IJ. 2003.Automated identification of live moths (Macrolepidoptera) using digital automated identification system (daisy).Systematics and Biodiversity1:287–300DOI 10.1017/S1477200003001208.
Zhao G, Krishnamurthy S, Cai Z, Popov VL, Travassos da Rosa AP, Guzman H, Cao S, Virgin HW, Tesh RB, Wang D. 2013.Identification of novel viruses using VirusHunter–an automated data analysis pipeline.PLoS ONE8:e78470