Journal of Agricultural Sciences UDC: 636.087.2:631.15 Vol. 54. No 2, 2009 Original scientific paper Pages 166-178
INFLUENCE OF ORGANIZATIONAL AND ECONOMIC FACTORS ON BUSINESS RESULTS OF FEED MILLS IN SERBIA
V. Stanković1
Abstract: The Serbian animal feed industry confronted with
insufficiently used capacities and considerable price oscillations of raw materials and final products has gone through a substantially long period of dynamic development. The objective was to analyze production capacities, spatial distribution, changes in feed manufacture output and raw materials used, import and export, changes in the number of employees, etc. Major attention was focused on indices of the financial and economic structure in order to define the position of feed mills in relation to the sector and the economy as a whole. In addition, the aim was to analyze the possibility of improving feed mill management. Mathematical and statistical models were developed with special reference to the needs of some types and categories of animals, raw materials at disposal, capacities and requirements with regard to feedingstuffs. The linear programming model was used in order to contribute to the successful management of all the phases in the production chain.
Key words: feed mill, business conditions and results, production optimization models.
I n t r o d u c t i o n
The animal feed industry represents a unique case from the standpoint of product assortment focused on animal husbandry and the need to rely on
1
Veselin Stanković, Аgrobanka,a.d. Beograd
167
agricultural production in order to ensure the principal resources needed. Currently, feed manufacture in our mills accounts for more than 80% of the total feed production per year. In addition, the contribution of 240-250 small mills involved in the manufacture and preparation of animal feed is of major significance for the sector.
Since the mid-1990's an unfavourable economic trend has been registered in the Serbian animal feed industry. The aim of the study was to analyze the impact of organizational and economic factors on business results of feed mills considering their importance for the Serbian agriculture and economy as a whole.
The study focused on prior development of the feed industry, capacities and spatial distribution, changes in output and production assortment, raw material production requirements, export and import and employee trends.
Models for optimization of the production structure were developed and analyzed in order to contribute to the improvement of feed mill management.
Materials and Methods
Numerous relevant literature data and research methods were used in the study. The sources of the data and methods used were annuals, bulletins and reports of the Statistical Offices of both Serbia and Serbia and Montenegro (FR Yugoslavia). In addition, the book-keeping data of the feed mills analyzed were used as well. The results of numerous researchers in the field of interest were also taken into account.
The business results achieved in the analyzed feed mills were obtained from annual reports (balance success sheets) submitted to the Solvency Center of the National Bank of Serbia.
The feed manufacture industry data with regard to physical state, content and purpose, machinery capacity, storehouses, number and structure of employees for the nine feed mills studied were obtained using
questionnaires from the poll conducted by the Animal Feed Group of the Chamber of Commerce.
In addition to tables and figures showing the current status, tendencies and index analysis, methods for the determination of trends, correlation and regression analysis methods, production function methods and linear programming methods were used as well.
168
and regular income per unit of capacity, total income on 100 dinars of total expenses, gross income, net and gross income on 100 dinars of permanent resources etc.).
An optimal production structure model was developed using the linear programming method and this contributed to an optimal solution under hypothesized conditions. The solutions obtained were analyzed and the post-optimal analysis included possible changes of coefficient constraints in the function of criterion.
Results and Discussion
Serbia is characterized by considerably small feed mills because 86% of the total number of mills have capacities for manufacture and processing of 20 thousand tons of animal feed per year.
Capacity utilization in relation to both the total industry and feed production was analyzed from the standpoint of the share of achieved production in the possible production, i.e. possible time for capacity activities from the technical and technological standpoints. The share of the achieved in the possible production within the technical and technological time for capacity activities was relatively low in both the total industry (about 64%) and the feed production industry (about 57%). Feed production was down as well whereby the decline varied prominently (between 7 and 8 % in both Serbia and Vojvodina; in Kosovo and Metohija feed production declined by about 60%).
The greatest feed production output, about two million tons, was registered by the mid-1980`s. There were no changes with regard to spatial distribution of feed manufacture, with Vojvodina predominating in the production.
A decline in the volume of feed manufacture was more prominent in relation to the decrease of the number of animals in Serbia. During the past years the number of small feed mills increased, however, there are no data on their share in the total production structure despite the significance for the local market.
169
70 raw materials and components with cereals and protein sources predominating.
Animal feed manufacture imposes the need to use products of the food industry (starch, sugar, oils, malts, milk processing and slaughter industry, cereal processing and fish industry, etc). Of the raw materials, approx. 35% originate from various food production and processing branches and sectors. Corn accounts for more than 50% in the structure of principal raw materials used in the animal feed industry. In addition to corn, feed manufacture involves wheat, barley and other cereals. Soybean meal presents the most important source of proteins, i.e. essential amino acids needed for balanced high quality animal feed.
The importance of feed manufacture for the development of industry, especially agriculture, i.e. livestock production, imposed the need to analyze the business results and financial position of feed mills in Serbia. A thorough investigation was conducted encompassing nine feed mills in Serbia. In the analyzed mills the total feed volume produced was about 450 thousand tons per year presenting 20% of the installed capacities of the industry, with 740 employees or 16% of the total number of those employed in this sector.
The share of poultry feed in the total animal feed production was up in nearly all the mills analyzed. The 50% greater share of poultry feed in the total animal feed production had a positive effect on total income per worker. Thus it can be concluded that the 30% greater share of cattle feed in the total animal feed production tended to improve the financial result as well. A declining financial result was however not registered even with a 30% lower share of these feed in the total animal feed production.
During the period of investigation the capacities of the mills analyzed were left unaltered and for this reason the degree of utilization depended primarily on feed manufacture output. Therefore, business results were found to depend significantly on the size and level of capacity utilization, e.g. increasing capacity utilization from 20 to 50% tended to raise total income per unit of capacity by 45% and further increase of the utilization capacity tended to raise total income by 240%.
Total income per worker ranged from 30-90 thousand dinars pointing to low production efficiency. In the mills analyzed capacity usage had to be raised 2- to 6-fold in order to achieve the desired manufacture efficiency.
170
Greater capacity utilization of any feed mill is the prerequisite for sustainable marketing.
The relationship between income from financing and expenses from financing points to greater financing expenses than incomes because mills were more inclined to borrow financial means. However, some of the mills had greater incomes than expenses from financing thanks to credits and postponed payments to purchasers, lower credit rates, etc.
Average production per worker amounted to 150 tons of feed per year at the sector level, whereas in the mills analyzed it ranged from 29-375 tons. In developed countries, the manufacture of animal feed per worker amounts to more than 1500 tons/per year.
During the analyzed period the coefficient of economic efficiency at the sector level was 1.1. on average and as for mills it differed each year. In most mills financial results were very low, approx. 200 thousand dinars per worker. Economic efficiency presented as business incomes on 100 dinars of business expenses was low as well ranging from 100 to 136 dinars.
Profitability was analyzed using increased investments from depreciation. The rate of profitability in feed mills ranged from 0.3 to 55.6% and for the sector 2.1 to 4.6%. This points to a very low profitability of most of the investigated mills.
More than 225 tons of animal feed/worker/per year had a favourable impact on fixed capital (gross profit on 100 dinars of capital assets). At this level of production each hundred dinars of capital assets were followed by 12 dinars of gross profit. Increasing production per worker tended to improve profitability. In the structure of business means of the mills studied, the share of fixed assets accounted for 56%, supplies 22% and debt demands 15%.
The structure of property is effected by the activities of the enterprise and in the case of feed mills it was found that buildings predominated in capital assets followed by equipment. Over the years the share of fixed assets in permanent property was nearly the same.
The high share of fixed assets in business property points to considerable investments in buildings (70% of capital) and low investments in equipment (about 16%).
171
The low total income per worker points to an unstable relationship between circulating capital (represented in business means) and financial result. Thirty to 60% of circulating capital in most mills was represented in business means and therefore total income per worker was expected to range from 500 thousand to one million dinars. There were significant reserves for increasing financial result, establishing adequate relationships between circulating capital and business means.
Business expenses included expenses of direct materials and goods and other business expenses. The share of gross profits in business expenses ranged from 5 to 20% amounting to about 9%, whereas the share of depreciation ranged from 1 to 10%, 3% on average.
The relationship between business income and business expenses in most mills was unfavourable pointing to the fact that expenses increased faster than did incomes, i.e. this contributed to the decline of economic efficiency and was easily proved in the case of six mills with business incomes at the level of business expenses.
Based on the microeconomic analysis of feed mills the sector of feed manufacture was noted to face issues which may be attributed to social trends, economic status and agricultural development of the country but also to management skills and organisational and economic activities. Management skills are considered of key importance in decisionmaking and undertaking measures with regard to personnel organisation, raw material, capital and resource supply, and in contributing to efficient business results and profit gain. The choice of the production structure enables the enterprise to adapt to market conditions with regard to purchaser requirements and input supply.
The complexity of business systems imposed the need to apply mathematical models in solving numerous economic problems. Models needed to be developed in order to explain, predict, project. Linear programming models and optimum determination models were used in the study.
The aim of developing the model was to improve business results in feed mills by choosing an optimal production programme. In addition, the model encompassed requirements with regard to nutrition standards for domestic animals and legislation on feed quality and other prerequisites which need to be fulfilled in feed manufacture.
Two models were developed differing with regard to feed manufacture requirements.
172
mills manufacture 100,000 tons animal feed per year;
optimal production programme includes pig, cattle and poultry feed considering their 95% and greater share in the production structure;
resource/raw material assortment for feed manufacture harmonized with nutrient requirements available on the domestic market.
Model I was characterized by less defined feeds. The model included some general conditions for all feeds. The solution of this model offered a maximum contribution margin (net income) for the feed mill as a whole. The economic function included raw material prices and sale prices of some feeds.
Model II was characterized by better defined feeds. A two-stage
optimal solution was developed. Stage 1 included the standard linear programming model for each of the 17 feeds:
5 complete and 2 pig feed supplements;
3 complete and 1 cattle feed supplement and
5 complete poultry feed.
The solution of these models offered minimum production costs.
Stage 2 was developed in order to contribute to mutual competitiveness between the feeds studied. A new model was thus developed with an economic function which included fodder prices and some single feed prices. The solution offers a maximum contribution margin (net income) for the feed mill.
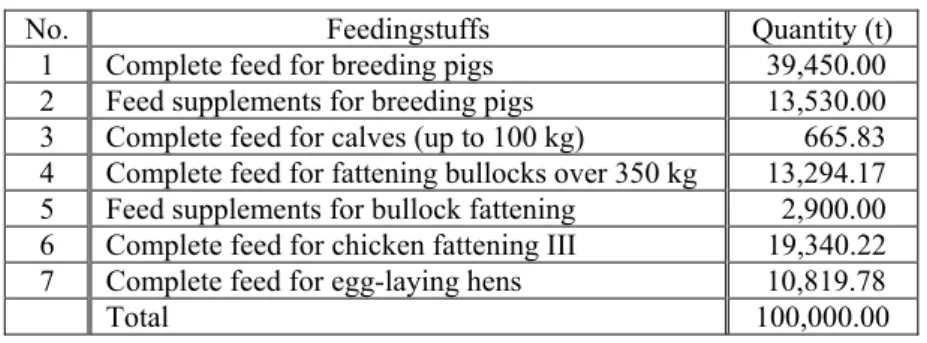
Model I included 52 variables, of which 18 feeds, 16 microelements, amino acids and vitamins and 17 complete and feed supplements for different animals. The feeds chosen in the study were available on the domestic market. The greatest share in the production structure accounted for pig feed (about 53%) whereas the share of cattle feed was the smallest (16%). The structure of production can be changed by adding constraints for some feeds within the group (Table 1).
This solution offers a successful business result because of the net income amounting to 1597 billion dinars. A key change of the net income may be registered by excluding constraints for some components (corn, soybean meal) and using feed supplements meeting demands and being cheaper as well.
173
negative impact on the financial result. The effect was most unfavourable with regard to feed supplements for cattle (28.94 RSD/kg), although complete cattle and pig feeds were not lagging behind.
Tab. 1. Optimal production structure
No. Feedingstuffs Quantity (t)
1 Complete feed for breeding pigs 39,450.00 2 Feed supplements for breeding pigs 13,530.00 3 Complete feed for calves (up to 100 kg) 665.83 4 Complete feed for fattening bullocks over 350 kg 13,294.17 5 Feed supplements for bullock fattening 2,900.00 6 Complete feed for chicken fattening III 19,340.22 7 Complete feed for egg-laying hens 10,819.78
Total 100,000.00
The production structure of Model II (Table 2) included constraints relating to the possible minimum and maximum purchase of feeds, the share of which in the production had been significant.
Tab. 2. Optimal production structure
No. Feedingstuffs Quantity (t)
1 Complete feed for piglets (up to 15 kg) 17,647 2 Complete feed for pig fattening (60/100 kg) 30,423 3 Feed supplements for breeding pigs 4,210 4 Complete feed for egg-laying hens 18,685 5 Complete feed for chicken fattening I 15,075 6 Complete feed for bullocks (250/350 kg) 13,960
Total 100,000
The net income obtained was the difference between production value and variable costs (excluding labour and energy costs) amounting to 1,838 billion dinars.
174
Of the 17 mixtures, the final solution included 6. The following feeds were mutually competitive: complete feed for pigs up to 15 kg and complete feed for chicken fattening I, complete feed for fattening pigs 25/60 kg and complete feed for fattening pigs 60/100 kg, complete feed for chicken fattening I and complete feed for chicken fattening II, complete feed for calves up to 100 kg and complete feed for bullock fattening 250-350 kg.
The most stable feeds for the final solution under different conditions were the following: complete feed for bullock fattening (250/350 kg) and feed supplements for pig breeding and fattening, with an acceptable 46.83% sale price increase, i.e. its 16.59% decline.
The change in the capacity of the feed mill has had its impact on the financial result which amounted to 21.22 RSD/kg of feed. The constraint known as total capacity can be decreased to 96.400 tons.
Changes in the constraints with regard to the production of some feeds point to the need to change the value of minimum production of complete cattle feed, complete feed for pig fattening (both categories) and complete feed for chicken fattening. Increasing the production of the feeds tended to decrease net income per kg by 10.12 dinars (complete cattle feed), 5.23 dinars (complete pig feed) and 1.29 dinars (complete feed for laying hens). The net income increase ranged from 0.04 to 9.10 dinars per kg. The greatest impact may be expected from increasing the production of feed supplements for pigs, and the smallest from complete pig feed.
C o n c l u s i o n
In Serbia the output of animal feed manufacture was the greatest in the 1980s amounting to approx. two million tons. In 2003 feed manufacture volume was the smallest (about 500 thousand tons or down 4-fold compared with 1984).
The decline of feed output was more prominent in relation to the decrease of the number of animals in Serbia. The total poultry feed production was lower by more than 270 thousand tons, i.e. down –7.5% per year. The production of pig feed was down 60%.
The manufacture of feeds included the use of about 70 raw materials and components, with cereals and proteins predominating. More than 90% of fish flour, 65% of soybean meal and about 16% of meat bone flour were imported for the purpose.
175
produced, the animal feed industry requirements were between 37 and 71% of the total production which depended on the prices of the raw materials used.
The results of the feed mills involved in the manufacture of feeds were shown using different indices. The capacity for feed mixing amounted to approx. 450 thousand tons which may be considered 20% of the total capacities installed.
The degree of utilization of the capacity ranged from 1 to 83%. The number of employees was 740 which represented 16% of those employed in this industry. Fixed and working assets were represented by approx. 25%, capital by about 29% and business incomes by 25%. The share of material, energy and service costs in business expenses ranged from 25 to 83%, the share of depreciation from 1 to 14% and gross earnings from 4 to 20%.
The capacity of mills was not the limiting factor likely to hinder feed production output. Raising utilization of the capacities installed tended to have a favourable effect on the financial result (regular wages per worker), especially in mills with capacities over 50 thousand tons. In addition, capacity size had its impact on total income per worker as well. Most of the mills used 11 to 37% of their capacities which reflected itself on low production efficiency.
The high share of fixed assets in the business property points to the fact that most of it accounted for buildings (about 70%) and a smaller portion for equipment (about 16%).
The share of stocks was significant (on average 57%) ranging from 28 to 83%. Short-term demands and disposals were represented by about 40%, and valuable papers by about 2%.
Gross earnings in business expenses amounted to about 9% on average, whereas the share of depreciation ranged from 1 to 10%, i.e. on average about 3%.
Production efficicacy shown as production per worker was very low and amounted to 150 tons annually, and in the mills analyzed it was 29 to 375 tons.
The choice of an optimal production programme may be expected to improve the business result of feed production. Two types of models were developed in order to achieve the goals. They differed with regard to the demands imposed. The models were solved using the linear programming method.
176
obtained in Model I ensured successful business results with a net income of 1.6 billion dinars. The greatest share in the production structure was registered for pig feed (about 53%). The smallest share was registered for cattle feed (about 16%).
However, changes of the feed production structure had a negative impact on the financial result.
The net income obtained from the difference between the production value and variable costs (excluding labor and energy costs) in Model II amounted to over 1.8 billion dinars. The total production value amounted to 3,2 billion dinars.
The manufacture of feed (59,070 tons) involved primarily the use of corn. The value of the corn purchased amounted to 561 million dinars making up to 60.7% of the capital invested for the purchase of raw materials (1.4 billion dinars). Of the proteins used the share of soybean meals predominated and accounted for 21.1% of the total quantities used.
Of the 17 mixtures, the final solution included 6. The following feeds were mutually competitive: complete feed for pigs up to 15 kg and complete feed for chicken fattening I, complete feed for pig fattening (25-60 kg) and complete feed for pig fattening (60-100 kg), complete feed for chicken fattening I and complete feed for chicken fattening II, complete feed for calves up to 100 kg and complete feed for bullock fattening (250-350 kg).
Feed volumes produced in Serbia may decline up to 96400 tons. The most favourable impact on coefficient changes in the constraints were registered on increasing the output of pig feed supplements (9.10 dinars/kg).
R E F E R E N C E S
1. B e k r ić, V. (1999): Industrijska proizvodnja stočne hrane, Institut za kukuruz “Zemun Polje”, Zemun-Beograd.
2. Đo rđe v ić, N., G r u b ić G., V i t o r o v ić D., J o k s i m o v ić- T o d o r o v ić, M., J o k ić, Ž., S t o j a n o v ić, B., D a v i d o v ić, V. (2006): Savremena dostignuća u pripremanju hrane i ishrani domaćih životinja, Biotehnologija u stočarstvu, XVII inovacije u stočarstvu, Beograd.
3. K r s t ić, B. (1991): Organizacija i ekonomika proizvodnje i prerade stočnih
proizvoda, Univerzitet u Beogradu, Poljoprivredni fakultet, Zemun. 4. K r s t ić, B., A n d r ić, J., B a jče t ić, B. (1995): Modeli zemljoradničkih gazdinstava
usmerenih na stočarsku proizvodnju, Aleksandrija – specijalizovana izdanja, Beograd.
177
6. K r s t ić, B., S m i l j a n ić, S. (2003): Teorija i praksa sistemskog pristupa poslovnom menadžmentu u poljoprivredi, Consecco institut, Beograd
7. L učić, Đ. (1998): Modeli za intenziviranje poljoprivredne proizvodnje, Poljoprivredni fakultet, Univerzitet u Novom Sadu, Poljoprivredni fakultet, Novi Sad.
8. N o v k o v ić, N. (1990): Optimiranje poljoprivredne proizvodnje na bazi više kriterijuma optimalnosti, doktorska disertacija, Univerzitet u Novom Sadu, Poljoprivredni fakultet, Novi Sad.
9. R a j ić, Z., C e r a n ić, S., N o v k o v ić, N., L učić, Đ. (2003): Formulisanje ekonomskih modela u prehrambenoj industriji, VII Internacionalni simpozijum: „Menadžment i upravljanje projektima”, Zlatibor.
10. R a d i v ić, I. (2002): Primena linearnog programiranja u poljoprivredi, Potez, Beograd
11. R o d ić, J., V u k e l ić, G. (2003): Teorija i analiza bilansa, Univerzitet u Beogradu, Poljoprivredni fakultet, Zemun.
12. C e r a n ić, S. (2003): Strategijski menadžment, Fakultet za menadžmnent malih preduzeća, Beograd.
13. Š o m ođi , Š. (1979): Optimiranje industrijske proizvodnje krmnih smeša, Doktorska disertacija, Ekonomski fakultet, Subotica.
Received: May 09, 2009 Accepted: June 22, 2009
ZAVISNOST REZULTATA POSLOVANJA FABRIKA STOČNE HRANE U SRBIJI OD ORGANIZACIONO–EKONOMSKIH FAKTORA
V. Stanković1
R e z i m e
Industrija stočne hrane se nakon niza godina dinamičnog razvoja suočava sa nedovoljnim korišćenjem kapaciteta i znatnim oscilacijama cena sirovina i gotovih proizvoda. Istraživanjem je obuhvaćena analiza proizvodnih kapaciteta, njihovog prostornog razmeštaja, promena obima proizvodnje krmnih smeša i sirovina za stočnu hranu, izvoz i uvoz, promena broja zaposlenih i dr. Posebno su analizirani pokazatelji finansijsko– ekonomske strukture, na osnovu kojih je sagledan položaj fabrika stočne
1
178
hrane u odnosu na grupaciju i privredu u celini. Istraživanjem je obuhvaćena i mogućnost unapređenja upravljanja fabrikama stočne hrane. Као rezultat zahteva pojedinih vrsta i kategorija životinja, raspoloživih sirovina, kapaciteta i tražnje određenih krmnih smeša formulisani su matematički i logički modeli. Rešavanjem modela metodom linearnog programiranja stvorene su osnove za uspešno funkcionisanje svih faza u reproduktivnom lancu.