Roughness and oxidation: application to NiO growth on
Ni at 800°C
A.M. Huntz *, B. Lefevre, F. Cassino
1CNRS UMR 8647,LEMHE,Uni6ersity Paris Sud,91405 Orsay, France
Received 29 September 1999; received in revised form 3 March 2000
Abstract
The changes with oxidation time of the oxide outer surface roughness, the oxide grain size and the oxidation rate constantkc
for NiO growth on Ni were studied at 800°C in 1 atm oxygen. The roughness was determined by optical interferometry establishing 2D-profiles and 3D-images. Correlations were found between the variations of the oxide outer surface roughness or thekcvalues and the oxide grain size. These are attributed to the decrease of the oxide grain boundary density with time, which
induces a decrease of the effective diffusion coefficient. © 2000 Elsevier Science S.A. All rights reserved.
Keywords:Nickel oxidation; NiO roughness; Oxidation constant; Oxide grain size
www.elsevier.com/locate/msea
1. Introduction
The growth of NiO has been extensively studied [1,2] mainly because thermal oxidation of nickel gives NiO as the only oxide compound in the film. This offers the possibility of exploring, in a very wide range of temper-atures, the Ni – NiO system which is of great technical importance because nickel is used as the basis or as a major component of numerous alloys for high tempera-ture applications. So, this system is often chosen as a model system [3,4]. One remaining question concerns the relationships between the surface roughness of both the metal and the oxide and the oxidation kinetics and its mechanism. Only a few papers deal with this prob-lem, but it can be expected from Czerwinski et al. [5 – 7] that relationships exist between the change of the to-pography of the oxidegas interface and the mecha-nism of oxide growth. One other interest is that oxide growth, as a diffusion controlled phenomenon, could generate complex surfaces with fractal features [8].
In this work, our goal is to give information about the NiO surface roughness in comparison with
parame-ters which characterise both the oxidation rate (kp) and
the microstructure of the oxide film (particularly the oxide grain size).
2. Experimental
The composition of nickel is given in Table 1. Sam-ples of (10×10×1 mm) were prepared and heated in a high vacuum in order to stabilise the microstructure. Then, most of the samples were mechanically polished up to 3 mm diamond paste (or 3 mm diamond spray in order to compare). Some were chemically polished and etched at 85°C in a bath consisting of 30% HNO3, 10%
H2SO4, 50% CH3COOH and 10% H2O. The average
grain size of Ni is about 175 mm. Thermogravimetric tests (sensitivity of 1 mg) were performed in 1 atm oxygen mainly at 800°C. The sample was heated in the oxidation chamber during 15 min and further results were corrected from the oxidation occurring during this step.
Optical interferometry was performed with a MI-CROXAM profilometer to obtain surface maps, line segment profiles, 2D-profiles and 3D-images, and to evaluate the roughness of the outer surface of the oxide films on the post-oxidised Ni samples. After each oxida-tion time at 800°C, ranging from 15 min to 24 h,
* Corresponding author. Tel.: +33-1-69-156318; fax: + 33-1-69-154819.
E-mail address:[email protected] (A.M. Huntz).
1Present address: Departamento de Fisica, Universidade Federal
de Ouro Preto, 35.400-000, Ouro Preto, MG, Brazil.
Z( =1 n %
n
i=1
Zi
The outer surface of the oxide film was observed and analysed by scanning electron microscopy (SEM) equipped with EDX.
3. Results
The oxidation rate is well represented by a complete law [3,4] given by
t=1 kl DM S + 1 kp
DM S 2 (1)whereklandkp are the oxidation rate constants of the
linear and parabolic processes, respectively. The oxide thickness is calculated by:
xox=
DM·Mox
SMOrox
(2)withMox=74.7 g mol− 1
the molar mass of the oxide,
MO=16 g mol −1
the molar mass of the oxygen atom, rox=6.67 g cm
−3the volumic mass of the oxide. Note
that Eq. (2) assumes that the oxide occupies as much space inzdirection as it needs and that it would be free of stresses [4].
If working with the oxide thickness, the parabolic oxidation rate constantkc is deduced as:
t=1 k%lxox+
1
kc
(xox) 2
(3)
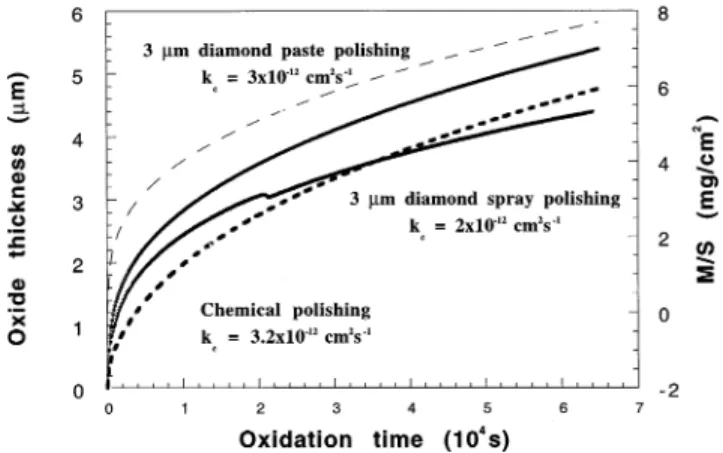
Fig. 1 indicates small changes in the weight gain curves according to the substrate surface preparation. Particularly, the oxide thickness on samples polished with a 3 mm diamond paste is greater than that on samples polished with 3 mm diamond spray or chemi-cally polished. The values of the parabolic oxidation constantkc(Eq. (3)), obtained from the curves in Fig. 1
are given in Table 2. These oxidation constant values correspond to the stable values of kc, after :1 h
oxidation.
outer surfaces of NiO films obtained after oxidation at 800°C of Ni samples, previously polished with 3 mm diamond paste and oxidised during different times. The roughness was measured either on surface areas con-taining several grains of Ni substrate, or within a Ni grain without any grain boundary. It is worth noting that, even after 24 h of oxidation, it was possible to distinguish between the regions of the oxide film formed over the Ni grains surface and the regions of the oxide formed along grain boundaries, as shown below. More-over, in Table 3, values obtained with two different
Fig. 1. Variation of the oxide thickness with the oxidation time at 800°C in 1 atm O2. Ni substrates with various surface preparation.
Oxidation in 1 atm O2.
Table 2
Oxidation parabolic constant andRavalue for Ni oxidation at 800°C Surface Ra value (nm) before
Oxidation parabolic
constantkc(cm2 s−1) preparation oxidation on
811.8×577.7mm 3.2×10⁻¹² Chemical 575.4
polishing
30.2 3.0×10⁻¹² 3mm diamond
paste
3mm diamond 16.5 2.0×10⁻¹²
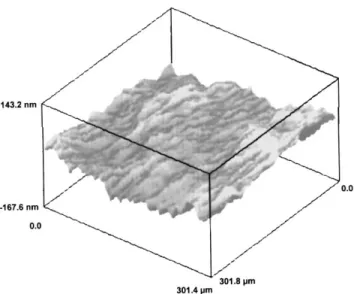
Fig. 2. 3D-images (×10) of the non-oxidised substrate surface after 3mm diamond paste polishing.Ra=17.7 nm, area 301×301mm.
Fig. 3. Oxide surface roughness as a function of the oxidation time in 1 atm O2. Case of nickel oxidised at 800°C after a diamond paste
polishing. Ra measured on areas with and without substrate grain
boundaries (×40).
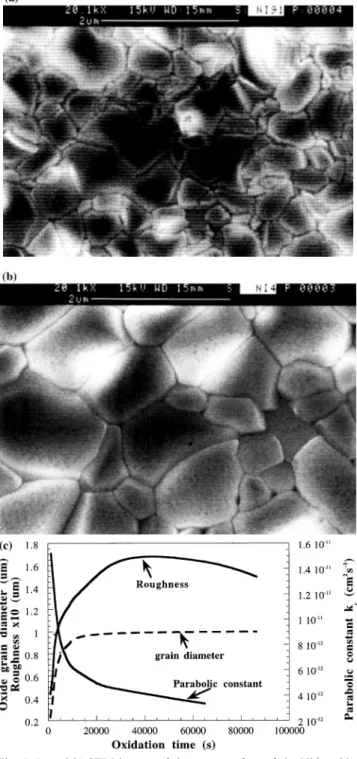
magnifications are given, i.e. with two different measur-ing step sizes. As it would be expected for a self-affine surface, which scales differently in vertical direction (growth direction) and horizontal directions, the rough-ness is slightly greater for smaller measuring step size (higher magnification). It is also observed, (Table 3 and Fig. 3), that, whatever the analysed surface portion, the oxide surface roughness increases with the oxidation time. After a given oxidation time (a few hours), the surface roughness seems to become constant. SEM observations allowed first to check that the oxide is compact and adherent and to measure the oxide grain size which evolves with the oxidation time. Fig. 4(a and b) indicate that, like the roughness, the grain size increases with increasing the oxidation time. After about 3 h oxidation, the oxide grain size does not evolve any more. Simultaneously, the oxidation rate constant determined at various oxidation times de-creases at the beginning of the oxidation. The varia-tions of these three parameters are correlated as shown in Fig. 4(c). The correlation between the roughness and
the oxide grain size is due to the fact that when the oxide film grows (by predominant cationic diffusion), the oxide grain size increases and oxide crystals emer-gence at the outer surface increases too.
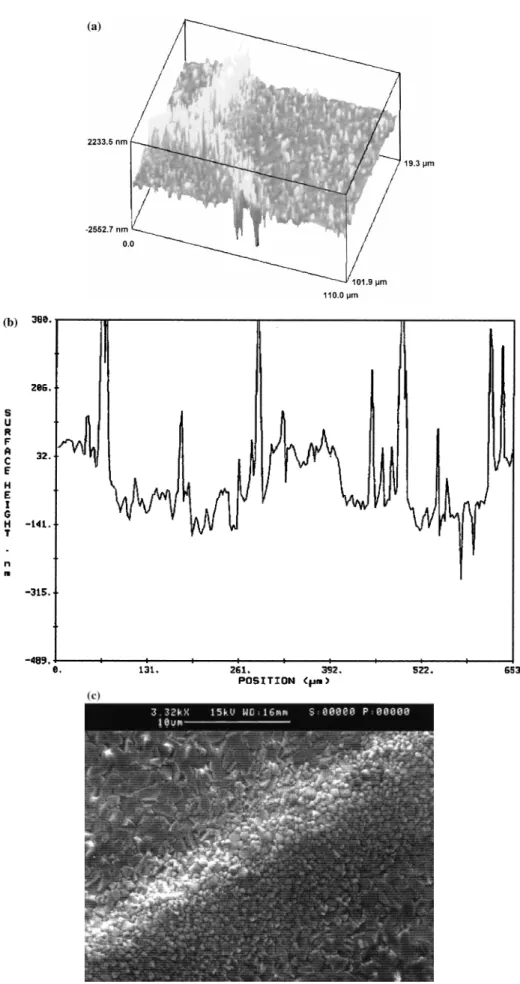
Besides, other important features of the oxide film were observed by surface analysis with optical interfer-ometry. In particular, grain boundaries were found to be the most reactive regions of the oxidised surfaces. Fig. 5(a) clearly shows that the oxide formed over Ni grain boundaries corresponds to walls along substrate grain boundaries. To our knowledge this phenomenon was not mentioned previously. It is confirmed by the 2D-profiles in Fig. 5(b), where the distance between peaks are close to the average diameter of substrate Ni grains. It is also confirmed by SEM observations. Fig. 5(c) shows such protuberances along grain boundaries of the underlying substrate. The size of the grains formed along grain boundaries is two times smaller than the size of the grains formed on the bulk of the substrate grains. It was checked out by accurate EDX analyses that these little grains on the protuberances
Table 3
Average oxide surface roughness values for Ni samples oxidised in 1 atm oxygen at 800°C for different durations
Magnification×10 Magnification×40
Oxidation duration
Rameasured on one substrate Ra measured on several Ra measured on one substrate Rameasured on several
grain (nm)
grains (nm) grains (nm) grain (nm)
27.0 13.8
15 min 44.1 22.2
38.2 23.9
30 min 48.2 32.2
45 min 73.9 27 97.6 88.2
35.6 153.9 109.4
75.3 6 h
163.3
106.7 74.3 154.2
18 h
130.3 149.8
99.3
4. Discussion
Since differences between values for kc, in Table 2,
are in the range of experimental uncertainties, the long time oxidation kinetics (after 1 h) seems to be almost independent from the previous surface preparation of Ni samples. Indeed, due to the small values of Ra
(expressed in nm) the substrate surface is not affected by the substrate roughness variations. It could also be thought that Eq. (1) should be continuously corrected due to the change of the oxide surface related to the oxide outer surface roughness. As suggested by [11], the outer surfaceArof a rough oxide film can be estimated
by
Ar=pf 2
/(4+pfRa) (4)
f being the oxide grain diameter. Thus, results in Fig. 4 allow to continuously correct the DM/S values as-suming that S corresponds to the estimated Ar values.
Once done, it leads to anomalous kinetics curves pre-senting a first step with weight gains and a second one with weight losses. Moreover, the experimental oxide thickness values in Fig. 1 are in good agreement with SEM observations which show oxide film thickness of the same order of magnitude than those deduced from thermogravimetric tests without any corrections of DM/S.
In Fig. 1, it appears that after about 1 h of oxidation, the kinetic curves are almost entirely parallel. The main difference between these curves consists in different initial weight gains. This implies, as expected, that the initial surface roughness of the substrate mainly acts in the first steps of the oxidation process, enhancing the initial weight gain for initially rougher surfaces (see Table 2): the greater the Ni surface roughness, the more important the nickel amount injected in the oxide film. This is due to the fact that NiO growth is mainly ensured by cationic diffusion [2]. New oxide is formed at the oxide outer interface, but the amount of new oxide formed is related to the amount of Ni ions injected at the substrateoxide interface.
Fig. 5. (a) 3D-images (×40) of the oxide outer surface after oxidation at 800°C for 72 hRa=190 nm, area 203×144.4mm. (b) 2D-profile on
18 h oxidised sample (×10), Ra=114 nm, area 811.8×577.7 mm. The distance between peaks is of the same order of magnitude than the
Fig. 6. 3D-image (×40) of Ni oxidised for 15 min at 800°C after 3
mm diamond polishing suggesting an enhanced oxide growth along a dislocation wall of the underlying substrate. Ra=46 nm, area
201.8×143.8mm.
f(24 h)+2Ra(24 h)
These two values are rather similar which confirms the influence of the oxide grain size evolution on kcvalues
during short oxidation times.
However, it is important to note that the contribu-tion of the initial mass gain to the final average thick-ness of the oxide film does not seem negligible. For the samples mechanically polished, it amounts to :15%
(Fig. 1). These differences in thickness may play some role in the mechanical behaviour of the oxide films, under thermo-mechanical loading. This is a very impor-tant point in high-temperature alloy protection.
Comparing our results with those obtained in Refs. [5 – 7], it appears that for undoped nickel a change of the oxide surface roughness Ra is similarly observed.
But, in our work, a stabilisation of the roughness occurs associated with the oxide grain growth and, consequently, with the oxidation constant. Moreover, a linear variation ofRa/xoxversusxoxwas not observed in
our case.
Another important point is that enhanced oxidation is observed, by optical profilometry and by SEM, along grain boundaries and dislocation walls of the substrate. Thus, contrarily to [6], it can be said that linear and planar defects of the substrate have an effect.
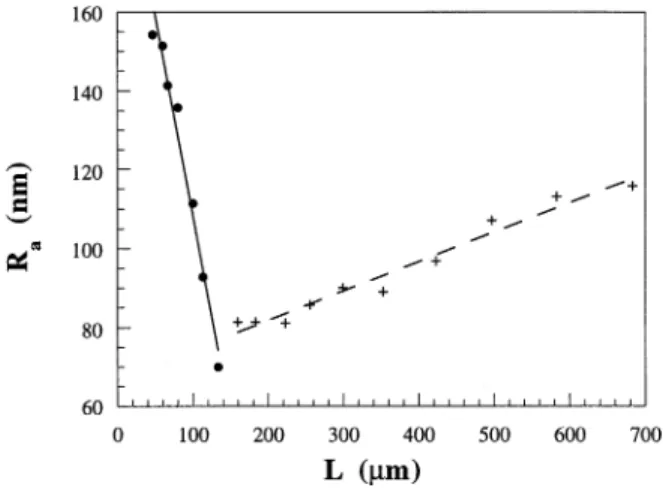
It is now interesting to analyse these results in the light of the fractal theory which can allow to predict the surface change by a scale transformation. The oxide film is characterised by a preferential growth direction, so the growth behaviour should be different along the direction perpendicular to the film, compared to the direction in the plane of the film during an isotropic scale transformation. Basically, the idea of fractal prop-erties of roughness relies on the fact that the estimated value of roughness depends on the size of the measur-ing element, which is the case here (Fig. 7). Indeed, the roughness dependence on the linear size L of the ob-served oxide surface was analysed in the range 50B
LB800 mm. The chosen range for L has some interest
because it contains the average grain size of Ni sub-strate (:175 mm). The results in Fig. 7 suggest that
The kc decrease during the first hour of oxidation,
followed by the stabilisation of the oxidation rate con-stant (Fig. 4) indicates that grain boundary diffusion in the oxide is the predominant oxidation mechanism, as suggested in the literature [2,6,12]. Consequently, grain boundary diffusion is the predominant term in the equation giving the parabolic oxidation rate constant. Indeed, as the oxide grain size f increases (Fig. 4), f, the fraction of atoms diffusing along oxide grain boundaries, commonly given by f=3d/f, d being the grain boundary width, decreases. Finally, in the expres-sion giving the effective diffuexpres-sion coefficient responsible for the oxide film growth, Deff=(1−f)Db+fDgb [13]
(with DbBDgb), the second term decreases, thus kc
which is related to Deff decreases also and stabilises
whenfbecomes constant. Strictly speaking, the
Fig. 8. Parameters describing a fractal surface [16].
The variations of the oxide surface roughness with the oxidation time for various measuring steps are collected in Fig. 9. The fittings of Ra=f(t) with a
power law are not very satisfying, but values of the exponent b are given in Table 4. b is positive as the roughness increases with the oxidation time. Such curves allow to determine with a relative uncertainty
Ra(sat) andtsatwhose values are given in Table 4. Iftsat
increases with L, the linear length of the observed surface, Rsat decreases with L. This would mean that
the exponent z is positive while the exponent a is negative which is not coherent with the positive value of the exponent b.
Thus, on the basis of the obtained results, it is not possible to conclude on the fractal character of NiO growth, probably because the surface behaves differ-ently according to the value ofLfor the measurements (see Fig. 7).
5. Conclusions
The study of the parabolic oxidation rate constantkc
for the NiO growth on Ni at 800°C, of the oxide grain size and of the outer surface roughness with oxidation time led to the following remarks.
During the first hour of oxidation, these parameters change and then stabilise: kc decreases while the oxide
grain diameterf and the oxide outer surface roughness increase. Thekcdecrease is correlated to thefincrease,
i.e. to the decrease of the oxide grain boundary density which induces a decrease of the effective diffusion coefficient in the oxide film.
At the beginning of the oxidation, there is a differ-ence in the oxidation rate according to the substrate polishing conditions. The greater the substrate surface roughness, the greater the oxidation rate, due to the enhancement of the amount of Ni injection in the oxide films.
The oxidation rate does not depend on the roughness of the oxide outer surface.
Enhanced oxidation is observed along grain boundaries and dislocation walls of the substrate.
The oxide surface roughness changes with the oxida-tion time until it reaches a saturaoxida-tion value. It also evolves with the linear length of the observed surface and two domains are observed for this variation.
Acknowledgements
Thanks are due to F. Kherbouche and B. Poumellec who gave us advice on the use of the interferometric profilometer in ‘Chimie des Solides’ Laboratory, Orsay, and to D. Deydier who performed some of the experiments
Fig. 9. Ra of the NiO outer surface for different observation sizes
versus the oxidation time of Ni at 800°C. Table 4
Values of thebexponent (Ra8tb), ofRa(sat)andtsat(deduced from
Fig. 9).
Magnification×10 Magnification×40
b 0.21 0.13
Ra(sat)(nm) 146 166
293
tsat(min) 134
two roughness behaviours occur for two different scale domains, with a crossover close to the average grain size of the substrate.
In order to characterise a fractal surface, several parameters must be considered [14] (Fig. 8): the fractal local dimension which characterises the variation of a measurement during a scale transformation, the linear lengthL, the roughnessRaand the correlation lengthj
which corresponds to the average distance between two peaks. The theory of fractal surface growth indicates that the two last parameters vary with the growth time according to a power law [15,16]:Ra8tbfortBtsat,tsat
being the time at which Ra takes a constant value
Ra(sat), and Ra=Ra(sat) for t]tsat.
Moreover, the roughness and the saturation time depend on the measuring step sizeL, i.e. on the size of the linear length of the observed surface: Ra(sat)8L
a
and tsat8L
zwith z=
a/b.