Mat. Res. vol.5 número3
Texto
Imagem


Documentos relacionados
The changes with oxidation time of the oxide outer surface roughness, the oxide grain size and the oxidation rate constant k c1. for NiO growth on Ni were studied at 800°C in 1
These were chosen to allow for a direct comparison among substrates produced at a given pretreatment condition (205°C for 5 min using acid-impregnated chips) and to assess the effect
The samples heat treated at temperatures of 800 to 1150 °C also displayed Mössbauer spectra with the same two cen- tral doublets found in the sample treated at 750 °C.. In addi- tion,
Figure 1 shows the XRD patterns of the as-synthesized magnesium oxide and MAS powders obtained by heat treatment of the precursors at 800 and 1200 °C for 2 hours,
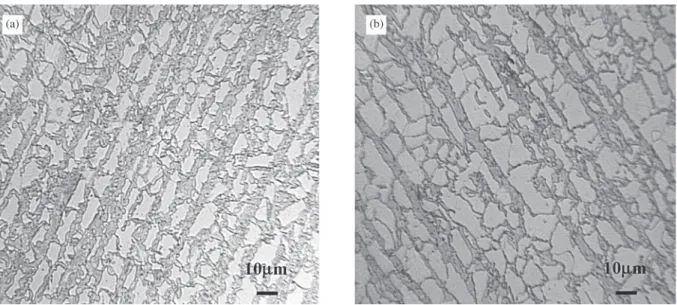
The microstructures of the materials after annealing are shown in Figure 6 by orientation map. Both sheets of steel have a fully ferritic microstructure and the average grain
The prior recrystallization in 430Nb steel and its lower ferritic grain size can be related to three diferent factors: the lower annealing temperature and the higher content
In this paper, we present a version of the Invariance of Domain Theorem for nonlinear Fredholm maps of index zero between Banach spaces (or, more generally, Banach manifolds).. To
Figure 20 - The effect of annealing on the silver surface is shown on SEM*. The most interesting situations are shown here. 5 μm Parylene deposition; c) Sappi paper; d) Sappi
