Porous ternary Fe-based catalysts for the oxidative
dehydrogenation of ethylbenzene in the presence
(absence) of carbon dioxide
Nuryana A. Ferreira,aJosu´e M. Filhoband Alcineia C. Oliveira*a
Porous ternary Fe-based catalysts were characterized and their catalytic properties through the oxidative dehydrogenation of ethylbenzene in the presence (ODH) or absence (DH) of carbon dioxide were investigated. The catalysts were characterized by X-ray diffraction (XRD), chemical analyses, thermoprogrammed reduction (TPR), physisorption measurements, Raman spectroscopy and scanning electron microscopy coupled to energy-dispersive X-ray spectrometry (SEM-EDX). The kinetic modeling of reverse water gas shift reaction (RWGS) and the effects of reaction parameters, such as reaction temperature and CO2/H2ratio on the catalytic activity, were also investigated. The addition of Zn, La, Mg or Ni promoters to a porous Fe-based solid greatly enhanced the ODH reaction, whereas that of the RWGS is favoured by Ni promotion. The CO2/H2 ¼ 1 ratio and temperature of 850 K were the best conditions for RWGS occurrence. The implications of these conditions on catalyst application for ODH and DH reactions were discussed. Ethylbenzene conversions were too low due to the decreased textural properties of some catalysts as well as the selectivity to styrene is inhibited. A porous FeAlZn catalyst exhibited higher catalytic performance than the other ternary solids in terms of the ethylbenzene dehydrogenation and resistance against deactivation, whereas low RGWS conversions were observed under the abovementioned conditions.
1.
Introduction
The chemical recycling of carbon dioxide from combustion sources is a sustainable energy process because it allows for the strategy of capture and storage of CO2in reducing its emissions. In this sense, the use of CO2 as a mild oxidant in catalytic reactions has been strongly encouraged. Moreover, alternative technologies for using carbon dioxide, such as wet partial oxidation or autothermal reforming, propane dehydrogenation, ethylbenzene dehydrogenation, and dry reforming, among others,1–3 represent the further remarkable economic
advan-tages of CO2consumption.
In additional, the growing concern about styrene production costs has directed the interests of researchers toward the devel-opment of the oxidative dehydrogenation of ethylbenzene in the presence of carbon dioxide (ODH). Styrene is a highly valuable monomer used for polymeric polystyrene resins and styrene– butadiene rubber production.1–11 However, the commercial
process of the direct-steam dehydrogenation of ethylbenzene (DH) to styrene leads to the use of a large amount of superheated steam.
Another limitation of the process is the low selectivity to styrene due to the formation of benzene and toluene as by-products, in addition to thermodynamic equilibrium limita-tions.6–10 Thus, an ODH reaction in the presence of carbon
dioxide offers advantages over a DH reaction, owing to CO2 reducing the energy consumption, accelerating the reaction rate, prolonging catalyst lifetime, enhancing selectivity, and alleviating thermodynamic constraints; moreover, it could indeed drive the process towards green chemistry.1–10
The ndings state that the DH reaction is coupled with reverse water gas shi(RWGS). Because the RWGS reaction is
mildly endothermic with an enthalpy of 41.1 kJ mol 1, the reaction is carried out at low temperatures. This makes the coupled process of an ODH reaction slightly endothermic, compared with that of DH.9Although the isolated RWGS
reac-tion has no such difficulties, the catalytic stability is oen poor. Thus, the solid is still not yet sufficiently developed for indus-trial application, although it has been widely investigated on a laboratory scale. In additional, RWGS reaction occurrence is undesirable for ethylbenzene dehydrogenation, dry reforming, and propane oxidation, among other reactions, due to the low yield of the products from these reactions.5,12–14 Indeed, the
kinetics of the RWGS reaction is studied at a low conversion and high hydrogen partial pressure and the reaction should be limited by dissociative CO2adsorption.
aUniversidade Federal do Cear´a, Campus do Pici-Bloco 940, Fortaleza, Cear´a, Brazil.
E-mail: alcineia@ufc.br; Fax: +55 85 33 66 9982; Tel: +55 85 33 66 90 51
bUniversidade Federal do Cear´a, Departamento de F´ısica, Fortaleza, Cear´a, Brazil.
Fax: +55 85 33 66 94 83; Tel: +55 85 3366 94 83
Cite this:RSC Adv., 2015,5, 20900
Received 15th November 2014 Accepted 3rd February 2015
DOI: 10.1039/c4ra14572k
www.rsc.org/advances
PAPER
Published on 03 February 2015. Downloaded by Federal University of Ceará on 6/26/2018 2:55:59 PM.
The systematic exploitation of dehydrogenation of ethyl-benzene coupled with RGWS would accomplish signicant efficiency in styrene production and reduction in carbon dioxide emissions. A great deal of insight into the coupling reaction has been acquired by studying the catalytic activities of various solids based on iron oxides. Nanostructured Fe-containing promoters, such as alumina, zirconia or ceria, have shown good performance for catalyzing the oxidative dehydrogenation of ethylbenzene (EB) with CO2. It is note-worthy to mention that the activity ofin situFeAl2O4 spinel-phase formation motivated us to investigate the catalytic properties of a FeAl solid by adding a third element in the catalyst composition.10As the stability of the FeAl
2O4phase in an ODH reaction is limited, owing to carbonaceous deposition, there is a need to develop new catalyst systems that allow for the uniform dispersion of the active phase, as well as high stability and driving the redox mechanism of the titled reaction to avoid an isolated occurrence of RGWS reaction. The addition of La, Mg, Zn or Ni in the Fe-based solids is expected to minimize the deactivation by phase transformation effects.
Thus, the aim of this study is to investigate the performance of nanostructured FeAlZn, FeAlLa and FeAlNi catalysts for styrene production. FeMgZn is used for comparison purposes. In addition, a deep comprehension of the DH and RWGS reaction conditions for improving the reaction yields or avoiding their occurrence is highly desirable, depending on the investigative focus. This study presents kinetic modeling and catalytic results for evaluating the effect of temperature and CO2/H2ratio on the catalytic properties of Fe-based cata-lysts through RWGS and DH reactions. The investigations of the adsorption and deactivation constants, as well as the rate of the RWGS reaction in different temperatures, are also studied by the model.
2.
Experimental
2.1. Catalyst preparation
The mixed oxides were prepared by the precipitation method using aluminum tri-sec-butoxide (Al(OC4H9sec)3) and ferric nitrate Fe(NO3)39H2O as precursors.10In brief, aluminum tri-sec-butoxide wasrst dissolved into an excess of isopropanol and vigorously stirred at 333 K until the solution became homogeneous. Then, a mixture of 2.9 mol of water, ferric nitrate, and 6.5 mol of absolute ethanol together with lanthanum nitrate solution was added to the stirred mixture of aluminium through a peristaltic pump. The reactants were maintained under constant stirring and reuxing for 24 h. The gel was subsequently washed with ethanol, dried at room temperature and calcined at 873 K under airow at a heating rate of 5C min 1for 2 h. The abovementioned methodology was used to obtain the FeAlLa. Other solids, such as FeAlZn, FeAlNi and FeMgZn were also prepared, in which zinc, nickel and magnesium nitrate, were the active component precursors. The metal contents measured by chemical analyses were 60 : 20 : 20 mol%, respectively, for iron, aluminium and the third metal added to the solid.
2.2. Characterization
X-ray diffraction patterns (XRD) were measured on a PANalytical X'PERT HighScore X-ray diffraction equipment, under the following conditions: Cu target Karadiation, scanning step of 0.02, scanning rate of 0.1, and scanning current and voltage of 20 mA and 30 kV, respectively. The diffractograms were compared with those of JCPDS (Joint Committee on Powder Diffraction Standards).
Inductively Coupled Plasma Optic Emission Spectroscopy (ICP-OES) was performed with a Varian apparatus. Previously, the solids were digested with an equimolar mixture of nitric and hydrochloric acids at 90C in a sand bath. The actual metallic content of the solids was then determined by ICP-OES.
The adsorption–desorption isotherm experiments were carried out with an ASAP 2000 Micromeritics instrument to determine the specic surface areas and pore structure parameters of the solids. The probe molecule was nitrogen at 77 K in a surface area analyzer. Samples were degassed at 423 K for 12 h prior to measurement. The BET equation was used to calculate the total specic surface areas of fresh and spent catalysts. The pore distributions and surface areas of mesopores were calculated by the Barrett–Joyner–Halenda (BJH) method from the desorption branch of the isotherms.
The morphological aspects of the sample were determined by Scanning Electron Microscopy (SEM) measurements using an FEG Quanta 450 electron microscope equipped with an EDS Bruker QUANTAX system coupled to the SEM microscope, using an acceleration voltage of 2 kV.
Temperature programmed reduction (H2-TPR) experiments were performed with homemade equipment using a quartz tube reactor possessing an inner diameter of 6 mm coupled to a thermal conductivity detector (TCD) for monitoring hydrogen consumption. The mass of the catalyst was 50 mg, and the experiment was carried out in the range of 323–1273 K. A mixture of 8% H2/N2was used as a reducing gas with a rate of 100 mL min 1, aer passing through a 13 molecular sieve trap to
remove water. Before the analysis, samples ofca.0.1 g were placed in a tube reactor and heated under nitrogen at 373 K for 2 h.
The spent catalysts were characterized by Raman spectros-copy. The Raman measurements were obtained on a LabRam spectrometer (JobinYvon) under ambient conditions. A 532 nm argon ion laser was used as the exciting source on the sample surface with a power of 2 mW. Ten accumulated spectra were obtained in each spectral range, and the spectral resolution was 3 cm 1in the 5–2000 cm 1range. The Olympus lens focus was at 100 times magnication.
2.3. Catalytic testing
The dehydrogenation of ethylbenzene by CO2 was carried out under steady-state conditions in a quartzxed-bed reactor. The reactant mixture was composed of carbon dioxide and ethyl-benzene at a 30 : 1 ratio. The ow rates used were N2, 11.7 mmol h 1; CO2, 58 mmol h 1; and EB, 1.98 mmol h 1 (CO2/EB molar ratio of 30). The catalyst (50 mg) was crushed and activatedin situunder aow of nitrogen and was heated from room temperature to 823 K over the course of 1 h to
remove any gaseous impurities from the surface of the catalyst. The reaction was performed under atmospheric pressure at a temperature of 823 K, as previously dened by theoretical and experimental studies.5 The product was analyzed by gas
chro-matography (GC) using a simple chrome chromatograph equipped with ame ionization detector (FID) and thermal conductivity detector (TCD). GC analyses were carried out at isothermal conditions from 295 to 523 K at a rate of 283 K min 1 and an injector temperature of 523 K.
The conversion and selectivity were dened in the following manner:
%EB conversion¼EBin EBout
EBin
100 (I)
%EB selectivity¼ mol of desired product
mol of reacted ethylbenzene100 (II)
Prior to the catalytic tests, modeling of DH5 and RWGS reactions without the catalyst was performed to identify the best reaction conditions to perform the experimental analyses.
2.4. Model
The modeling of the experimental data is well suited to quantify the kinetic and thermodynamic effects of the RWGS reaction without using the catalysts. To include possible temperature, H2/CO ratio and pressure effects on the Fe-catalyzed RWGS reaction, it is necessary to model the data. Thus, the thermo-dynamic–kinetic assessment was implemented and solved in the C++ program in the 400–1100 K temperature range. The reaction rates have been taken into consideration for dening the optimal conditions to operate the reaction.
2.4.1. Kinetic modeling.The kinetic model considers that the reverse water gas shireaction (RWGS) is formally regarded
as a single-step surface reaction (reaction (III)). CO2is assumed to be directly transformed into carbon monoxide and an oxygen radical by dissociative adsorption (reaction (IV)):
CO2(g) + H2(g)#CO(g) + H2O(g),
DH298.15 K¼41.17 kJ mol 1 (III)
CO2(g)#CO(g) + Oc (IV)
Hence, the rate of carbon dioxide consumed, r0
CO2, is proportional to carbon monoxide produced,r0
CO, with reaction (IV) being the determining step of the reaction:
r0
CO2 ¼r
0
CO¼kCO2
PCO2CV
PCOCOS
KCO
(1)
wherekCO2is the kinetic constant of velocity for CO2, andPCOis
the partial pressure of CO. The ratio between the adsorption and desorption constants of CO is given asKCO. In addition, it is assumed that the total amount of active sites occupied by oxygen atom and the number of active surface sites available per catalyst mass is equal toCOSandCv, respectively.
Therst approach used for RGWS reaction assumes the fact that the adsorbed oxygen reacts with hydrogen from the gas
phase, derived from the Eley–Rideal mechanism expression, as given below in reaction (V):15
H2(g) + Oc#H2O(g) +c (V)
Thus, the rate of water produced and consumed, r0
H2O, is expressed in eqn (2):
r0
H2O¼kH2O
PH2CV
PH2OCV KH2O
(2)
In a second approach, the kinetics for the system under study adopts the steady-state condition for RWGS reaction, in which the rate of distinct and discreet site generation is zero and the following expression is presented for the rate of carbon dioxide:
r0
CO2¼
kCO2CT
PCO2
PCOPH2O PH2KCO2KH2O
1þ PH2O PH2KH2O
(3)
Eqn (3) can be simplied by considering thatkCO2is the ratio
between adsorption and desorption constants because the former constant is much higher than the second constant, the expression is summarized as:
r0
CO2 ¼kCO2PCOCT (4)
2.4.2. Adsorption constants. Most simulation studies employ previously published adsorption constant expressions for similar catalysts in the RWGS reaction. The dependence of temperature on the adsorption of water and CO2constants can be calculated based on the following equations
KH2O¼K
*
H2Oexp
" DHH2O
R
1 T
1 298:15
#
(5)
KCO2 ¼K
*
CO2exp
" DHCO2
R
1 T
1 298:15
#
(6)
where KH2O and KCO2 are the adsorption of water and CO2
constants, respectively; and K*
H2O and K
*
CO2 values are 3.52 1041 bar 1 and 1.24 1069 bar 1, respectively. The enthalpy values for water and CO2 at 298.5 K (DHH2O and DHCO2) are
393.5 kJ mol 1and 393.8 kJ mol 1,16respectively.
The term used to quantify the attenuation of the velocity rate by of CO2 and water adsorption on the catalyst surface,q, is given in eqn (7)
q¼ 1
1þKH2OfH2OþKCO2fCO2
(7)
Accordingly, the term used to quantify the attenuation of the velocity rate by of CO2 and water desorption on the catalyst surface,qd, is described in the following manner in eqn (8):
qd¼ 1
1þ ðKH2OÞdfH2Oþ ðKCO2ÞdfCO2
(8)
wherefH2O and fCO2 represent the fugacity of water and CO2,
respectively. The values of K*
H2Od and K
*
CO2d are 2.02 10 3
bar 1and 9.8910 3bar 1, respectively. The enthalpy values for water and CO2 at 298.5 K (DHH2Od and DHCO2d) are
41.3 kJ mol 1and 204.0 kJ mol 1, respectively.16–18These values
were also used to determine the terms that quantify both the water and CO2adsorption capacities during the deactivation of the catalyst, particularlyKH2OdandKCO2d.
By summing up the reaction rates, the values of the kinetic constants for adsorption,q, and desorption,qd, are determined
in eqn (9) and (10).
k0
a¼kaqa (9)
k0
d¼kdqd (10)
It is important to note thatkaandkdare previously deter-mined by eqn (4) at 850 K, being 0.32 s 1 and 0.33 s 1, respectively.
The velocity rate of RGWS is also predicted by varying the partial pressure of carbon dioxide and hydrogen to obtain optimal conditions for CO2/H2trough reaction (III),18as shown in eqn (11).
rRGWS¼ 32210 6e 73600 RT P
T3pH2PCO2 (11)
2.4.3. Experimental results in RWGS.Experimental results in RWGS were carried out by using the most active solids. The Fe–Co-based catalyst, possessing a metal-to-iron ratio of 3 was synthesised according to a method previously reported15and
calcined at 873 K under airow. This catalyst was chosen due to its excellent structural and textural properties, which promoted the dry reforming of methane19and it showed to be a potential
catalyst for RWGS.
The reverse water gas shi reaction was carried out in a microcatalytic system in a quartz tubular xed-bed reactor. About 150 mg of catalysts were used with the reactor operating at various temperatures and a mixture of 5% CO2/N2 in a hydrogen atmosphere was introduced into the catalyst bed using aow of 40 mL min 1. The H2/CO2molar ratio was 1 : 1, and the products of the reaction were analysed in a Varian chromatograph. Previously, the catalysts werein situactivated at 873 K under 5% H2/N2for 1 h.
3.
Results and discussion
3.1. Characterizations of the catalysts
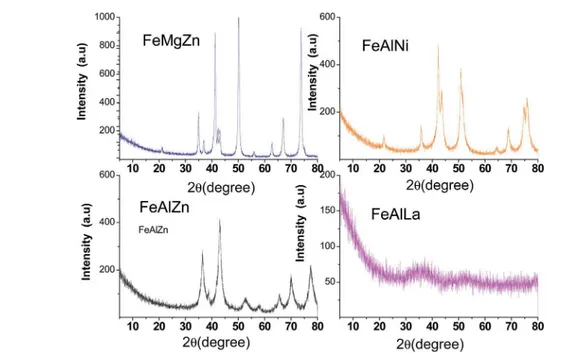
3.1.1. XRD, textural properties and SEM-EDX.Fig. 1 shows the XRD patterns of the catalysts. All the XRD patterns possess relatively high intensity lines describing the crystalline char-acter of the solids, except for FeAlLa. The latter exhibits diffuse diffraction peaks at 2q ¼ ca. 35, which is attributed to the
typical amorphous character of La2O3–Al2O3.20 In additional, the characteristic diffractogram of FeAlLa could be attributed to La2O3 (JCPDS, 05-0602), LaAlO3(JCPDS 85-1071) or LaAl12O19 (JCPDS, 77-0335) phases or yet g-Al2O3 (JCPDS, 10-04625). However, due to the broadness of the peaks, their presence is not determined. In addition, the reections belonging to iron phases are not observed, which is probably due to their nano-metric sizes or good dispersion in the La2O3–Al2O3matrix. This feature is commonly found in materials prepared by the sol–gel and nanocasting methods.21,22
It is evident that FeAlZn has diffraction peaks assigned to g-Fe2O3 (JCPDS 39-1346), ZnO (JCPDS, 89-0510) and g-Al2O3 (JCPDS, 10-04625). Mixed-oxide phases such as ZnAl2O4 or ZnFe2O4, Fe2O3–Al2O3 could be formed, but calcination temperatures are too low to obtain these mixed oxides. The XRD pattern of FeMgZn displays MgO (JCPDS 18-1022), in addition to
Fig. 1 XRD patterns of the fresh catalysts that were studied. The solids were calcined at 873 K under air.
those of ZnO andg-Fe2O3. The diffraction lines do not show any diffraction peak relative to MgFe2O4 due to the low heating temperature of the solid to generate this phase.23For FeAlNi,
peaks ascribed to NiO (JCPDS 75-0197) andg-Fe2O3are visible, whereas those of a-Fe2O3 (JCPDS 79-1741) are obscurely observed. The reections of NiAl2O4 and FeAl2O4 cannot be ruled out, and this implies that these generated spinel oxides
compounds are highly dispersed over the bulk. Particle sizes estimated by the Scherrer equation show the nanosized features of the FeAlLa and FeAlZn, whereas the aggregation of FeMgZn and FeAlNi particles implies that the solids have large sizes.
The chemical analyses by ICP-OES results show that the obtained oxide composition is close to that predicted theoreti-cally and corresponds to 68 wt% of Me1, whereas 16 wt% for that of each Me2 or Me3 specie. If one considers all oxides having or Me1Me2Me3general formulae, the percentage of the elements matches well with the calculated values.
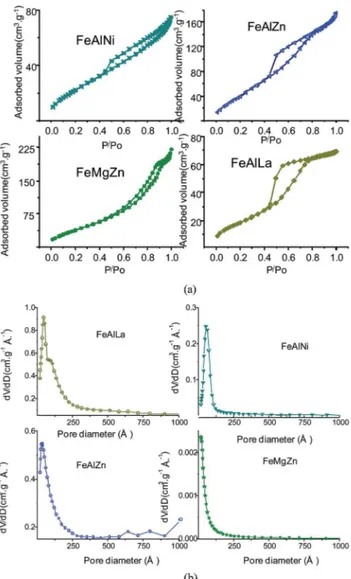
Nitrogen sorption isotherms show that FeAlLa, FeAlZn and FeAlNi catalysts have type IV isotherms with the hysteresis loop between H2 and H3 (Fig. 2), which is typical of mesoporous solids.
FeMgZn is an exception because its isotherm has a type II feature sorption curve. The specic surface area (SgBET) and pore volume (Vp) of FeAlLa are the largest among the oxides studied (SgBET¼70 m2g 1;Vp¼0.10 cm3g 1;Dp¼39˚A), as illustrated in Table 1. This might be due to their oxides being uniformly dispersed as nanocrystallites that are not observed by XRD. FeMgZn catalyst has a rather low surface area (ca.46 m2g 1), and the other textural parameters, such asVpofca.0.10 cm3g 1 and pore diameter of 11˚A, as well, indicate that this solid is microporous and possesses larger particle sizes. Furthermore, the pore diameters of FeAlZn and FeAlNi are reasonably large, and both SgBETand pore volumes slightly decreased.
The differences among the SgBET of the solids are not signicant, rendering it a highly suitable surface area for solids obtained by the sol–gel method.21,24 The particles sizes measured by XRD follows the same trends of the textural parameters values; moreover, the sintering effects during the calcination process could reduce the textural properties of FeAlNi and FeMgZn. This is in line with their particles sizes values of 21 and 44 nm, respectively, which are measured by XRD.
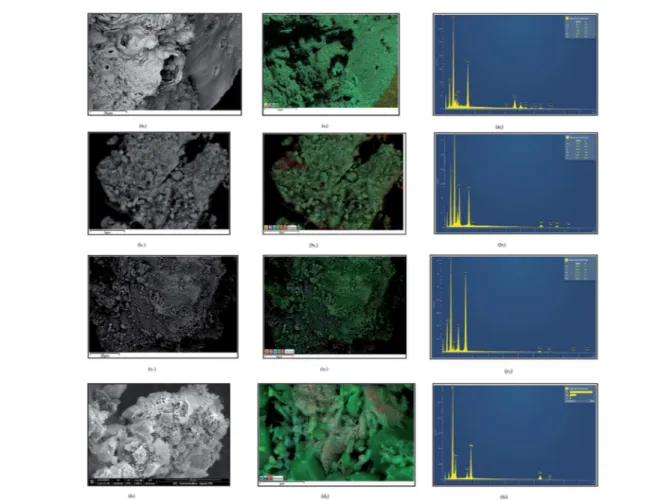
SEM-EDX images of the solids are illustrated in Fig. 3. The morphology of FeAlLa (Fig. 3a1 and a2) exhibits a platelet of LaAl-containing phases (e.g., La2O3–Al2O3, La2O3or LaAlO3 or yet g-Al2O3), in which the g-Fe2O3 nanoparticles are mostly dispersed. This result indicates that FeAlLa appears to be composed of small particles of iron with size ofca.2–20 nm, and the mean particle size of 30 nanoparticles is about 15 nm. This is further conrmed by EDX analysis that displays the uniform dispersion of iron nanoparticles on the La–Al surface Fig. 2 (a) Nitrogen adsorption isotherms of the fresh catalysts. (b) The
corresponding BJH pore-size distribution of the solids.
Table 1 Textural parameters obtained from the nitrogen adsorption–desorption isotherms. SgBETis the specific surface area calculated from the BET method in a relative pressure range of 0.05–0.2;Vpis the total volume calculated at a relative pressure of 0.99;Dpis the pore diameter at maximum of the pore-size distribution calculated by the BJH method from the adsorption branch. Ethylbenzene conversion and styrene selectivity were obtained using 50 mg of fresh catalyst at 823 K, CO2/EB molar ratio of 30 for 5 h
Catalyst La(nm) Sg
BET(m2g 1) Vp(cm3g 1) Dpb(A)˚ EB conversionc(%) Styrene selectivityc(%)
FeAlNi 21 52 0.07 17 10 2
FeMgZn 44 46 0.06 11 6 100
FeAlZn 16 61 0.08 20 25 99
FeAlLa — 70 0.10 39 17 95
aFrom the (311) re
ection ofg-Fe2O3observed by XRD.bFrom the desorption branch of the isotherms.cSteady-state condition.
(Fig. 3a), which is consistent with the XRD and textural prop-erties results.
On the other hand, the morphology of FeAlNi is markedly different from other solids. Plate-like crystallites are clearly visible (Fig. 3b1 and b2). The crystallites are believed to be composed ofa-Fe2O3,g-Fe2O3andg-Al2O3, as suggested by EDX analyses. The increased magnication to examine the plates shows that the homogeneously dispersed particles of NiO are on their surfaces. These results are in line with XRD measurements.
The SEM-EDX micrographs of FeAlZn reveals well-formed, thin plate-like crystals with sharp edges (Fig. 3c1 and c2), which are indicative ofa-Fe2O3 or g-Fe2O3 and g-Al2O3 pres-ence. The existence of some of these phases is suggested by XRD. In additional, it is clearly observed thatnely dispersed ZnO crystallites are superposed in the platelet at a size ofca.100 nm, in line with XRD analysis. These features are associated with the elevated textural properties of the solid. In addition, a small amount of carbon from the aluminum precursor was found on the Al-containing samples.
From Fig. 3d1 and d2, it can be observed that FeMgZn is formed by a small agglomeration of particles, which are superposed in a platelet. It consists of rather heterogeneous, large spherical-like particles with a mean size of 50 nm. These results are consistent with the crystallite size included in Table
1, which are obtained from XRD. They are also in agreement with the previous N2physisorption results that show the lowest textural properties for FeMgZn. Additional EDX analysis conrms the non-uniform distribution of MgO, ZnO and g -Fe2O3in some regions.
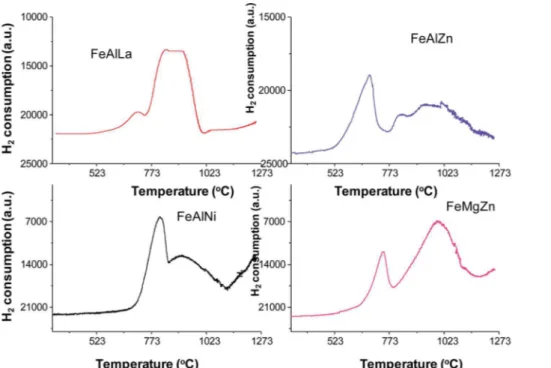
3.1.2. TPR analyses. TPR curves were obtained to deter-mine the reducibility of the ternary oxide catalysts, as shown in Fig. 4.
The curves show two major peaks with maxima at low temperatures, centered at around 811 K, and a high-temperature reduction peak at 920 K, as for FeMgZn. It should be assumed that the TPR proles ofa-Fe2O3andg-Fe2O3 relate arst-reduction process of Fe3+to Fe2+at around 673 K, whereas a second peak at about 723 K is ascribed to the reduction of Fe2+to metallic Fe.9,21Furthermore, pure ZnO and
MgO do not reduce at temperatures as low as 1073 K.25,26As the
temperatures of reduction take place at higher temperatures than those of the literature, the reduction of the iron species could be delayed due to a synergic interaction between iron, magnesium and zinc, favoring the redox properties of the material. Another possibility is the interaction between surface iron and MgO and ZnO species, forming other compounds in a reduction environment.27In addition, a third reduction peak up
to 1073 K is suggested by TPR curve of FeMgZn. This curve could be attributed to the direct reduction of nely dispersed
Fig. 3 SEM images of the fresh catalysts: FeAlLa (a1and a2), FeAlNi (b1and b2), FeAlZn (c1and c2) and FeMgZn (d1and d2). The EDX images are represented by a3, b3, c3and d3for FeAlLa, FeAlNi, FeAlZn and FeMgZn catalysts, respectively.
MgFe2O4 or ZnFe2O4 phases; these species show elevated temperatures of reduction on comparing with their bulk counterparts because they are strongly interacting with the support.28,29
Because g-Al2O3, La2O3, LaAlO3 or LaAl12O19 or even Al2O3–La2O3phases do not exhibit reduction peaks at temper-atures as low as 1273 K, the aforementioned reduction peaks of FeAlLa are associated to thenely dispersed iron-oxide reduc-tion on the Al2O3and/or La2O3matrix. The latter enables the difficulty of iron-oxide reduction in the catalyst and thus decreases its degree of reduction, compared with FeMgZn.
The TPR prole of FeAlZn exhibits an asymmetric peak atca.
680 K, which can attribute for the reduction ofg-Fe2O3to Fe3O4. A broad peak in a much wider range from 440 to 943 K consists of two components with maxima atca.766 K andca.877 K and corresponds to the reduction of Fe2+to Fe0, respectively. With regard to this point, it should be emphasized that the reduction of magnetite to metallic iron is affected by the ZnO presence, probably due to FeO (wustite) formation,9 whereas FeAl
2O4 reduction does not occur in concomitance with that of other iron or zinc species.
The TPR prole of FeAlNi obviously displays that the reduction peaks of iron species shis to the higher temperature and exhibits a remarkable broadening of the hydrogen uptake peak due to the formation of reduced metallic iron reduction over nickel aluminate or iron aluminate supports. According to thendings, both iron and nickel aluminate are formed by a solid-state reaction betweeng-Al2O3and iron or nickel coun-terparts under moderate temperatures and oxidative environ-ments.30–33Typically, pure NiO is characterized by a single TPR
peak at 573 and 673 K.34–36In addition, the peak position of
water formation is not visible over all solids due to the detector
limitation. Combining with the XRD results, the latter peak is not visible because it can be mainly dispersed in the solid matrix as nanoparticles.
3.2. Catalytic results in the dehydrogenation of ethylbenzene in the presence (absence) of CO2
The catalytic performance is evaluated by the dehydrogenation of ethylbenzene to styrene over various catalysts. Blank runs provided almost negligible conversion aer 5 h of reaction time
in the absence of CO2, whereas its presence gave 2% conversion. Fig. 5a shows the overall conversion and selectivity obtained in 5 h of reaction time, when CO2is co-fed in the reaction.
The conversions are high (e.g., up to 10%) in 1 h of reaction time over all solids. A possible reason for this performance is the cracking of ethylbenzene molecules due to the thermal effects at the beginning of the reaction.9,21 The behavior of
solids follows distinct trends as the reaction proceeds. FeAlNi retains 10% of the conversion along with the reaction time, whereas FeMgZn does not display signicant catalytic activity in the same testing period, and its conversion gradually decreases with stabilization at 6% in the steady state (Table 1).
Judging from the fact that FeAlNi and FeMgZn possess the same active Fe3+/Fe2+sites fromg-Fe2O3and that their textural properties (Table 1) are closer, the catalytic behavior can be rationally explained by the presence of their promoters. The
ndings31,32 proposed a mixed acid
–basic and reduction– oxidation mechanism for the reaction. There is a formation of p-adsorbed intermediate on Fe3+, which is a Lewis acid center obtained froma-Fe2O3. This step is followed by the elimination of two hydrogen ions from two C–H ethylic groups on basic centers; the subsequent electron transfer to Fe3+ results in Fig. 4 TPR profiles of the fresh catalysts.
styrene and H2 production. Bonmet al.reported that33bulk Fe-containing ZnO oxides are seen as active phases for ethyl-benzene conversion in the presence of steam because of the interaction between the acidic ZnO and a-Fe2O3, forming ZnFe2O4. Nevertheless, the activity decreases signicantly with Zn2+sites in the iron-based catalysts in the dehydrogenation of ethylbenzene in a He atmosphere32due to the easy reduction of
the iron species. The same fact can probably be attributed to the deactivation behavior of FeAlZn.
However, using NiO as promoter, FeAlNi activity does not changed signicantly, suggesting that the active Fe3+ is not sufficiently reducible, and the Fe3+/Fe2+ reduction–oxidation couple is stabilized on the catalysts (shown by TPR), whereas Ni2+ is reduced to Ni0, acting as active sites by increasing the occurrence of side reactions such as ethylbenzene cracking.34,36
Moreover, the selectivity of styrene over FeMgZn reaches 99%, whereas the FeAlNi production of styrene is only 2% (Fig. 5b). By-products, such as toluene, benzene, aromatics, methane and
other light products are also found over FeAlNi, indicating the predominance of ethylbenzene cracking and condensation reactions, as well as Boudouard reaction over Ni0sites.34For the
purposes of comparison, a binary FeCo catalyst prepared by the co-precipitation method35is also used as a catalyst, obtaining ca.5% of conversion andca.9% of styrene selectivity. According to our previous study,36both Co0and Ni0sites are indispensible elements for coking.
The catalytic reaction rate depends strongly on the disper-sion degree of active components. FeAlZn and FeAlLa possess Fe3+ well dispersed in their large surfaces (XRD and textural properties), and the results depicted in Fig. 5 show that high conversions are achieved at relatively low reaction times (typi-cally under 30 min). The conversions over the these solids decrease monotonically and a maximum ofca.30% is observed for FeAlZn, whereas FeAlLa conversion is about 20% in 4 h of reaction time, with styrene being the main product. Neverthe-less, the styrene selectivity is not entirely obtained over FeAlLa in 5 h and styrene conversion falls simultaneously to 17%. A rational reason for explaining the aforementioned results is that the dispersed nanoparticles expose terrace, corner and edge atoms, in addition to step atoms, as observed for Fe-based solids obtained by the same preparation method.37 These
types of defects may contribute to an increase of ethylbenzene adsorption on Fe3+, whereas this action is not observed on La3+ or Al3+sites. As the active species containing Fe3+are consumed, conversion is decreased, and the parallel reaction of ethyl-benzene conversion to ethyl-benzene, ethylene and methane, among others, accounts for slightly low selectivity over FeAlLa, compared with FeAlZn.
Best results are achieved over FeAlZn because of the FeAl2O4 active-phase formation, which could be stabilized by ZnO as a textural and structural promoter of the iron species.33 This
catalyst exhibits better results in ODH reaction, compared with FeCo and FeNi, whose active phases are CoFe2O4and NiFe2O4 spinel oxides, respectively.34The latter phases are not selective
to styrene, and thus, stability is restricted to 2 h of reaction time. Another factor may be the occurrence of a parallel RGWS reac-tion increasing the CO2 conversion at the expense of ethyl-benzene dehydrogenation, in some cases. This was subsequently conrmed by the modeling and experimental assay of RWGS reaction studies with FeAlNi and FeCo catalysts. It is important to note that CO2formed during the reaction on FeAlNi is sufficiently reactive to be converted on metallic Nio sites, whereas MgO adsorption ability for CO2is elevated rather than by other elements.38 The reason for this behavior is
believed to be due to the presence of either MgO or MgAl2O4on FeMgZn, as previously stated. For FaAlZn, the ability of Zn sites in converting CO2 can be quite low,39 and thus, poor CO2 conversion is expected. In the case of FeAlLa, lanthanum carbonates can be formed by the adsorption of CO2,40and it can justify the catalytic performance of the solid.
As can be observed in Table 2, the catalytic performance is signicantly affected in the absence of CO2,i.e., a DH reaction. The catalytic runs are performed far from equilibrium. When CO2 is co-feeding the reaction, an enhancement of the EB conversion to 20% is obtained over FeAlNi, whereas the Fig. 5 (a) Catalytic results of the dehydrogenation of EB in the
pres-ence of CO2. The open symbols represent the conversion, whereas the closed symbols are the selectivities to styrene. (b) Overall selectivity of the products formed during the reaction in 5 h. The reaction was performed under atmospheric pressure at 823 K and a CO2/EB molar ratio of 30.
conversion over FeMgZn is about 9% in 5 h of time on stream. The deactivation of FeAlNi observed in the ODH reaction (Fig. 5a) is probably due to the reduction of Ni particles by the products H2and CO in the RGWS reaction.
Catalytic performance in the absence of CO2 (Table 2) displays twice as little as that of the parent solids used in the presence of the gas (Table 1). However, no general trend or correlation among iron dispersion, promoter nature and activity can be drawn from EB conversion data. From these results, it can be concluded that simple ethylbenzene dehy-drogenation (DH reaction) occurrence is limited in the absence of the mild oxidant due to the reduction of the active iron phase. In addition, it appears that the styrene product is unstable in the absence of CO2and reacts with the loss of its selectivity. This will be further investigated over the most active solids.
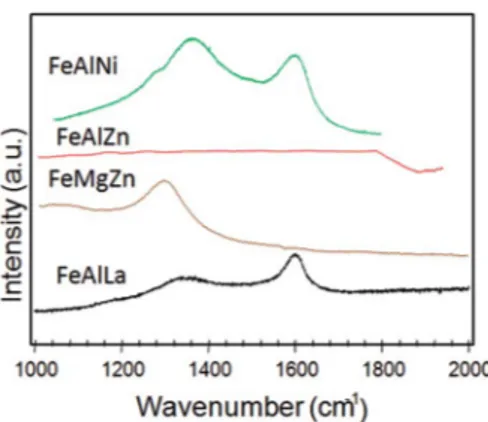
3.2.1. Characterization of spent solids. The Raman measurements of the spent solids are performed to describe the structural features of the solids and conrm the existence of carbonaceous deposits aer being tested in the reaction (Fig. 6).
FeAlLa exhibits two broad bands at around 1345 and 1620 cm 1, which are attributed to the D and G bands, respectively; these bands are associated with the deposition of carbonaceous species on the solid surface. The D band is ascribed to the defects in the structure or disordered carbon species, whereas that of G is originated from the in-plane C–C bond stretching of more ordered graphitized carbon.1 Most
probably, some well-dispersed iron nanoparticles of FeAlLa are more prone to be reduced during the reaction, and thus, form metallic iron due to hydrogen presence. Assuming that coking formation is inevitable under the aforementioned conditions, the reason for a lower activity decay of the FeAlLa could be a higher resistance against a full reduction of the nanoparticles and leaching of the coking by oxi-lanthanum carbonate species formed by CO2 from the solid surface.41 More interestingly, Table 2 shows that the textural properties of spent FeAlLa are only slightly affected aer the reaction, as compared with the
fresh solid in Table 1.
In the case of FeAlNi, the shiing of D and G bands to higher
wavenumbers is also observed, as compared with FeAlLa, particularly as the D band displays a 35 cm 1red-shi. Raman
results are in reasonable harmony with those aforementioned catalytic results that suggested the deactivation of this solid, owing to ethylbenzene cracking. This is in a good agreement with the report of Menezes5that illustrated the deactivation of
Fe-based catalysts induced by metallic nickel species, which provides the cracking of the ethylbenzene molecule to form carbon on the solid surface. These results could not be explained without taking into account the damage of the solid surface. As shown in Table 2, the values of the textural proper-ties of the solids decrease signicantly, compared with the fresh solid, because of coking on the solid surface.
Investigating the Raman spectrum of FeMgZn more closely, it can be found in only one band, namely that of D. It implies that the amorphous carbon deposition from ethylbenzene or CO decom-position reactions could be responsible for the poor activity of the solid. A quite satisfactory relationship between Raman results and surface properties is evidenced in Table 2. The low textural prop-erties of the FeMgZn can be ascribed to the much more amor-phous carbon deposition on pores and/or solid surfaces.
No carbon bands are observed for FeAlZn, which is assumed to be due to resistance to the coking of the solid. This inter-pretation is reasonable if the textual properties are still main-tained for the spent solid (Table 2). It can be assumed that FeAlZn is a stable catalyst for the reaction.
3.2.2. Kinetic constant and RWGS reaction rate determi-nations. Using the C++ programming tool, the e
ffect of temperature on the RGWS reaction rate is performed with the CO2/H2 of 1 at 10 bar (Tables 3 and 4). Not surprisingly, at different operating temperatures (from 400 to 1050 K), the results show that the non-catalyzed reaction is favored by increasing the temperatures. However, temperatures higher than 850 K signicantly slowkRWGSdue to the thermodynamic limitations of the process at elevated temperatures (Table 3). Therefore, side reactions such as CO dissociation into CO2and its further conversion to coking (reaction (VI)) prevails over the RGWS reaction at around 1100 K. Up to this temperature, the overall process becomes close to the maximum allowed by equilibrium, probably due to the equal velocity of WGS and RWGS reactions or CO2dissociation (VI).
2CO#CO2+ coke,DH298.15 K¼ 172 kJ mol 1 (VI)
From Arrhenius plots used to establish a good set of temperature-dependent rate parameters, a resultant activation Table 2 Catalytic performance in the absence of CO2for the
steady-state condition. Reaction conditions: 50 mg of fresh catalyst and a temperature of 823 K over the course of 5 h. The textural properties of the spent catalysts, after being used in the reaction in the aforemen-tioned reaction conditions
Catalyst
EB conversion in the
absence of CO2(%) SgBET(m2g 1) Vp(cm3g 1)
FeAlNi 20 19 0.03
FeMgZn 9 14 0.02
FeAlZn 2 54 0.07
FeAlLa — 63 0.09
Fig. 6 Raman measurements for the spent catalysts. The solids were used in the reaction under atmospheric pressure at 823 K and a CO2/EB molar ratio of 30 for 5 h.
energy parameter of 4.01103 J mol 1is obtained in accor-dance with those found elsewhere.42–45
Thermodynamic parametersDGrandDHr are 3.2 kJ mol 1 and 42.3 kJ mol 1, respectively, at 823 K. These values decrease with an increase in temperature, suggesting that the CO2 hydro-genation is favored at high temperatures, otherwise the RGWS side reaction occurs inspite of the main reaction under these conditions. According to the DFT-rened microkinetic model studies and mechanistic predictions, the WGS reaction proceeds
viaa carboxyl (COOH) mechanism, whereas the RGWS reaction proceeds according to that of a redox (reaction (IV)) at moderate temperatures,42,45which is in good agreement with our results.
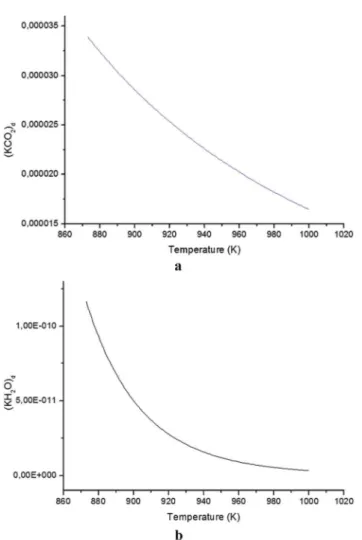
3.2.3. Adsorption and desorption constants by varying the temperature. The CO2 and water adsorption constants (e.g., KCO2andKH2O) are obtained by the means of eqn (5) and (6). The
plots of predicted adsorption constants as a function of temperature are shown in Fig. 7.
Because of the slight endothermicity of the RWGS reaction,
KCO2gradually increases with increasing temperature (Fig. 7a).
In addition, elevated temperatures lead to higherKCO2 values
than those ofKH2O, and this is also reected in their velocity
rates. These differences are appreciable at temperatures less than 950 K, in which RWGS is thermodynamically favored.43
Many mathematical models have been developed by investiga-tors to predict the evolution of the effective RGWS reaction on a solid surface and mostly agreed that CO2adsorption is favored at temperatures lower than 850 K, due to mono and bidentade compound formation with CO2, on the catalyst surface.44
It has been assumed that when temperatures are higher than 950 K, the parameter tends to reect values close to zero because of the difficulty in adsorbing CO2on the solid surface. Thus, the CO2more rapidly decomposes to carbon monoxide and the traces of the effluents are detected in low amounts, resulting in reduced desorption constants.
The inuence of the reaction temperature on the KH2O
behavior is examined in temperatures ranging from 850 to 1000 K (Fig. 7b). The model considering water adsorption gives reasonable results, and the main reason is the good capture of water at temperatures as low as 950 K. Furthermore, the curves provide reasonable accuracy and good agreement with the fact that RWGS reaction is favored upon using these conditions, as
Table 3 Number of assays (NPt), temperature (T) and velocity constant (kRGWS) values for RWGS reactions. The results were obtained from 400 to 1050 K by using a CO2/H2molar ratio of 1
NPt T(K) kRGWS102(s 1)
1 400 0.07
2 450 0.3
3 500 0.8
4 550 2.0
5 600 4.0
6 650 7.0
7 700 11.0
8 750 18.0
9 800 26.0
10 850 32.0
11 900 33.0
12 950 35.0
13 1000 36.0
14 1050 37.0
Table 4 Number of assays (NPt), carbon dioxide to hydrogen partial pressure (pCO2/pH2) and RWGS reaction rates
NPt pCO2/pH2 rRGWS10
19(kmol kg 1)
1 0.5 0.39
2 1 1.57
3 2 3.14
4 3 4.71
5 4 6.29
6 5 7.86
7 6 9.43
8 7 11.01
9 8 12.58
10 9 14.15
11 10 15.72
Fig. 7 (a) CO2adsorption constant at various temperatures obtained for a hypothetic catalyst surface. (b) Water adsorption constant as a function of the temperature for the aforementioned hypothetical catalyst surface.
observed for catalytic runs over Ru and carried out at 850 K.47It
is interesting to consider the aforementioned observations in light of the recently reported Cu–Fe catalysts tested under the same conditions, which demonstrate the abilities of CO and water to desorb from Cu–Fe surfaces during the steam refor-mation of methane.19
Fig. 8 displays the plots of deactivation constants (e.g.,KH2Od
andKCO2d)versustemperature.
Of all the models considering a hypothetic surface where CO and H2O species react,39,42,48the curve provides the bestt to corroborate that the deactivation of these entities on a solid surface is faster over CO2than H2O at temperatures as low as 950 K. This result indicates that the reaction is more favorable at temperatures lower than 950 K, as the reactant molecules of CO2disproportionate to form CO, and the rate of this reaction is too high, compared with other parallel reactions.42,48
The value of adsorption constant (k0
a) is found to be equal to 7.910 25s 1at 850 K by using eqn (7). The reaction in this study is more inuenced by an increase in the reaction temperature. In addition, the deactivation on the external surface of the catalyst is assisted by a CO2 decomposition parallel reaction more than its own CO2adsorption. Finally, the
plots of adsorption constants vs. temperature result in an exponential curve, which is regarded as sufficiently good to indicate that temperatures below 950 K are adequate to show that the CO2 adsorption rate is the determining step of the reaction, which is sufficiently elevated to allow for RWGS parallel reactions. However, the CO2 deactivation rate is also enhanced at these temperature conditions. In addition, the model shows a strong tendency to underestimate the conver-sions at elevated temperatures.
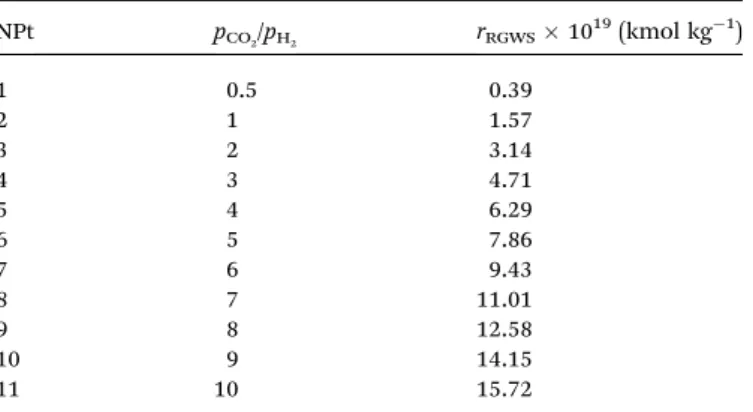
3.2.4. Effect of CO2/H2 on the occurrence of RWGS. The reverse water gas shireaction is studied under distinct CO2/H2 ratios by varying the temperature. RWGS reaction rates is gradually enhanced by increasing the partial pressure of the reactants (Table 4) due to the shiof equilibrium to form CO and water, as it has already been stressed in the literature.49,50
Lower CO2/H2inferior to 1 corresponds to an increase in H2 content in the feed and this can favor the competition among the following reactions: WGS (backward reaction (III)), hydro-genation of CO2 to methanol or ethanol (reactions (VII–IX)), methane formation (reaction (X)), alkenes formation (reactions (XI and XII)) and coking by CO reduction (reaction (XIII)).25,26
Moreover, RWGS is not thermodynamically favored under lower CO2/H2, indicating that the kinetic factors prevail over the thermodynamic ones.
CO2+ 3H2/CH3OH + H2O (VII)
CO2+ 4H2/CH3OH + 2H2O (VIII)
2CO2+ 6H2/C2H5OH + 3H2O (IX)
CO2+ 4H2/CH4+ 2H2O (X)
2CO2+ 7H2/C2H6+ 4H2O (XI)
3CO2+ 9H2/C3H6+ 6H2O (XII)
CO2+ 2H2/C + 2H2O (XIII)
Nevertheless, the rates reach a plateau and a maximum value of CO2/H2¼1, which tends to be favored due to the stoichio-metric relations of the RGWS reaction even if elevated condi-tions are obtained at CO2/H2 ratios superior to 1. Therefore, reaction rate levels up 1.0 10 19 mol h 1 are achieved at pCO2/pH2reaching 1.
Apart from the modeling results, RWGS reaction occurrence is preferred at a CO2/H2molar ratio of 1 and a temperature of 850 K.
3.3. Experimental studies in RWGS over the catalysts studied
Catalytic runs in the RGWS reaction were carried out over FeAlNi and FeCo (Fig. 9), the latter being a reference catalyst. The reaction conditions are the CO2/H2molar ratio of 1 and a temperature of 850 K. A detailed description of FeCo reference catalyst and its textural and structural features of the solids have been given in ref. 42. The FeMgZn and FeAlLa catalysts are not active in the RGWS reaction due to the lack of active sites to Fig. 8 (a) Deactivation constants of CO2obtained for a hypothetic
catalyst. (b) Deactivation constants of water for a hypothetic catalyst.
catalyze the reaction, whereas the conversion of FeAlZn shows activity in therst minutes of the reaction and then falls to zero. Experimental and both experimental and predicted conver-sion have shown goodt.
The CO2 conversion of Fe-based catalysts increases rapidly from 0 to 2.5% at 600 K, and thereaer, it appears that best
catalytic activity can be attained with 20.3% conversion at 1400 K (Fig. 9a). Both the CO2 conversion and CO selectivity do not follow the same trends due to WGS reaction predominance over certain catalysts, as shown in Fig. 9b. Instead, FeAlZn is inactive even at high temperatures. It is well known that Ni in iron-based catalysts promotes the WGS reaction at temperatures as high as 600 K due to reaction kinetic control, and the catalyst is very active, stable and selective to CO at high temperatures.49–52The
FeAlNi is activated more rapidly; however, aer 1 h of reaction, it quickly got deactivated mainly due to the formation of coke residues on the catalysts during the test. Carbon monoxide selectivity linearly decreases with an increase in temperature, ensuring that the catalytic activity for CO decomposition to coking at elevated temperatures is likely. This is favored when reduced nickel particles are present on the surface of the support. Moreover, the inverse relationship between CO selectivity and temperature also suggests that the RWGS endothermic reaction needs heat to achieve high CO2 conversion. Because
extremely high temperatures are impractical for the commercial application of catalysts in the RWGS reaction, thermodynami-cally favorable parallel reactions, such as Boudouard (reaction (X)) and methanation (reaction (XIII)), could be likely over the FeAlNi catalyst. In the case of FeAlZn, the oxidation of iron nanoparticles may not be likely; as a result, there is a loss of the active sites needed for the reaction, and thus, CO selectivity is meaningless in the range of temperatures studied. The results indicated that the metallic Co nanoparticles are mainly responsible for the catalytic performance because the FeCo shows two times higher activity than the FeAlNi catalyst. Such an observation hints towards how the reaction conditions (temperature and composition) can affect the catalytic conver-sion. The results are indeed in excellent agreement with those obtained theoretically.
From these results, it can be concluded that FeAlZn is very advantageous in ethylbenzene conversion in the presence of CO2for producing styrene because the coupled reaction and the stability of the dispersed iron-active phase makes the occur-rence of RGWS reaction effectively reduced.
4.
Conclusions
The ethylbenzene dehydrogenation in the presence of CO2(or its absence) was investigated over Fe-based catalysts. Among the various studied ternary systems that contained La and Zn promoters, FeAlZn showed the best results in ODH due to the dispersion ofa-Fe2O3andg-Fe2O3nanoparticles on their matrices in the presence or absence of CO2. FeAlZn was the most active solid in the ODH reaction, whereas FeAlNi exhibited the best performance in the DH reaction among the catalysts studied. Catalytic results in the RWGS reaction were performed by the means of kinetic modeling and experimental studies. The optimal conditions for RWGS reaction occurrence were at 850 K, using a ratio of CO2/H2 ¼ 1, which were proved by the experimental results for FeAlNi. The CO2adsorption constant decreased with an increase in temperature; this factor was responsible for the highest reaction rate at temperatures close to 850 K, due to CO2 disproportionate reaction occurrences. Although the reaction rate was elevated at high hydrogen and carbon dioxide partial pres-sures, the CO2/H2ratio values less than 1 led to the formation of hydrocarbons, whereas those superior to the unity gave CO2 degradation. A CO2/H2¼1 ratio and temperature of 850 K were the best condition for RWGS reaction occurrence, whereas that of the ODH was not favoured under these conditions. From the catalytic results, the FeAlZn showed a poor performance in RGWS reaction, compared with that of the FeAlNi catalyst due to the active-phase degradation of the former solid. Thus, FeAlZn is best suited for ethylbenzene dehydrogenation coupled to RGWS, and this solid exhibited 30% of ethylbenzene conversion, being entirely selective to styrene.
Abbreviations
COS Active sites occupied by oxygen atom CT Total amount of active sites occupied Fig. 9 Experimental assays of RWGS reactions for FeAlNi and FeCo
catalysts: (a) CO2conversion and (b) selectivity to CO.
Cv Active surface sites available per catalyst mass DHCO2 CO2enthalpy, kJ mol
1
DHH2O Water enthalpy, kJ mol
1
fCO2 Fugacity of CO2, bar
fH2O Fugacity of H2O, bar
KCO Ratio between the adsorption and desorption constants of CO
KCO2 Ratio between the adsorption and desorption constants
of CO2
KH2O Ratio between the adsorption and desorption constants
of H2O K*
H2O Capacity for H2O adsorption at reference temperature (548 K), bar 1
K*
CO2 Capacity for CO2adsorption at reference temperature (548 K), bar 1
k0
a Kinetics constant for adsorption (eqn (9)) k0
d Kinetics constant for desorption (eqn (10)) ka Kinetic constant for adsorption without products
inuence, s 1
kd Kinetic constant for desorption without products inuence, s 1
KH2O Kinetic constant of velocity for H2O
kCO2 Kinetic constant of velocity for CO2
PCO Partial pressure of CO, bar PCO2 Partial pressure of CO2, bar
PH2 Partial pressure of H2, bar
PH2O Partial pressure of H2O, bar
r0
CO2 Rate of carbon dioxide consumed (eqn (1)) r0
H2O Rate of water produced (eqn (2)) rRWGS Velocity rate of RWGS (eqn (11))
q Attenuation of the velocity rate by CO2and water
adsorption (eqn (7))
qd Attenuation of the velocity rate by CO2and water
desorption (eqn (8))
Acknowledgements
We gratefully acknowledge FUNCAP (0011-00206.01.00/09) and CNPq (473568/2012-8) for thenancial support. The authors are also acknowledged to Central Anal´ıtica da UFC for SEM-EDX analyses.
References
1 A. L. Pinheiro, A. N. Pinheiro, A. Valentini, J. M. Filho, F. F. D. Sousa, J. R. Sousa, M. G. C. Rocha, P. Bargiela and A. C. Oliveira,Catal. Commun., 2009,11, 11–14.
2 J. Li, C. Hu, K. Tong, H. Xiang, Z. Zhu and Z. Hu,RSC Adv., 2014,4, 44377–44385.
3 N. R. Shiju, M. Anilkumar, S. P. Gokhale, B. S. Rao and C. V. V. Satyanarayana,Catal. Sci. Technol., 2011,1, 1262– 1270.
4 C. Nederlof, V. Zarubina, I. V. Meli´an-Cabrera, E. H. J. Heeres and F. Kapteijn,Appl. Catal., A, 2014,476, 204–214. 5 I. M. Nogueira, G. Q. Sabadia, A. A. Moreira, J. M. Filho and
A. C. Oliveira,J. Mol. Catal. A: Chem., 2011,351, 81–92.
6 X. Ye, Y. Yue, C. Miao, Z. Xie, W. Hua and Z. Gao, Green Chem., 2005,7, 524–528.
7 C. L. Lima, O. S. Campos, A. C. Oliveira, F. F. de Sousa, J. M. Filho, P. L. Neto, A. N. Correia, G. Q. Sabadia, I. M. Nogueira, G. S. Pinheiro and A. C. Oliveira, Appl. Catal., A, 2011,395, 53–63.
8 S. Zhang, X. Li, J. Jing, H. Fan, Q. Wang and W. Li,Catal. Commun., 2013,34, 5–10.
9 J. C. S. Araujo, F. N. A. Freire, C. B. A. Souza, A. C. Oliveira, A. P. Ayala and A. C. Oliveira,Appl. Catal., A, 2010,377, 55–63. 10 A. J. R. Castro, J. M. Soares, J. M. Filho, A. C. Oliveira,
A. Campos and E. R. C. Milet,Fuel, 2013,108, 740–748. 11 Q. Wang, X. Li, W. Li and J. Feng,Catal. Commun., 2014,50,
21–24.
12 A. Aouissi, D. Aldhayan and S. Alkathani, Chin. J. Catal., 2012,33, 1474–1479.
13 F. F. de Sousa, H. S. A. de Sousa, A. C. Oliveira, M. C. C. Junior, A. P. Ayala, E. B. Barros, B. C. Viana, J. M. Filho and A. C. Oliveira,Int. J. Hydrogen Energy, 2012, 37, 3201–3212.
14 V. Zarubina, C. Nederlof, B. van der Linden, F. Kapteijn, H. J. Heeres, M. Makkee and I. Meli´an-Cabrera, J. Mol. Catal. A: Chem., 2014,381, 179–187.
15 S. Patel and K. K. Pant,Chem. Eng. Sci., 2007,62, 5425–5435. 16 W. M. Haynes, CRC, Handbook of Chemistry and Physics, National Institute of Standards and Technology, Boulder, Colorado, USA, 3rd edn, 2012.
17 J. Erena, I. Sierra, A. T. Aguayo, A. Ateka, M. Olazar and J. Bilbao,Chem. Eng. J., 2011,174, 660–667.
18 C. Hermann, E. Quicker and R. Dittmeyer, J. Membr. Sci., 1997,136, 161–172.
19 D. C. Carvalho, N. A. Ferreira, J. M. Filho, A. C. Oliveira, O. P. Ferreira and J. M. Soares, Catal. Today, 2014, DOI: 10.1016/j.cattod.2014.08.010, in press.
20 M. Benito, S. Garcıa, P. Ferreira-Aparicio, L. G Serrano and
L. Daza,J. Power Sources, 2007,169, 177–183.
21 A. J. R. Castro, S. P. D. Marques, J. M. Soares, J. M. Filho, G. D. Saraiva and A. C. Oliveira, Chem. Eng. J., 2012,209, 345–355.
22 A. Barrera, M. Viniegra, V. H. Lara and P. Bosch-Giral,Catal. Commun., 2004,5, 569–574.
23 G. A. El-Shobaky and A. A. Mostafa,Thermochim. Acta, 2003, 408, 75–84.
24 Y. Lee, K. Jun, J. Park, H. S. Potdar and R. C. Chikate,J. Ind. Eng. Chem., 2008,14, 38.
25 W. Jianxin and L. Laitao,Catal. Lett., 2008,126, 325–332. 26 F. Mirzaei, M. Rezaei, F. Meshkani and Z. Fattah,J. Ind. Eng.
Chem., 2015,21, 662–667.
27 A. E. Palomares, A. Uzc´ategui and A. Corma,Catal. Today, 2008,137, 261–266.
28 R. J. Balasamya, B. B. Topea, A. Khurshida, A. A. S. Al-Alia, L. A. Atanda, K. Sagata, M. Asamoto, H. Yahirob, K. Nomurac, T. Sanod, K. Takehiraa and S. S. Al-Khattaf,
Appl. Catal., A, 2011,398, 113–122.
29 L. Ma, R. Wua, H. Liua, W. Xua, L. Chenb and S. Chen,Solid State Sci., 2011,13, 2172–2176.
30 P. H. Bolt, F. H. P. M. Habraken and J. W. Geus,J. Solid State Chem., 1998,135, 59–69.
31 N. Dulamit¸˘a, A. M˘aic˘aneanu, D. C. Sayle, M. Stanca, R. Cr˘aciun, M. Olea, C. Aoroaei and A. Fodor, Appl. Catal., A, 2005,287, 9–18.
32 P. Ku´strowski, L. Chmielarz, A. Rafalska-Łasocha, B. Dudek, A. Pattek-Janczyk and R. Dziembaj,Catal. Commun., 2006,7, 1047–1052.
33 H. E. L. Bonm, A. C. Oliveira and M. C. Rangel,React. Kinet. Catal. Lett., 2003,80, 359–364.
34 R. M. Freire, F. F. de Sousa, A. L. Pinheiro, E. Longhinotti, J. M. Filho, A. C. Oliveira, P. C. Freire, A. P. Ayala and A. C. Oliveira,Appl. Catal., A, 2009,359, 165–179.
35 D. C. Carvalho, N. A. Ferreira, J. M. Filho, A. C. Oliveira and O. P. Ferreira, Dry reforming of methane over mixed oxides obtained from thermal decomposition of layered double hydroxides, in XXII International Materials Research Congress, 2013, p. 60.
36 A. H. M. Batista, F. F. Sousa, S. B. Honorato, A. P. Ayala, J. M. Filho, F. W. Sousa, A. N. Pinheiro, J. C. S. Araujo, R. F. Nascimento, A. Valentini and A. C. Oliveira, J. Mol. Catal. A: Chem., 2010,315, 86–98.
37 R. A. Van Santen,Acc. Chem. Res., 2008,42, 57–66.
38 J. Feng, Y. Ding, Y. Guo, X. Li and W. Li,Fuel, 2013,109, 110– 115.
39 F. Arena, G. Italiano, K. Barbera, S. Bordiga, G. Bonura, L. Spadaro and F. Frusteri,Appl. Catal., A, 2008,350, 16–23. 40 D. C. Carvalho, H. S. A. de Souza, J. M. Filho, A. C. Oliveira, A. Campos, E. R. C. Milet, F. F. de Sousa, E.
Padron-Hernandez and A. C. Oliveira, Appl. Catal., A, 2014, 473, 132–145.
41 H. S. A. de Sousa, A. N. da Silva, A. J. R. Castro, A. Campos, J. M. Filho and A. C. Oliveira,Int. J. Hydrogen Energy, 2012, 37, 12281–12291.
42 M. J. L. Gines, A. J. Marchi and C. R. Apesteguia,Appl. Catal., A, 1997,154, 155–171.
43 S. P. Naika, T. Ryub, V. Buib, J. D. Millerb, N. B. Drinnanc and W. Zmierczak,Chem. Eng. J., 2011,167, 362–368. 44 F. Arena, G. Mezzatesta, G. Zafarana, G. Truno, F. Frusteri
and L. Spadaro,J. Catal., 2013,300, 141–151.
45 M. Maestri and K. Reuter,Chem. Eng. Sci., 2012,74, 296–299. 46 H. Watanabe and M. Otaka,Fuel, 2006,12–13, 1935–1943. 47 M. A. Soria, C. Mateos-Pedrero, A. Guerrero-Ruiz and
I. Rodrıguez-Ramos, Int. J. Hydrogen Energy, 2011, 36,
15212–15220.
48 D. G. Avraam, T. I. Halkides, D. K. Liguras, O. A. Bereketidou and M. A. Goula,Int. J. Hydrogen Energy, 2010,35, 9818–9827. 49 S. Saeidi, N. A. S. Amin and M. R. Rahimpour,J. CO2Util.,
2014,5, 6–81.
50 M. Suk Lee, J. Y. Lee, D.-W. Lee, D. J. Moon and K. Y. Lee,Int. J. Hydrogen Energy, 2012,37, 11218–11226.
51 F. Malherbe, C. Forano, B. Sharma, M. P. Atkins and J. P. Besse,Appl. Clay Sci., 1998,13, 381–399.
52 G. Pekridis, K. Kalimeri, N. Kaklidis, E. Vakousi,
E. F. Iliopoulou, C. Athanasiou and G. E. Marnellos,Catal. Today, 2007,127, 337–346.