AMTD
2, 2217–2239, 2009Modelling Ag-particle activation and growth in a TSI WCPC model
3785
F. Stratmann et al.
Title Page Abstract Introduction Conclusions References Tables Figures
◭ ◮
◭ ◮
Back Close Full Screen / Esc
Printer-friendly Version Interactive Discussion
Atmos. Meas. Tech. Discuss., 2, 2217–2239, 2009 www.atmos-meas-tech-discuss.net/2/2217/2009/ © Author(s) 2009. This work is distributed under the Creative Commons Attribution 3.0 License.
Atmospheric Measurement Techniques Discussions
Atmospheric Measurement Techniques Discussionsis the access reviewed discussion forum ofAtmospheric Measurement Techniques
Modelling Ag-particle activation and
growth in a TSI WCPC model 3785
F. Stratmann1,2, E. Herrmann1, T. Pet ¨aj ¨a1, and M. Kulmala1
1
Department of Physics, P.O. Box 64, 00014 University of Helsinki, Finland 2
Leibniz Institute for Tropospheric Research (IfT), Permoserstrasse 15, 04318 Leipzig, Germany
Received: 6 August 2009 – Accepted: 9 September 2009 – Published: 25 September 2009 Correspondence to: E. Herrmann ([email protected])
AMTD
2, 2217–2239, 2009Modelling Ag-particle activation and growth in a TSI WCPC model
3785
F. Stratmann et al.
Title Page Abstract Introduction Conclusions References Tables Figures
◭ ◮
◭ ◮
Back Close Full Screen / Esc
Printer-friendly Version Interactive Discussion
Abstract
In this work, we modelled activation and growth of silver particles in the water-operated TSI model 3785 water condensation particle counter (WCPC). Our objective was to in-vestigate theoretically how various effects influence the counting efficiency of this CPC. Coupled fluid and particle dynamic processes were modelled with the computational
5
fluid dynamics (CFD) code FLUENT in combination with the Fine Particle Model (FPM) to obtain profiles of temperature, vapour concentration, nucleation rate, and particle size. We found that the counting efficiency of the TSI 3785 for small particles might be affected by the presence of larger particles. Moreover, homogeneous nucleation processes can significantly influence counting efficiency.
10
1 Introduction
Condensation Particle Counters (CPCs) measure number concentration of aerosol par-ticles. These instruments can detect sub-micrometer particles that cannot be perceived by optical counters (McMurry, 2000). The operation principle of a CPC is generally a multi-step process. First, the aerosol laden air is saturated with a vapour, and then
15
the mixture is brought into supersaturated conditions with respect to this vapour, which leads to activation and growth of the particles to optically detectable sizes. The super-saturation can be created by adiabatic expansion (e.g. K ¨urten et al., 2005), conductive cooling (e.g. Sem, 2002), thermal diffusion (Hering and Stolzenburg, 2005; Hering et al., 2005), and mixing of cool and warm saturated air flows (Sgro and Fernandez de la
20
Mora, 2004).
Hering and Stolzenburg (2005) introduced a method to generate supersaturation by simultaneous diffusion of water and heat. Inside a wet-walled growth tube, condensa-tional growth of the particles is initiated by heating the aerosol flow. Due to the fact that mass diffusivity of water in air is higher than thermal diffusivity of air, a
supersat-25
AMTD
2, 2217–2239, 2009Modelling Ag-particle activation and growth in a TSI WCPC model
3785
F. Stratmann et al.
Title Page Abstract Introduction Conclusions References Tables Figures
◭ ◮
◭ ◮
Back Close Full Screen / Esc
Printer-friendly Version Interactive Discussion
conditions at the centreline allow the condensational growth of the aerosol particles and their subsequent detection (Hering et al., 2005). Pet ¨aj ¨a et al. (2006) showed that the detection efficiency for silver particles of this Water-based Condensation Particle Counter (WCPC) depends on the temperature difference between the saturator and the growth tube.
5
The experiments in Pet ¨aj ¨a et al. (2006) indicated that the solubility of the sampled particles affects the detection efficiency of the water-based CPC considerably. The cut-offsizes were 5.8 and 3.6 nm for silver and sodium chloride particles, respectively. Thus, the amount of supersaturation, the physico-chemical properties of the working fluid, and the sampled particles influence the activation probability inside the CPC and
10
thus determine the detection efficiency of the instrument (e.g. Stolzenburg and Mc-Murry, 1991; Kulmala et al., 2007; Iida et al., 2009). The activation of the particles soluble to the working fluid can be described with a K ¨ohler theory (e.g. Kulmala et al., 2004) whereas the activation of insoluble particles can be modelled by a heteroge-neous nucleation theory (Lazaridis et al., 1992).
15
The objective of this study is to examine a TSI model 3785 Water Condensation Particle Counter (WCPC) in a detailed modelling framework. For describing the cou-pled fluid and particle dynamical processes taking place inside the WCPC, a Com-putational Fluid Dynamics Code FLUENT (Fluent, 2005) together with a Fine Particle Model (FPM) (Particle dynamics, 2005) were used. Utilizing this combined fluid and
20
AMTD
2, 2217–2239, 2009Modelling Ag-particle activation and growth in a TSI WCPC model
3785
F. Stratmann et al.
Title Page Abstract Introduction Conclusions References Tables Figures
◭ ◮
◭ ◮
Back Close Full Screen / Esc
Printer-friendly Version Interactive Discussion
2 Methods
2.1 Description of the TSI WCPC 3785
The TSI 3785 condensation particle counter (Hering et al., 2005; Hering and Stolzen-burg, 2005) is a laminar flow instrument the operation principle of which is based on the condensation of water on aerosol particles to enlarge these particles to optically
5
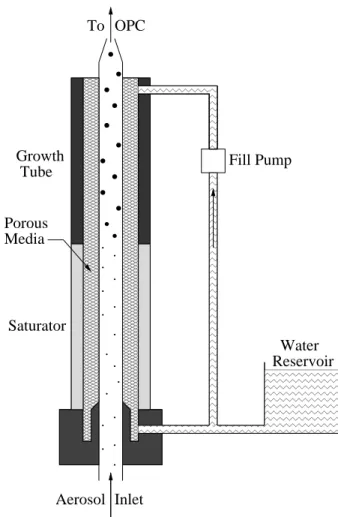
detectable sizes. Figure 1 shows a simplified schematic diagram of the instrument. The components central to this study are the saturator and the growth tube. The inner walls of these tubes are temperature controlled and lined with a single wick made of hydrophilic porous material which is kept wetted by a water bath. The default values for the saturator and growth tube walls are 293.15 and 333.15 K, respectively. Due
10
to the wetted walls, the saturation ratio is 1 at the inner walls of saturator and growth tube. Aerosol enters the saturator through an inlet at a flow rate of 1.035 l min−1and is pre-conditioned by heat and water vapour diffusing from the saturator wall. The actual temperature and saturation ratio achieved depends on the conditions at the saturator inlet (in these investigations set to 293.15 K and 0% relative humidity). Upon
enter-15
ing the growth tube, the wall temperature is increased. For water vapour in air, mass diffusion is faster than heat diffusion which leads to supersaturation inside the tube. Depending on the actual supersaturation S, aerosol particles from a certain size on will be activated and grow in size. Large enough particles will be detected and counted by an optical particle counter (OPC) downstream of the growth tube.
20
2.2 Modelling
For describing the coupled fluid and particle dynamical processes taking place inside the CPC the Computational Fluid Dynamics Code FLUENT (Fluent, 2005) together with the Fine Particle Model (FPM) (Particle dynamics, 2005) were used. Utilizing this combined fluid and particle dynamical model, from now on called FLUENT/FPM, the
25
AMTD
2, 2217–2239, 2009Modelling Ag-particle activation and growth in a TSI WCPC model
3785
F. Stratmann et al.
Title Page Abstract Introduction Conclusions References Tables Figures
◭ ◮
◭ ◮
Back Close Full Screen / Esc
Printer-friendly Version Interactive Discussion
– fluid momentum(assuming a parabolic velocity profile)
– vapour mass transfer (accounting for multi-component and thermal diffusion, vapour source at the wall and vapour sink due to condensation of vapour to the particles and associated latent heat release)
– heat transfer
5
– particle transport due to convection
– homogeneous (Girshik et al., 1990) and heterogeneous nucleation (Fletcher, 1958; Lazaridis et al., 1991)
– particle transformation due to condensation/evapouration (Barrett and Clement, 1988).
10
For the above model setup and assumptions, the governing equations take the fol-lowing form:
2.2.1 Vapour mass transfer
∇ ·(ρuωv) =−∇ ·jv+Sv
jv =−ρDv∇ωv−ρDvαv,g(1−ωv)ωv∇lnT (1)
15
Here jv is the mass flux of vapour relative to the mass average velocity u, ρ is the density andT is the absolute temperature of the vapour–carrier-gas mixture; ωv,Dv, and αv,g are the vapour mass fraction, the binary vapour diffusion coefficient, and
the thermal diffusion factor, respectively; and Sv stands for the vapour sink due to condensation onto the particles.
AMTD
2, 2217–2239, 2009Modelling Ag-particle activation and growth in a TSI WCPC model
3785
F. Stratmann et al.
Title Page Abstract Introduction Conclusions References Tables Figures
◭ ◮
◭ ◮
Back Close Full Screen / Esc
Printer-friendly Version Interactive Discussion
2.2.2 Heat transfer
∇ ·(ρuh) =−∇ ·q+Sh
q =−ρα∇h−ρ(α∇ωv+jv)(hv−hg)
+αv,gkT M Mv+Mg
jv (2)
Hereqis the heat flux, his the specific enthalpy, α=k/(ρcp) is the thermal diffusivity,
5
kis the heat conductivity,cpis the specific heat capacity;Mis the molar weight of the
vapour–gas mixture, hv and hg are the specific enthalpies,Mv andMg are the molar
weights of the vapour and the carrier gas, respectively; andSh=LvSV represents the heat source, that is, the latent heat (Lv is the vapour heat of vaporization) released by
the vapour condensing onto the particles.
10
2.2.3 Particle transport and transformation
During the theoretical calculations, uni- and/or bi-modal moving monodisperse or log-normal particle size distributions were considered. Here, for convenience and sim-plicity, only the equations for the moving monodisperse model, i.e., the equations de-scribing the conservation of mode j particle numberNp,j [#/kg] and species i mass
15
concentrationsMp,i ,j [kgi/kg], are given. For a detailed description of the polydisperse
model, the reader is referred to FPM user’s guide (Particle dynamics, 2005).
∇ ·(ρuNp,j) =∇ ·ρDp,j∇Np,j +SNp,j (3)
∇ ·(ρuMp,j) =∇ ·ρDp,j∇Mp,j +SMp,i ,j+Np,j · ∂mp,i ,j
∂t (4)
Here,i denotes the different substances in the particle/droplet phase (silver and
wa-20
AMTD
2, 2217–2239, 2009Modelling Ag-particle activation and growth in a TSI WCPC model
3785
F. Stratmann et al.
Title Page Abstract Introduction Conclusions References Tables Figures
◭ ◮
◭ ◮
Back Close Full Screen / Esc
Printer-friendly Version Interactive Discussion
2.2.4 Heterogeneous nucleation
In a heterogeneous nucleation process, small nuclei form on pre-existing aerosol par-ticles. Since we study the condensation of water vapour on silver particles, we need to consider only non-soluble particles. Classical nucleation theory gives the critical cluster formation rate for the heterogeneous nucleation as (Fletcher, 1958)
5
Jhet=Kexp
−∆Ghet∗ kT
!
, (5)
whereK is a kinetic pre-factor and∆Ghet∗ the formation energy of the critical hetero-geneous nucleus. The formation energies of the heterohetero-geneous and homohetero-geneous nuclei are connected by
∆Ghet∗ =f(m, X)∆Ghom∗ , (6)
10
where
f(m, X) =1+
1−mX g
3
+X3 2−3
X −m
g
+
X −m
g
3!
+3mX2
X −m
g −1
(7)
with
g=p1+X2−2mX (8)
15
is a geometric factor that depends on the ratio of dry particle radius and critical clus-ter size throughX=Rdry/r
∗
and on the macroscopic contact angleθthrough m=cosθ
(Lazaridis et al., 1992). θ=0 represents a perfectly wettable surface whereas θ=180◦ corresponds to a completely unwettable surface. This indicates homogeneous nucle-ation and accordinglyf becomes 1 in this case.
AMTD
2, 2217–2239, 2009Modelling Ag-particle activation and growth in a TSI WCPC model
3785
F. Stratmann et al.
Title Page Abstract Introduction Conclusions References Tables Figures
◭ ◮
◭ ◮
Back Close Full Screen / Esc
Printer-friendly Version Interactive Discussion
From the heterogeneous rate the heterogeneous nucleation probabilityP was calcu-lated as (Lazaridis et al., 1992)
P =1−exp(−Jhet·t) (9)
withtbeing the nucleation time. Within the CPC, heterogeneous nucleation probability changes very rapidly between zero and 1.0 (see Fig. 2). Therefore, in the
simula-5
tions, particles/droplets were assumed to be activated and able to grow due to vapour condensation, for values of heterogeneous nucleation probabilityP≥0.5.
2.2.5 Vapour condensation
The condensational growth of the nucleated (both homogeneous and heterogeneous) particles/droplets was modelled according to Barrett and Clement (1988) accounting
10
for elevated droplet temperature due to the latent heat released.
∂mp,i ∂t =
2πdp(S −S∗)
RvT(1−ωvMvM) Dvpv,efmass +
L2 vS∗ RvT2kf
heat
(10)
whereS andS∗are the vapour saturations in the gas phase and at the particle–droplet surface, respectively,dpis the particle-droplet diameter, Rv is the vapour specific gas
constant, andpv,eis the equilibrium vapour pressure.
15
As mentioned before, for solving the above fluid and particle dynamical equations FLUENT/FPM was utilized. Using Fluent/FPM implies performing Eulerian simulations for both fluid and particle dynamics and consequently discretization of the calculation domain in a numerical grid. As the system features rotational symmetry, we used a two-dimensional axisymmetric grid. Since the walls are vapour and heat sources, the grid
20
AMTD
2, 2217–2239, 2009Modelling Ag-particle activation and growth in a TSI WCPC model
3785
F. Stratmann et al.
Title Page Abstract Introduction Conclusions References Tables Figures
◭ ◮
◭ ◮
Back Close Full Screen / Esc
Printer-friendly Version Interactive Discussion
a step. To account for this, the temperature at the walls of our model is set to grow linearly over a small space from saturator to growth tube temperature. Altogether, the model grid consists of 178 000 cells.
The following assumptions concerning the particle size distribution were made and utilized in different modelling experiments:
5
– A unimodal moving monodisperse size distribution for investigating how counting efficiency is affected by heterogeneous nucleation processes.
– A uni- and bimodal moving monodisperse size distribution for examining how counting efficiency is affected by particle number concentration.
– A bimodal (moving monodisperse plus polydisperse mode) when investigating
10
how counting is efficiency affected by nucleation.
It should be noted that the model, despite its complexity and the number of processes accounted for, still has to be considered half quantitative as it still features some impor-tant assumptions, which include issues related to the validity of classical homogeneous and heterogeneous nucleation theory, and saturation boundary condition at the
satu-15
rator and growth tube walls. However, applying the model to understand the behaviour of the CPC 3785, will give important information and insight concerning the behaviour of this specific instrument and Condensation Particle Counters in general.
3 Results
For a better overview of the complex coupled fluid flow, heat/mass transfer, particle
20
AMTD
2, 2217–2239, 2009Modelling Ag-particle activation and growth in a TSI WCPC model
3785
F. Stratmann et al.
Title Page Abstract Introduction Conclusions References Tables Figures
◭ ◮
◭ ◮
Back Close Full Screen / Esc
Printer-friendly Version Interactive Discussion
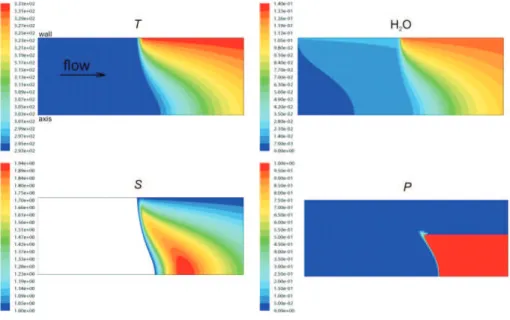
Figure 2 clearly shows that the effect of the heated wall propagates into the aerosol flow (upper left panel), and how the flow is humidified by the wetted walls (upper right panel). Modelled temperature and water vapour mass fraction are the highest at the wall and the lowest at the centre line, with both increasing towards the growth tube outlet. It should be noted, that at the outlet, the flow and the surrounding wall are not
5
in equilibrium with respect to neither temperature nor water vapour mass fraction. The resulting water vapour saturation field features the lowest values at the wall and a local maximum at the growth tube centre line. The field in our calculations is similar to the results presented in Hering and Stolzenburg (2005), where they introduced this method of generating supersaturated conditions with respect to water vapour and subsequently
10
applied it to a commercial instrument (Hering et al., 2005). The maximum supersatura-tion at the centre line in Hering and Stolzenburg (2005) is higher (2.96) whereas in our calculations, the maximum was 1.94. This is a consequence of a lower temperature difference between the saturator and the growth tube in our calculations. However, in both approaches radial and axial profiles are similar.
15
Of special interest is the lower right panel of Fig. 2. It points out the narrow region (the region where, coming from the left, the colour changes from dark blue to red) in which heterogeneous nucleation actually takes place. This steep increase in the nucleation probability is a key issue in understanding the CPC counting efficiency behaviour.
3.1 Heterogeneous nucleation
20
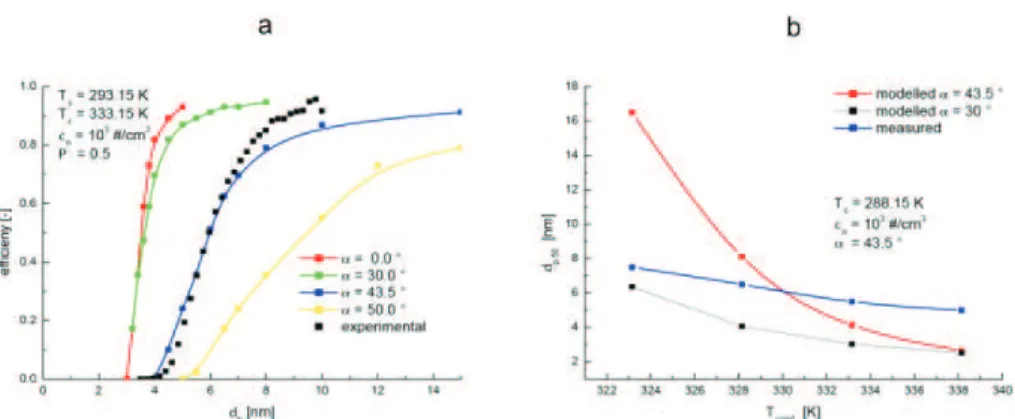
In order to study the effect of heterogeneous nucleation on the counting efficiency of the WCPC, we modelled the behavior of monodisperse Ag particles inside the CPC 3785 treating the activation of these particles as heterogeneous nucleation of water vapour. For these investigations a unimodal moving monodisperse size distribution was assumed. Results are given in Fig. 3 which depicts counting efficiency as
func-25
AMTD
2, 2217–2239, 2009Modelling Ag-particle activation and growth in a TSI WCPC model
3785
F. Stratmann et al.
Title Page Abstract Introduction Conclusions References Tables Figures
◭ ◮
◭ ◮
Back Close Full Screen / Esc
Printer-friendly Version Interactive Discussion
Assuming a contact angle of 43.5◦, which is in the range suggested by Wagner et al., 2005 for silver, the comparison between the numerical and the experimental data (Fig. 3a) seems to be encouraging. However, Fig. 3b reveals that the agreement is merely occurring by chance. As to be seen, assuming a contact angle of 43.5◦ yields significant differences in the cut-offdiameter for the growth tube temperatures
5
smaller and larger than approximately 330 K (the intersection of the red and the blue curve). The shapes of the two curves differ significantly. Considering a smaller contact angel, e.g. 30◦, shapes of the experimental and theoretical curves become similar, but the predicted cut-offsize is too small. This suggests that besides the contact angle, also a correction to the kinetic term, in other words, introducing a pre-factor to the
10
heterogeneous nucleation rate, could be sufficient for matching the experimental and theoretical data.
However, determination of the actual contact angle and the corresponding pre-factor was not within the scope of the investigations presented here and will therefore be left for future research. From the above results it can be concluded that in the
activa-15
tion of Ag particles (and most likely that of other insoluble particles too) inside a CPC using water (most likely other substances too) as working fluid, the heterogeneous nucleation process has to be considered. Furthermore it should be noted that hetero-geneous nucleation theory with only the contact angle as a free parameter is not able to consistently explain the experimental results.
20
3.2 Effects of particle number concentration on the modelled counting effi -ciency
To investigate the influences of particle number concentration on the WCPC counting efficiency, two scenarios were used. First, the response of the WCPC was modelled assuming a unimodal monodisperse (particle diameterdp=6 nm) size distribution, and
25
subsequently a bimodal, consisting of two monodisperse populations with particle sizes of 6 and 15 nm, respectively, were introduced to the modelling framework.
AMTD
2, 2217–2239, 2009Modelling Ag-particle activation and growth in a TSI WCPC model
3785
F. Stratmann et al.
Title Page Abstract Introduction Conclusions References Tables Figures
◭ ◮
◭ ◮
Back Close Full Screen / Esc
Printer-friendly Version Interactive Discussion
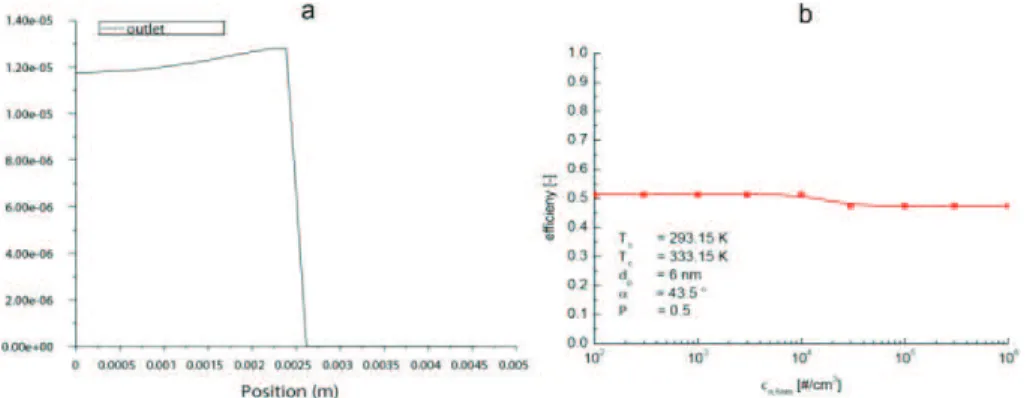
constant (left panel), and the CPC counting efficiency is not dependent on the inlet number concentration for number concentrations as high as 106cm−3. This result, on first sight, is somewhat surprising but easy to understand looking at Fig. 1 (lower right panel). All the particles are activated in a narrow axial region, i.e., in the region where the heterogeneous nucleation probability jumps from zero to one, and consequently the
5
activation itself is not much affected by the vapour depletion. The particles at the growth tube outlet, however, become smaller (see also below) but even for a concentration of 106cm−3their size is above the detection limit of the OPC which is here assumed to be one micrometer. In practice, the WCPC is capable of detecting particles in the single-particle, live-time corrected counting mode up to a concentration of 2×104cm−3 and
10
according to the manufacturer specifications, up to 107cm−3 in a photometric mode (TSI Inc, 2005).
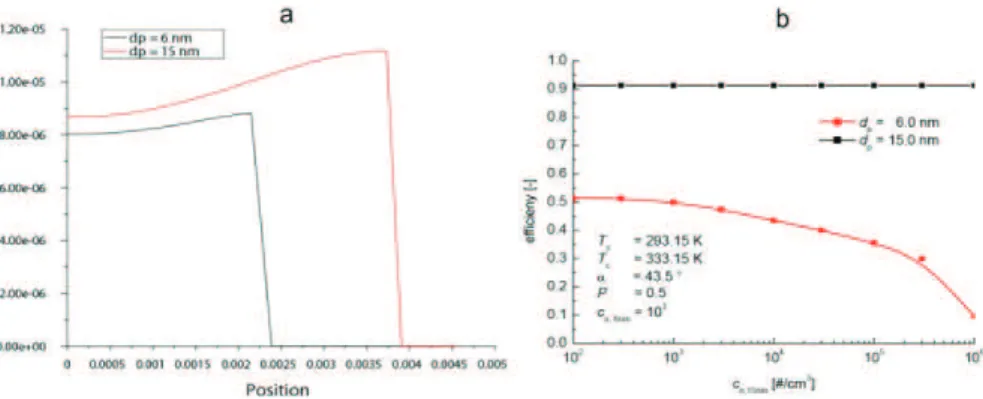
Figure 5 depicts the radial distribution of particle size at the growth tube outlet (Fig. 5a) and CPC counting efficiency as function of inlet particle number concentra-tion (Fig. 5b). In contrast to Fig. 4, now the results for a bimodal size distribuconcentra-tion (initial
15
particle sizes are 6 and 15 nm, respectively) at the CPC inlet, are presented.
From Fig. 5b it becomes obvious that the two populations feature different grown sizes at the growth tube outlet. As suggested by intuition, particles with the initial size of 15 nm, which activate at a smaller supersaturation, exhibit a larger diameter (around 10 µm) than the initially 6 nm particles (final size around 8 µm) which suffer from the
20
vapour depletion caused by the larger particles.
The effect of vapour depletion by a larger particle population becomes also visible when looking at the counting efficiencies. As to be seen from Fig. 5b, the counting efficiency for the 6 nm particles is a function of the concentration of the 15 nm particles reducing from 50 to 10% when changing the 15 nm particle concentration from 103 to
25
106cm−3. The counting efficiency of the larger size particles is almost constant for the same reasons as discussed for the unimodal case.
AMTD
2, 2217–2239, 2009Modelling Ag-particle activation and growth in a TSI WCPC model
3785
F. Stratmann et al.
Title Page Abstract Introduction Conclusions References Tables Figures
◭ ◮
◭ ◮
Back Close Full Screen / Esc
Printer-friendly Version Interactive Discussion
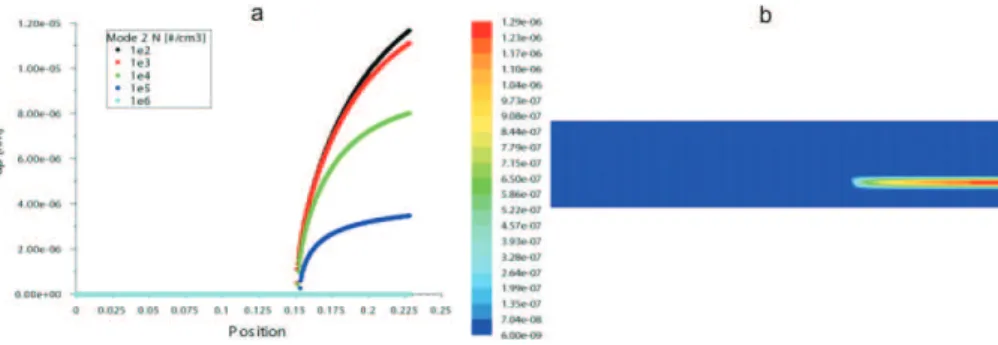
tube tubes (left panel) and a contour plot of mode 1 (initial diameter 6 nm) particle diameter.
From Fig. 6a it is clearly seen that with increasing number concentration in mode 2, the mode 2 particle diameter at the growth tube outlet is decreasing due to the particles competing for the vapour available. However, even for a concentration as
5
high as 105cm−3, the particle size is larger than 2 µm, i.e., well above the detection limit of the CPC optics. Figure 6b visualizes a rather interesting effect concerning the behaviour of the mode 1 (initial diameter 6 nm) particle diameter. Due to the lack of vapour caused by the growth of the particles in the mode 2, the activation and growth of the initially smaller particles is confined to a narrow of center region.
10
Summarizing the results concerning the question how counting efficiency is affected by particle number concentration it can be stated that (a) for a monodisperse seed aerosol, particle number concentration does not affect the CPC counting efficiency, and (b) for a polydisperse aerosol, the number concentration of larger particles present can strongly affect the counting efficiency of the smaller particles.
15
3.3 Effects of homogeneous nucleation to the counting efficiency
In order to study the effect of homogeneous nucleation process on the counting effi -ciency of the WCPC, a bimodal distribution with a moving monodisperse seed particle mode and a polydisperse lognormal nucleation mode particle size distribution was in-troduced to the modelling framework. Results of these investigations are presented in
20
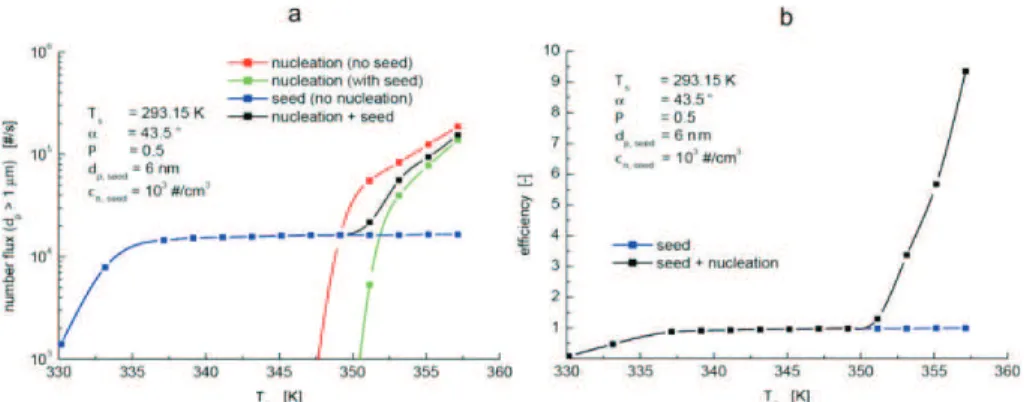
Fig. 7 which shows total particle number flux (number of particles per unit time) out of the growth tube (Fig. 7a), and the corresponding CPC counting efficiency as function of growth tube temperature (Fig. 7b).
Looking at Fig. 7a, different curves can be distinguished. The blue curve, la-belled “seed (no nucleation)”, was determined neglecting homogeneous nucleation
25
AMTD
2, 2217–2239, 2009Modelling Ag-particle activation and growth in a TSI WCPC model
3785
F. Stratmann et al.
Title Page Abstract Introduction Conclusions References Tables Figures
◭ ◮
◭ ◮
Back Close Full Screen / Esc
Printer-friendly Version Interactive Discussion
accounted for, i.e., possible influences of existing seed particles were neglected. From this curve it can be seen that without seed particles, the homogeneous nucleation be-comes important for growth tube temperatures larger than approximately 75◦C. This temperature is moved to slightly higher values (approximately 79◦C), when the influ-ences of pre-existing seed particles are considered, as to be seen examining the green
5
curve labelled “nucleation (with seed)”. The “real” number flux at the growth tube outlet is represented by the black curve labelled “nucleation+seed” which features a sig-nificant increase for growth tube temperatures larger than 80◦C. The CPC counting efficiency (Fig. 7b) increases accordingly. Consequently it can be stated that homoge-neous nucleation processes may result in an increase in the CPC counting efficiency
10
yielding values of up to 10. Thus, with a large temperature difference between the saturator and the growth tube, the modelling suggests a large contribution to the mea-sured particle concentration due to homogeneous nucleation of water vapour inside the WCPC.
4 Conclusions
15
The key parameters determining the detection efficiency of a Condensation Particle Counter are the level of supersaturation and both the physico-chemical properties of the working fluid and the sampled particles (e.g. Stolzenburg and McMurry, 1991; Kul-mala et al., 2007; Iida et al., 2009). In the case of insoluble particles, heterogeneous nucleation describes the formation of nuclei onto the pre-existing particles (Lazaridis
20
et al., 1992). In this work the influences of various effects on the counting efficiency of a TSI 3785 CPC were investigated theoretically. For describing the coupled fluid and particle dynamical processes taking place inside the CPC, the Computational Fluid Dynamics Code FLUENT (Fluent, 2005) together with the Fine Particle Model (FPM) (Particle dynamics, 2005) were used.
25
AMTD
2, 2217–2239, 2009Modelling Ag-particle activation and growth in a TSI WCPC model
3785
F. Stratmann et al.
Title Page Abstract Introduction Conclusions References Tables Figures
◭ ◮
◭ ◮
Back Close Full Screen / Esc
Printer-friendly Version Interactive Discussion
silver particles inside the WCPC. The heterogeneous nucleation theory was not, how-ever, able to consistently explain all of the experimental results. For a monodisperse silver seed aerosol, the particle number concentration did not affect the CPC counting efficiency in the concentration range below 106cm−3. For a polydisperse aerosol, the number concentration of the larger particles has an effect on the counting efficiency of
5
the smaller particles due to vapour depletion. In addition, in case of large supersat-urations inside the WCPC, homogeneous nucleation of water vapour can significantly produce particles and thus artificially alter the counting efficiency.
The results confirm that the counting efficiencies of CPCs are dependent on both, particle and vapour chemical composition. Consequently, at least for nanometer
par-10
ticles, there is not a unique cut-off diameter nor a single counting efficiency. When considering the measurements of total particle number concentration in e.g. an atmo-spheric polydisperse aerosol particle population, the results imply that the counting efficiency of small, freshly nucleated particles, might be a function of the number and size of the pre-existing Aitken and accumulation mode particles, resulting in biased
15
total number concentrations.
References
Barrett, J. C. and Clement, C. F.: Growth rates for liquid drops, J. Aerosol Sci., 19, 223–242, 1988.
Fletcher, N. H.: Size effect in heterogeneous nucleation, J. Chem. Phys. 29, 572–576, 1958.
20
Fluent: FLUENT 6.2 User’s Guide, Fluent Inc., Lebanon NY, USA, 2005.
Girshick, S. L., Chiu, C.-P., and McMurry, P. H.: Time-dependent aerosol models and homoge-neous nucleation rates, Aerosol Sci. Technol., 13, 465–477, 1990.
Hering, S. V. and Stolzenburg, M. R.: A method for particle size amplification by water conden-sation in a laminar, thermally diffusive flow, Aerosol Sci. Technol., 39, 428–436, 2005.
25
AMTD
2, 2217–2239, 2009Modelling Ag-particle activation and growth in a TSI WCPC model
3785
F. Stratmann et al.
Title Page Abstract Introduction Conclusions References Tables Figures
◭ ◮
◭ ◮
Back Close Full Screen / Esc
Printer-friendly Version Interactive Discussion Iida, K., Stolzenburg, M. R., and McMurry, P. H.: Effect of working fluid on sub-2 nm particle
detection with a laminar flow ultrafine condensation particle counter, Aerosol Sci. Technol. 43, 81–96, 2009.
K ¨urten, A., Curtius, J., Nillius, B., and Borrmann, S.: Characterization of an automated, water-based expansion condensation nucleus counter for ultrafine particles, Aerosol Sci. Techol.
5
39, 1174–1183, 2005.
Lazaridis, M., Kulmala, M., and Laaksonen, A.: Binary heterogeneous nucleation of a water-sulphuric acid system: The effect of hydrate interaction, J. Aerosol Sci., 22, 823–830, 1991. Particle dynamics: Fine Particle Model (FPM) for FLUENT, Particle Dynamics GmbH, Leipzig,
Germany, 2005, www.particle-dynamics.de.
10
Pet ¨aj ¨a, T., Mordas, G., Manninen, H., Aalto, P. P., H ¨ameri, K., and Kulmala, M.: Detection efficiency of a water-based TSI condensation particle counter 3785, Aerosol Sci. Technol., 40, 1090–1097, 2006.
Sgro, L. A. and Fernandez de la Mora, J.: A simple turbulent mixing CNC for charged particle detection down to 1.2 nm, Aerosol Sci. Technol. 38, 1–11, 2004.
15
AMTD
2, 2217–2239, 2009Modelling Ag-particle activation and growth in a TSI WCPC model
3785
F. Stratmann et al.
Title Page Abstract Introduction Conclusions References Tables Figures ◭ ◮ ◭ ◮ Back Close Full Screen / Esc
Printer-friendly Version Interactive Discussion 00 00 00 00 00 00 00 00 00 00 00 00 00 00 00 00 00 00 00 00 00 00 00 00 00 00 00 00 00 00 00 00 00 00 00 00 00 00 00 00 00 00 00 00 00 00 00 00 00 00 00 00 00 00 00 00 00 00 11 11 11 11 11 11 11 11 11 11 11 11 11 11 11 11 11 11 11 11 11 11 11 11 11 11 11 11 11 11 11 11 11 11 11 11 11 11 11 11 11 11 11 11 11 11 11 11 11 11 11 11 11 11 11 11 11 11 00 00 00 00 00 00 00 00 00 00 00 00 00 00 00 00 00 00 00 00 00 00 00 00 00 00 00 00 00 00 00 00 00 00 00 00 00 00 00 00 00 00 00 00 00 00 00 00 00 00 00 00 00 00 00 00 00 00 11 11 11 11 11 11 11 11 11 11 11 11 11 11 11 11 11 11 11 11 11 11 11 11 11 11 11 11 11 11 11 11 11 11 11 11 11 11 11 11 11 11 11 11 11 11 11 11 11 11 11 11 11 11 11 11 11 11 00 00 00 00 00 00 00 00 00 00 00 00 00 00 00 00 00 00 00 00 00 00 00 00 00 00 00 00 00 00 00 00 00 00 00 00 00 00 00 00 00 00 00 00 00 00 00 00 00 00 00 00 00 00 00 00 00 00 11 11 11 11 11 11 11 11 11 11 11 11 11 11 11 11 11 11 11 11 11 11 11 11 11 11 11 11 11 11 11 11 11 11 11 11 11 11 11 11 11 11 11 11 11 11 11 11 11 11 11 11 11 11 11 11 11 11 00 00 00 00 00 00 00 00 00 00 00 00 00 00 00 00 00 00 00 00 00 00 00 00 00 00 00 00 00 00 00 00 00 00 00 00 00 00 00 00 00 00 00 00 00 00 00 00 00 00 00 00 00 00 00 00 00 00 11 11 11 11 11 11 11 11 11 11 11 11 11 11 11 11 11 11 11 11 11 11 11 11 11 11 11 11 11 11 11 11 11 11 11 11 11 11 11 11 11 11 11 11 11 11 11 11 11 11 11 11 11 11 11 11 11 11 0 0 0 0 0 0 0 0 0 0 0 0 0 0 0 0 0 0 0 0 0 0 0 0 0 0 0 0 0 0 0 0 0 0 0 0 0 0 0 0 1 1 1 1 1 1 1 1 1 1 1 1 1 1 1 1 1 1 1 1 1 1 1 1 1 1 1 1 1 1 1 1 1 1 1 1 1 1 1 1 0 0 0 0 0 0 0 0 0 0 0 0 0 0 0 0 0 0 0 0 0 0 0 0 0 0 0 0 0 0 0 0 0 0 0 0 0 0 0 0 1 1 1 1 1 1 1 1 1 1 1 1 1 1 1 1 1 1 1 1 1 1 1 1 1 1 1 1 1 1 1 1 1 1 1 1 1 1 1 1 00000000000000000 00000000000000000 00000000000000000 00000000000000000 00000000000000000 00000000000000000 00000000000000000 00000000000000000 00000000000000000 00000000000000000 11111111111111111 11111111111111111 11111111111111111 11111111111111111 11111111111111111 11111111111111111 11111111111111111 11111111111111111 11111111111111111 11111111111111111 0000000 0000000 0000000 0000000 0000000 0000000 0000000 0000000 0000000 0000000 1111111 1111111 1111111 1111111 1111111 1111111 1111111 1111111 1111111 1111111 0000000 0000000 0000000 0000000 0000000 0000000 0000000 0000000 0000000 0000000 1111111 1111111 1111111 1111111 1111111 1111111 1111111 1111111 1111111 1111111 0000000 0000000 0000000 0000000 0000000 0000000 0000000 0000000 0000000 0000000 1111111 1111111 1111111 1111111 1111111 1111111 1111111 1111111 1111111 1111111 0 0 0 0 0 0 0 0 0 0 1 1 1 1 1 1 1 1 1 1 000000 000000 111111 111111 Fill Pump Reservoir Saturator Growth Tube Aerosol Inlet To OPC Porous Media Water
AMTD
2, 2217–2239, 2009Modelling Ag-particle activation and growth in a TSI WCPC model
3785
F. Stratmann et al.
Title Page Abstract Introduction Conclusions References Tables Figures
◭ ◮
◭ ◮
Back Close Full Screen / Esc
Printer-friendly Version Interactive Discussion Fig. 2. Contours of temperature (upper left panel,T), water vapour mass fraction (upper right
panel, H2O), water vapour saturation ratio (lower left panel, S), and heterogeneous nucle-ation probability (lower right panel,P) inside the TSI 3785 WCPC with a saturator temperature
Ts=20◦C and growth tube temperatureTgt=60
◦
AMTD
2, 2217–2239, 2009Modelling Ag-particle activation and growth in a TSI WCPC model
3785
F. Stratmann et al.
Title Page Abstract Introduction Conclusions References Tables Figures
◭ ◮
◭ ◮
Back Close Full Screen / Esc
Printer-friendly Version Interactive Discussion Fig. 3. CPC counting efficiency as a function of particle diameter(a)and cut-offdiameter as
AMTD
2, 2217–2239, 2009Modelling Ag-particle activation and growth in a TSI WCPC model
3785
F. Stratmann et al.
Title Page Abstract Introduction Conclusions References Tables Figures
◭ ◮
◭ ◮
Back Close Full Screen / Esc
Printer-friendly Version Interactive Discussion Fig. 4. Radial distribution of particle size at the growth tube outlet (a) and CPC counting
AMTD
2, 2217–2239, 2009Modelling Ag-particle activation and growth in a TSI WCPC model
3785
F. Stratmann et al.
Title Page Abstract Introduction Conclusions References Tables Figures
◭ ◮
◭ ◮
Back Close Full Screen / Esc
Printer-friendly Version Interactive Discussion Fig. 5. Radial distribution of particle size at the growth tube outlet(a)and CPC counting effi
AMTD
2, 2217–2239, 2009Modelling Ag-particle activation and growth in a TSI WCPC model
3785
F. Stratmann et al.
Title Page Abstract Introduction Conclusions References Tables Figures
◭ ◮
◭ ◮
Back Close Full Screen / Esc
Printer-friendly Version Interactive Discussion Fig. 6. Mode 2 (dp,2=15 nm) axial particle diameter profiles for a bimodal particle size
distri-bution (a, Ts=293.15 K, Tc=333.15 K, dp,1=6 nm, cn,1=104#/cm3), and mode 1 particle di-ameter distribution (b, Ts=293.15 K, Tc=333.15 K, dp,1=6 nm, cn,1=103#/cm3, dp,2=15 nm,
AMTD
2, 2217–2239, 2009Modelling Ag-particle activation and growth in a TSI WCPC model
3785
F. Stratmann et al.
Title Page Abstract Introduction Conclusions References Tables Figures
◭ ◮
◭ ◮
Back Close Full Screen / Esc
Printer-friendly Version Interactive Discussion Fig. 7. Modelled particle number flux at the growth tube outlet(a), and counting efficiency as