Intelligent Photovoltaic Systems by
Combining the Improved Perturbation
Method of Observation and Sun Location
Tracking
Yajie Wang, Yunbo Shi*, Xiaoyu Yu, Yongjie Liu
The Higher Educational Key Laboratory for Measuring & Control Technology and Instrumentations of Heilongjiang Province, School of Measurement–Control Technology and Communications Engineering, Harbin University of Science and Technology, Harbin, China
Abstract
Currently, tracking in photovoltaic (PV) systems suffers from some problems such as high energy consumption, poor anti-interference performance, and large tracking errors. This paper presents a solar PV tracking system on the basis of an improved perturbation and observation method, which maximizes photoelectric conversion efficiency. According to the projection principle, we design a sensor module with a light-intensity-detection module for environmental light-intensity measurement. The effect of environmental factors on the tem operation is reduced, and intelligent identification of the weather is realized. This sys-tem adopts the discrete-type tracking method to reduce power consumption. A mechanical structure with a level-pitch double-degree-of-freedom is designed, and attitude correction is performed by closed-loop control. A worm-and-gear mechanism is added, and the reliability, stability, and precision of the system are improved. Finally, the perturbation and observation method designed and improved by this study was tested by simulated experiments. The experiments verified that the photoelectric sensor resolution can reach 0.344°, the tracking error is less than 2.5°, the largest improvement in the charge efficiency can reach 44.5%, and the system steadily and reliably works.
Introduction
Following the development in the world economy, energy consumption has continuously increased. The burning of fossil fuels causes serious pollution to the environment. As a clean energy, solar energy has experienced increased adoption owing to its immense radiation quan-tity, wide coverage area, and inexhaustible reserves. Therefore, solar photovoltaic (PV) power generation systems have become an inevitable direction in energy development for the future [1–6]. At present, the orientation of solar panels in most solar PV power generation systems is fixed, which leads to low generation efficiency. Solar tracking systems can ensure that solar panels are always oriented toward the sun, which guarantees full photoelectric conversion
a11111
OPEN ACCESS
Citation:Wang Y, Shi Y, Yu X, Liu Y (2016) Intelligent Photovoltaic Systems by Combining the Improved Perturbation Method of Observation and Sun Location Tracking. PLoS ONE 11(6): e0156858. doi:10.1371/journal.pone.0156858
Editor:Xiaosong Hu, Chongqing University, CHINA
Received:February 24, 2016
Accepted:May 22, 2016
Published:June 21, 2016
Copyright:© 2016 Wang et al. This is an open access article distributed under the terms of the
Creative Commons Attribution License, which permits unrestricted use, distribution, and reproduction in any medium, provided the original author and source are credited.
Data Availability Statement:All relevant data are within the paper and its Supporting Information files.
Funding:The authors have no support or funding to report.
efficiency. In recent studies, sun-tracking methods have been mainly using photoelectric and are day-numbered [7,8]. To track the sunlight, a photoelectric tracking system uses photosen-sitive sensors that can measure the sun angle. Although such a system has high sensitivity, it also has dead zones. It is easily affected by the weather and can lose the target or even track a wrong one [7]. By calculating the movement path of the sun, the day-numbered trajectory tracking method can normally work under clouds. However, its tracking precision is low, and its error accumulates. The tracking trajectory needs to be recalculated for different regions. Unable to recognize outside light intensity, this system wastes energy by continuously tracking in low or no light [8]. One of the key technonlgies accelerating the growth of solar energy sources is the power management strategy of the electrochemical energy storage system such as the Li-ion battery pack, supercapacitor pack, and dual buffer [9–13].
To make the PV cells produce more electricity, recent research has focused on maximum power point tracking (MPPT) technology. The use of the MPPT technology makes the utiliza-tion ratio of PV cells higher, and the output reaches a maximum [14–17]. At present, the main methods to realize the MPPT technology include the perturbation and observation method and the constant-voltage tracking method [18,19]. The perturbation and observation method compares the current system output with the previous output to determine the next action and thus realizes MPPT. However, it is subject to tracking the step length. It easily oscillates near the maximum power point. In addition, it cannot distinguish the output variation caused by environmental factors, causing the output to deviate from the maximum power point [20]. The constant-voltage tracking method is an approximate tracking method, which fixes the maxi-mum power point as a constant. This method cannot adjust the output along with the change in conditions, leading to low efficiency and large error [21].
The technical contribution of this study is an intelligent control technology for light percep-tion and MPPT. We design and construct an intelligent tracking solar PV power generapercep-tion system. The core processor of this system is a field-programmable gate array (FPGA). It uses a two-degree-of-freedom (2-DOF) mechanical system and corrects its attitude using closed-loop control. Light-searching sensors are developed using the principle of projection in which a light-intensity sensor unit is combined, making an intelligent light-search perception module. This paper proposes an effective solution to differentiate perturbations, which can avoid oscil-lation near the maximum power point of the perturbation observation method and malfunc-tion under light-intensity variamalfunc-tions. It also maximizes the conversion efficiency of solar PV cells.
System Structure
Overall system structure
The proposed system is primarily composed of an FPGA core controller, a system power sup-ply unit, a MOSFET drive module, a DC/DC conversion unit, a voltage/current detection mod-ule, a sun-positioning recognition modmod-ule, a liquid crystal display (LCD), a motor drive module, a positioning module, and a mechanical structure. The system general structure is shown inFig 1.
Mechanical structure
driving moment caused by external stress. In this manner, the problem of counter driving moment is solved, and the control precision and stability of the system are strengthened.
System operation
The system operation can be divided into three main parts: motor, clock, and MPPT control-lers. The clock is the main component in the system operation. The system only tracks during a set period of time. During this time, the system corrects its attitude at set intervals. If vision is lost (due to environmental factors such as overcast and rainy weather), it will make a fuzzy adjustment according to the current time, which is the first interval when the environmental light intensity exceeds a photosensitive threshold, and it will find a precise position after it Fig 1. Overall system structure.
doi:10.1371/journal.pone.0156858.g001
Fig 2. Mechanical structure.(a) Diagram of the structure. (b) Actual structure.
recovers the vision. In the set period, the system adopts a discrete-type tracking method. The system peripherals, which include the motor, motor drive module, light-tracing sensor module, positioning geminate-transistor module, light-intensity-detection module, and display module, are only charged when a set clock signal appears, and the power is interrupted and maintained in standby mode after the required detection and control. Every evening, the system attitude returns to zero, and the control part stays in the standby mode with low energy consumption. To prolong the battery service life, the system adopts a three-stage charging, which uses the MPPT technology during the large-current charging phase to rapidly provide power and to perform real-time monitoring of the environmental light intensity and battery power. During the small-current and trickle-charging stage, all equipment except the controller runs in a time-discrete mode.
Disturbance Subsystem
MPPT model
According to the relationgs with the output current and voltage of solar photovoltaic cells, can obtain the relations with the output voltage and power, as shown inEq 1.
P¼IphU I0U½expðqU=nkTÞ 1 ð1Þ
whereqis the quantity of electric charge,nis the diode ideal constant,kis Boltzmann constant (1.38×10⁻²³) andTis absolute temperature(°C).
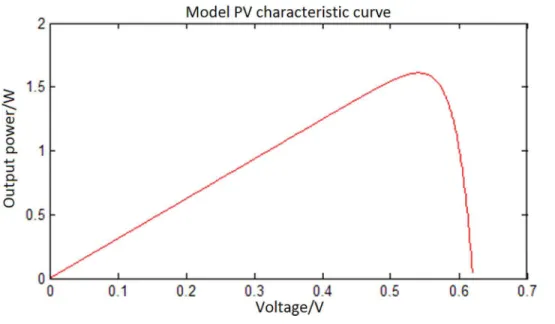
Fig 3shows that a PV battery can reach maximum output power by regulating the external load in a set external environment. As the output power reaches its peak, the output voltage is defined as maximum power point voltageUm, the electric current is defined as maximum power point currentIm, and the output power is defined as maximum power pointPm.Because
of the influence of external factors such as temperature and light intensity, the maximum power point moves when external conditions change. Thus, a technique is needed to find the maximum power point and to obtain the maximum power output using a control algorithm, namely, the MPPT technology [22].
Fig 3. Characteristic P–V curve of PV cells.
Determination of the MPPT method
Realization of MPPT is a dynamic optimization process. The system controller monitors and controls the power through real-time monitoring and by regulating the output voltage and cur-rent strategy of the solar cell. To ensure that the PV cells are dynamically working at the maxi-mum power point, the present output power should be compared with the previously
measured output power, which is memorized in the controller. Then, the interference should be adjusted to increase the output power. The cycle is then repeated. MPPT is implemented as shown inFig 4.
Disturbance observation
This design incorporates a disturbance observation method to realize the MPPT algorithm. The principle is shown inFig 5. The basic principle is to disturb the output voltage of the solar panels using pulse-width modulated (PWM) signals output by the software via the MOSFET driver circuit to continuously monitor the output power and voltage of the PV cells and to compute power variationΔPand voltage variationΔV. IfΔPis positive, the current disturbance
causes the output power of the PV cells to move in the direction of maximum power point, which means that the disturbance is in the right direction. IfΔPis negative, the current
distur-bance causes the PV cell output power to decrease, which means a change in the disturdistur-bance direction is needed and so on untilΔPtends to zero. At this time, the system operates at the
maximum power point and maintains the current duty ratio. Fig 4. Basic schematic of the MPPT.
doi:10.1371/journal.pone.0156858.g004
Fig 5. MPPT scheme.
Improved algorithm model
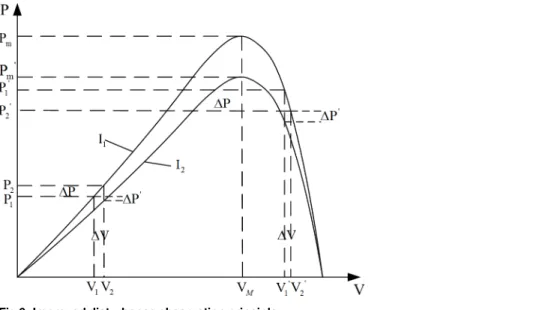
The disturbance observation method suffers from defects such as poor anti-interference and a tendency to oscillate near the maximum power point. To solve these problems, this paper pro-poses an improved disturbance observation method.Fig 6shows that when the current output is to the left of the maximum power point, the next-stateΔPis negative because decreasing
sun-shine strength causes the current power to decrease from P1 to P2. According to the discrimi-nant method of perturbation observation, the controller reduces the output voltageVof the PV cells. However, when the maximum power point is to the right of the current power output, the correct adjustment method increasesV. The same error also exists when the current power output is to the right of the maximum power point. At this moment, the disturbance observa-tion control would perform a wrong operaobserva-tion in response to the illuminaobserva-tion change.
To overcome this shortcoming, we improve the algorithm in this study. The environmental light intensity, monitored asΔP, is classified as positive or negative. WhenΔPis less than zero,
the variation in the environmental lightΔSis also less than zero, which means that the
environ-mental light intensity interferes with the algorithm. When the duty ratio is kept unchanged, if
ΔSis nonnegative (which means that the ambient light does not affect the algorithm), the
direc-tion of the disturbance needs to be changed. Similarly, when bothΔPandΔSis positive, the
light-intensity change interferes with the algorithm, and the output voltage maintains its origi-nal value. Otherwise, the disturbance should continue. The improved disturbance observation also considers the influence ofΔSonΔP. It suppresses the interference from the light-intensity
change and makes up for the defect in algorithm miscalculation caused by the light-intensity changes. Because the adjusted step length of the disturbance observation method is fixed, the output power characteristic of the PV cells is not linear. Therefore, when the disturbance obser-vation reaches the maximum power point, it would overshoot and reverberate in steady state.
Hardware Circuit Design of the Disturbance System
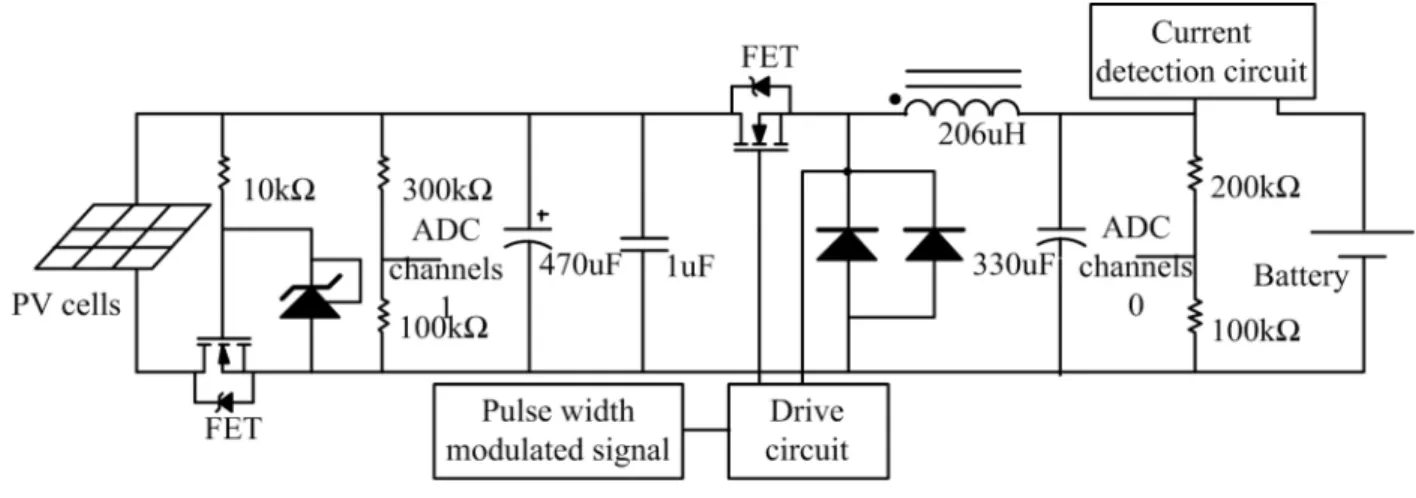
DC/DC conversion circuit
A DC/DC conversion circuit is designed to work together with the MPPT algorithm (to make the output voltage of the PV battery controllable) and to complete the step-charging function
Fig 6. Improved disturbance observation principle.
of the battery. The DC/DC conversion circuit is directly connected to the two modules, PV cells, and battery. Therefore, security must be integrated into the circuit to make the system safe by preventing component damage caused by problems such as wrong operation and con-nection error. The DC/DC conversion circuit is shown inFig 7.
The basic parameters of the DC/DC circuit are designed as follows:
1. The input voltage range is determined by the output characteristics of the PV cells; the value ranges from 13.6 to 21.9 V.
2. The maximum dropout voltage value is 200 mV (the output current ranges from 100 mA to 2.5 A within 1 ms).
3. The maximum output current is 2.5 A.
4. The switching frequency is 100 kHz.
Electrical components parameters of the DC/DC circuit were calculated as follows: The duty ratio ranges from two ratio figures, namely, the ratio of the minimum output to the maximum input and the ratio of the maximum output to the minimum input.
Dmin¼
Vout;min
Vin;max ¼13:6
21:9¼0:621 ð2Þ
Dmax ¼
Vout;max
Vin;min
¼13:6
13:6¼1 ð3Þ
The inductance (L) is chosen according to the principle of maximum voltage difference value and minimum duty ratio.
u¼Ldi dt
L¼ðVin;max VoutÞ Ton
dIout;max
ð4Þ
where the compensating coefficient value ofδis 0.1 andT
onis the PWM conduction time.
InductanceLcan be obtained as
L¼ð21:9 13:6Þ 6:2110
6
0:12:5 ¼206:172mH:
Choosing the capacitance value should meet the condition of 250 mV (100 mA–2.5 A). The calculation expression is
i¼Cdu
dt: ð5Þ
Eq 5can be expressed in vector form as
_
I ¼joCU_: ð6Þ
Eq 6leads to the capacitance expression
C¼
_
I
in which the bandwidth of crossover frequencyfcis obtained as
fc¼
DIout
2pCoutDV
out
ð8Þ
whereΔI
outis the down current,ΔVoutis the dropout voltage, andfcis the crossover frequency.
When the voltage is 10 kHz, the impedance value of the capacitance is obtained by
Zc ¼ DVout
DIout
¼250mV
2:4A ¼104:2mO: ð9Þ
According to the calculation results, in the ZL system of RUBYCON Company, we can obtain the 16-V, 330-μF capacitance parameters as follows:
Ic;rms¼760mA@TA¼105
C
RESR;low¼72mO@TA¼20
C
RESR;low¼220mO@TA¼ 10
C:
The capacitive impedance of the equivalent series resistance (ESR) is obtained by
1
2pf
cCout
¼ 1
6:2810k330¼48mO
Zc
ffiffiffiffiffiffiffiffiffiffiffiffiffiffiffiffiffiffiffiffiffiffiffiffiffiffiffiffiffiffiffiffiffiffiffiffiffiffiffi R2
ESRþ
1
2pf
cCout
2
s
¼pffiffiffiffiffiffiffiffiffiffiffiffiffiffiffiffiffiffiffi722þ482¼86mO:
ð10Þ
The calculation results of the capacitor ESR show that the capacitive impedance is smaller than Zc, which meets the design requirements.
MOSFET driver circuit
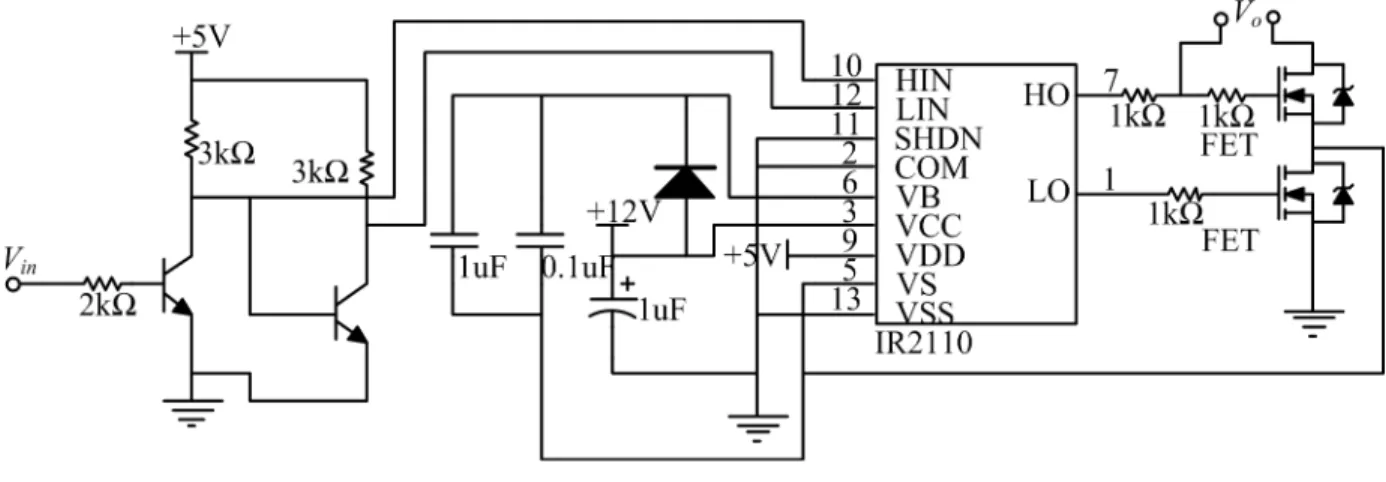
To realize MOSFET switch control, this design uses the IR2110 driver chip made by IR Com-pany (U.S.). This chip, which has the advantages of both light coupling and electromagnetic separation, is the first choice of the driver circuit required in this design. A typical driving cir-cuit is shown inFig 8.
To improve the performance of the driving circuit, the design in this study made some improvements to the traditional driving circuit of the IR2110, such as adopting a high–low end Fig 7. DC/DC conversion circuit.
simultaneous reverse-switching mode, decreasing the charge and discharge times, and making the edge of the drive pulse steeper. Such improvements greatly reduced the problem of MOS-FET output jitter in the threshold voltage and improved the switching speed and frequency. The improved driving circuit significantly increased the controllable range of the output volt-age. After eliminating the jitter, the output voltage value was substantially the same as the theo-retical value obtained by the duty-ratio calculation. The improved IR2110 drive circuit is shown inFig 9, where HO and LO are the high and low drive pulse output ends, respectively, and HIN and LIN are the high and low logic level input ends, respectively.
The improved driving circuit expends less power than the typical one. Compared with the traditional drive circuit, the improved drive circuit eliminates the diode in the DC/DC conver-sion circuit (which is designed to prevent reverse signal flow) and the resistance for charging. The energy expended by the diode and the resistance cannot be ignored, especially that of the Fig 8. MOSFET typical driving circuit.
doi:10.1371/journal.pone.0156858.g008
Fig 9. Improved MOSFET drive circuit.
diode. Its energy dissipation is expressed as
P¼U
2 R
R þUdIL¼1:212W ð11Þ
where the voltage drop of the diode conductionUd= 0.7 V,R= 2 kO, load average voltageUL
= 14 V, and average currentIL= 1.5 A. The voltage of the electric resistance is obtained from the equationUR=UL/D, whereDis the duty ratio, which is equal to 18 V. The improvedfi eld-effect tube increases the low energy consumption on the order of milliwatts, which can be ignored. Therefore, the improved circuit can increase the efficiency of the drive circuit in a bet-ter manner.
A/D conversion circuit
This design incorporates the ADC0809 eight-bit analog/digital (A/D) conversion chip as a modular transition device. The chip has eight input channels. Switching between each channel is realized by an analog switch. The analog signal input in each channel can be successively converted through time-division multiplex access. Because the A/D converter maximum input voltage is limited to a standard voltage, the standard voltage of this design is 5 V, and the high-est voltage converted is 21.9 V. As a result, the measured voltage must be processed into a volt-age that can be identified by the A/D converter. To be collected by the A/D converter, the measured voltage is proportionally decreased to less than 5 V by adopting a resistance divider. The A/D conversion circuit is shown inFig 10.
Current detection circuit
The ACS712 Hall current sensor from Allegro Application Company is used for the current examination. Using a bidirectional DC linear output, it has the characteristics of high sensitiv-ity, high precision, and high cost performance. The ACS712-5 type sensor is used in this design, whose detection ranges from−5 to +5 A. Its accuracy is ±1.5%, the sensitivity is 180– 190 mV/A, the output reference voltage is 2.5 V, and the working temperature is 40–85°C. The detection circuit is shown inFig 11.
Fig 10. A/D converter circuit.
Fig 11shows that the amplifying circuit should be benchmarked against the 2.5-V standard. Because the design demand of the maximum electric current peak is 2 A, the output should be amplified by a factor of five for an output voltage range from 0.65 to 4.35 V, which can easily be collected by the A/D converter. In the diagram, PI+ and PI−are the input and output ports of the detected current, respectively. The analog signal output port is VIOUT.
Other hardware circuit designs
The other hardware circuit designs include the communication alarm circuit, display circuit module, and voltage conversion module.
The communication and alarm circuit uses the general packet radio service (GPRS) com-munication methods, which apply the SIM900A module GPRS comcom-munication solutions. The 1602 LCD is chosen as the display module for real-time display of information such as the time and battery status. To meet the system power supply of each unit and the needs of the different modules on the power supply voltage, a system power supply circuit is designed and con-structed. A 12-V battery is used as the main battery for the supply current. It supplies power to the motor drive module, display module, light-searching sensors, laser tube positioning, and realization of the MPPT circuit and FPGA minimum system using voltage-conversion chips 7808, 2940, and 1117–3.3–5.0.
Software Design
System software general structure design
The following introduces the overall design of the software system: Main working procedure of the system:
1. Initializing the program
2. Calculating the sun trajectory and determining the light intensity and battery level
3. Simultaneously controlling the first attitude and operating the MPPT
4. Connecting the GPRS network Fig 11. Current detection circuit.
5. Running the system
At the very start, the program initializes the processor registers and the system clock and sets the system performance period, standby period, discrete time interval, and the MPPT algo-rithm parameters. Next, the program initializes the A/D converter and GPRS, calculates the sun trajectory, and completes the determination of the current light intensity and battery level. The program roughly adjusts the sun tracking once more, precisely adjusts the position system attitude by photoelectric tracking, completes the first attitude adjustment, and runs the MPPT. While running, the system uses a discrete type of solar tracking with a tracking interval of 10 min, i.e., the system adjusts its attitude at set intervals. In other periods, each module of the tracking subsystem interrupts the power supply and remains in standby. During the running time, if the sun position identification sensor loses the position due to weather factors (such as rainy or cloudy conditions), the program would deal with the situation according to the change in the current light intensity. If the light intensity is higher than the sensory threshold value, the trajectory tracking methods will be chosen. If the light intensity is lower than the threshold power, the system will remain in standby. The charging mode of the system is three-phase charging, and MPPT is used in the large-current charging phase. The communication and alarm circuit varies the current-running state. It transmits an alarm when an exception occurs. The system software process is shown inFig 12.
Software implementation process of the improved disturbance
observation method
The software process of the improved disturbance observation method is shown inFig 13. After initialization, the program first scans the battery level. Tracking of the maximum power point begins when the charging phase is identified as large-current charging. In the MPPT pro-cess, strong ambient lightSis monitored in real time, and its effect on the algorithm is elimi-nated. Meanwhile, the scope of the duty cycle is delimited. When the duty-ratio adjustment reaches the limit of the duty-ratio boundaries, the system judgment is considered incorrect, and the duty ratio will be reset to return the system to its normal state. Proportional–integral–
derivative (PID) control is used in the entire tracking progress. It adjusts the tracking step length, makes the output more stable, and avoids shock.
Duty-ratio-generated subroutines
Duty-ratio-generated subroutines are used to transfer the duty-ratio values coming from the main program into the hardware-identifiable PWM signal. The duty-ratio-generated subrou-tine process is shown inFig 14, which shows that the PWM signal cycle is determined by
“time.”The actual cycle is the product of the crystal vibration cycle and“time.”The pulse width is determined by the reverse threshold“time PWM.”The actual pulse width is the prod-uct of“time PWM”and crystal vibration cycle.
A/D conversion subroutine
Fig 12. Program flow of the system software.
Model Simulation and System Test
MATLAB/Simulink simulation model of perturbation observation
The MPPT simulation model is composed of the PV cell output currentIpvmodel, the MPPT model, which realizes the disturbance observation; the PWM model, which transfers the duty-ratio data into a PWM signal; and the basic circuit link modules. These components must be modeled in the Simulink environment. Each simulation model is modeled according to the equivalent mathematical model of each module.Fig 16shows the basic mathematical model of the disturbance observation method to realize MPPT in which input parametersT,S, andVpv
are the environment temperature, light intensity, and output voltage of the PV cells, respec-tively.Ipvis the actual model current of the PV cells.
Fig 13. Software flowchart of the improved disturbance observation.
The PV cell output current (Ipv) model is determined by formula (1). Its Simulink simula-tion mathematical model is shown inFig 17.T,S, andVpvare quantities of the input control.
Ipvis the output.
Fig 14. Duty cycle-generation software processes.
doi:10.1371/journal.pone.0156858.g014
Fig 15. Program flow of the A/D conversion.
To realize the MPPT model of the disturbance observation, the current power calculation must be completed. Two values are needed: the difference with the previous state voltage and the difference with the previous state voltage. In addition, the duty-ratio adjustment direction should be determined. Finally, the adjusted duty-ratio value is determined. The Simulink model is shown inFig 18.VandIare the input control quantity;Vrefis the output.
Fig 19shows the PWM model that converts the duty-ratio data into a PWM signal. Its input variableVrefis the duty ratio. PWM represents the output PWM signal. The model is used to transfer the input duty ratio to the corresponding PWM signal output.
Analysis of the disturbance observation method simulation results
In this design, the MPPT mathematical simulation is modeled using the Simulink software package, which comes from the MATLAB software, according to the mathematical model of the solar cells. MPPT is performed by a fixed-step-size perturbation observation method. The initial light conditions are set to be 1 kW/m2, the sampling frequency is 1 kHz, and the step length is 5/1000. At the 0.1-s time point, the light intensity drops from 1 to 0.6 kW/m2. TheIpv
waveform changes, as shown inFig 20. The duty-ratio curve is shown inFig 21. The output Fig 16. Disturbance observation of the MPPT Simulink model.
voltage of the maximum power modulation is shown inFig 22, and the data ofFig 22were Table A inS1 File.
Improved MATLAB disturbance observation model
The simulation model that uses a fixed-step-size perturbation observation to achieve MPPT suffers from some problems, i.e., the duty-ratio adjustment process overshoots, and after Fig 17. PV output current simulation model.
doi:10.1371/journal.pone.0156858.g017
Fig 18. Model of the MPPT disturbance observation.
achieving dynamic balance, the duty ratio and the output voltage have a larger amplitude of oscillation. To overcome these shortcomings, the disturbance observation method is improved. By combining a PID control link, the duty-ratio-adjusted step length is gradually shortened as the maximum power point changes to reduce the overshoot and oscillation amplitude.Fig 23
shows the improved disturbance observation method MPPT model. The PID control link is added to the Simulink simulation model, and its programming details are embedded in the file FUZZY_PID.fis. The duty-ratio curve of the improved model is shown inFig 24and the data ofFig 24were in Table B inS1 File. The improved MPPT voltage curve is shown inFig 25.
By comparing the improved simulation waveform with the unimproved one, we can see that after the improvement, the duty-ratio overshoot and steady-state oscillation amplitude obviously decrease. The duty-ratio value and output voltage of the improved model tend to be stable after the model reaches the steady state. The problems of vibration and overshoot are obviously reduced.
Fig 19. PWM generation model.
doi:10.1371/journal.pone.0156858.g019
Fig 20. Solar cell output currentIpvcurve.
System power-consumption test
To obtain the system power-consumption data, a measurement experiment was performed to measure the power consumption of each device module, as listed inTable 1.
The system adopts a low-power design; hence, the energy consumption of each device is obtained by converting its actual operation time. The experimental result shows that the system mechanical structure level adjustment from zero to the maximum limit requires a time of 5 s, and the pitch adjustment from zero to the maximum limit requires 9 s, which means that every 10 min, the longest running time of the system is 9 s. The power consumption of each module is listed inTable 2.
Fig 21. Duty-cycle curve.
doi:10.1371/journal.pone.0156858.g021
Fig 22. Tracking voltage curve of the maximum power point.
Measured system charging efficiency
The measurement experiment selected 30-W monocrystalline silicon solar panels with identi-cal parameters. These solar panels were installed on a 45° south-facing fixed bracket with a pure tracking system and a tracking system that uses the MPPT technology. Each panel charged the same type of 12-V, 55-Ah battery, which was sufficiently discharged to the same state. When the experiment was in progress, the current entering the battery and the terminal voltage were detected in real time. The electric energy received by the battery at this moment was the net energy stored after considering the system power consumption. The current output power of the PV system and its energy storage can be obtained by calculation. The measure-ment experimeasure-ment chose three discontinuous days, charging the system for 11 h from 06:00 to 17:00, and recorded a set of output data every 5 min for a total of 133 sets of data. A time power curve was then drawn, as shown inFig 26, Fig27andFig 28, the data ofFig 26,Fig 27
andFig 28were in Tables C, D and E inS1 File. The system daily output can be calculated by integrating the power over time, as listed inTable 3.
Fig 26shows the system charging efficiency comparison curves of the first measurement experiment from 06:00 to 17:00. The measurement conditions were as follows: temperature, from−9 to 2°C; relative humidity, 59%–79%; weather, fine.
Fig 23. Improved disturbance observation model.
doi:10.1371/journal.pone.0156858.g023
Fig 24. Duty-ratio curve of the improved model.
Fig 27shows the system charging efficiency comparison curves of the second measurement experiment from 06:00 to 17:00. The measurement conditions were as follows: temperature, from−7 to 5°C; relative humidity, 60%–90%; weather, fine.
Fig 28shows the system charging efficiency comparison curves of the third measurement experiment from 06:00 to 17:00. The measurement conditions were as follows: temperature, from−6 to 6°C; relative humidity, 60%–85%; weather, clear to overcast.Fig 28shows that the weather markedly changed at approximately 08:30; the output curve when the sun was covered by clouds is circled in the figure.
The results of the three measurement experiments tended to be the same. This design of the PV system yielded the highest efficiency and could exhibit higher power generation efficiency improvement under different weather conditions. The system efficiency increase could reach 44.49% compared with that of the panels with fixed installation. The efficiency could still increase by 41.55% in a relatively bad rainy day, which proves that the influence of outside con-ditions is relatively small, and this system is stable and reliable.
Fig 25. Improved MPPT voltage curve.
doi:10.1371/journal.pone.0156858.g025
Table 1. Average power consumption of the system device parts.
Equipment LCD Sensors and laser tube Level motor and drive circuit Vertical motor and drive circuit
Power (mW) 824.2 134 8.9 106 1.7 158 8.7
doi:10.1371/journal.pone.0156858.t001
Table 2. Average daily power consumption of the system equipment parts.
System calibration frequency (s) Horizontal maximum correction time (s) Pitch correction time (s)
Motor and drive circuit power consumption (mWh)
Sensors and laser tube power consumption (mWh) LCD power consumption (mWh) Total power consumption (mWh)
72 5 9 538.5 242.8 148.5 929.65
Conclusion
This paper has presented the study and summary of the utilization and prospects of solar PV cells at home and abroad and has pointed out the significance of the PV power generation tech-nology research. In addition, this paper has presented the profound study of the efficiency of the solar tracking and MPPT technology to enhance the mechanism. We designed the system capacity and provided a system technology target.
Fig 26. First comparison curves of the measured charging efficiency.
doi:10.1371/journal.pone.0156858.g026
Fig 27. Second comparison curves of the measured charging efficiency.
Related experiments and simulations to test the system performance as well as the parame-ters were designed. A Simulink simulation model of the disturbance observation method was designed. By comparing the performance of the model before and after the improvement, the superiority of the improved algorithm was proven. A performance-testing experiment on the sun-positioning recognition module was designed. This experiment tested the tracking accu-racy and perspective of the module, the experimental verified that the photoelectric sensor res-olution can reach 0.344° and the maximum tracking error was less than 2.5°. Finally, a charge–
discharge and power-consumption testing experiment was designed, which proved the ratio-nality of the system, the stability of operation, and the high generating efficiency,the experi-mental verified that the power consumption of system perihterals was under 1Wh a day, and the largest improvement in the charge efficiency could reach 44.5%.
Supporting Information
S1 File. Dataset.
(DOC)
Fig 28. Third comparison curves of the measured charging efficiency.
doi:10.1371/journal.pone.0156858.g028
Table 3. Comparison of the total power charging.
State Fixed
installation
Simple tracking MPPT
Total amount (Wh)
Total amount (Wh)
Relativefixed installation efficiency improvement
Total amount (Wh)
Relativefixed installation efficiency improvement
First test 103.17 130.32 26.32% 149.07 44.49%
Second test
105.79 134.76 28.33% 152.25 43.92%
Third test 90.54 107.37 18.59% 128.16 41.55%
Average 99.83 124.15 24.36% 143.16 43.40%
Author Contributions
Conceived and designed the experiments: YJW YBS. Performed the experiments: YJW XYY. Analyzed the data: XYY YJL. Contributed reagents/materials/analysis tools: YJW YBS. Wrote the paper: YJW YBS XYY.
References
1. Zhao JZ, Shi YY, Ma J, Feng Y. Design and implementation of intelligent sun-tracking system[J]. Power System Technology, 2008, 32(24):93–97 (in Chinese).
2. Chen SY, Bao H, Wu CY, Han Y. Direct grid-tie power control method for distributed photovoltaic gener-ation[J]. Proceedings of the CSEE, 2011, 31(10):6–11 (in Chinese).
3. Yang B, Li WH, Zhao Y, He XN. Design and analysis of a grid-connected photovoltaic power system[J]. IEEE Trans on Power Electronics, 2010, 25(4):992–1000 (in Chinese).
4. Yu RJ. Optics and solar energy[J]. ActaOpticaSinica, 2009, 29(7):1751–1755 (in Chinese).
5. Yang XG, Wang YH, Ding N, Kou CR. Development of a system of solar LED street lamp lighting[J]. Transactions of China Electrotechnical Society, 2010, 25(6):130–136 (in Chinese).
6. Cao WH, Li MY, Chen X, Wu M. Novel high-efficient charge controller in independent photovoltaic sys-tem[J]. Journal of Zhejiang University:Engineering Science, 2010, 44(7):1260–1265 (in Chinese).
7. Bian XG, Yang FF, Xin QX. An automatic sun-tracking method in large range[J]. ActaEnerglae Solaris Sinica, 2010, 31(10):1298–1303 (in Chinese).
8. Du CX WP, Ma ZF, Wu YT. The application of day number in calculating the solar position[J]. ActaEner-glae Solaris Sinica, 2011, 32 (11):1640–1645 (in Chinese).
9. Hu XS, Li SB, Peng H. A comparative study of equivalent circuit models for Li-ion batteries[J]. Journal of Power Sources, 2012, 198, 359–367.
10. Hu XS, Sun FC, Zou Y. Online model identification of lithium-ion battery for electric vehicles[J]. Journal of Central South University of Technology, 2011, 18(5), 1525–1531.
11. Zhang L, Wang ZP, Hu XS, Sun FC, David DG. A comparative study of equivalent circuit models of ultracapacitors for electric vehicles[J]. Journal of Power Sources, 2015, 274, 899–906.
12. Zhang L, Hu XS, Wang ZP, Sun FC, David DG. Experimental Impedance Investigation of an Ultracapa-citor at Different Conditions for Electric Vehicle Applications[J]. Journal of Power Sources, 2015, 287, 129–138.
13. Hu XS, Murgovski N, Johannesson LM, Bo E. Comparison of Three Electrochemical Energy Buffers Applied to a Hybrid Bus Powertrain With Simultaneous Optimal Sizing and Energy Management[J]. IEEE Transactions on Intelligent Transportation Systems, 2014, 15(3), 1193–1205.
14. Cai GW, Kong LG, Yang DY, Pan C, Sun ZL. Research on modeling and operation characteristics anal-ysis of Large-Scale wind & light complementary electricity-generating system[J]. Power System Tech-nology, 2012, 36(1):65–71 (in Chinese).
15. Liu LQ, Wang ZX. Variable-voltage MPPT algorithm and simulation of photovoltaic system[J]. Journal of South China University of Technology:Natural Science Edition, 2009, 37(2):140–146 (in Chinese).
16. Femia N, Petrone G, Spagnuolo G, Massimo V. A technique for improving P&O MPPT performances of double-stage grid-connected photovoltaic systems[J]. IEEE Transaction on Industrial Electronics, 2009, 56(11):4473–7782.
17. Jiao Y, Song Q, Liu H. Practical simulation model of photovoltaic cells in photovoltaic generation sys-tem and simulation[J]. Power Syssys-tem Technology, 2010, 34(11):198–202 (in Chinese).
18. Neil SD, Luiz AC, Liu XJ. Comparative study of variable size perturbation and observation maximum power point trackers for PV systems[J]. Electric Power Systems Research, 2010(80: ):296–305.
19. Hohm DP, Ropp ME. Comparative study of maximum power point tracking algorithms[J]. Progress in Photovoltaic:Research and Applications, 2003, 11(1):47–62.
20. Rodriguez C, Amaratunga GAJ. Analytic solution to the photovoltaic maximum power point problem[J]. IEEE Trans on Circuit and Systems, 2007, 54(9):2054–2060.
21. Cao WH, Li MY Cen X. Independent photovoltaic system efficient charging controller design[J], Journal of Zhejiang University(Engineering Science), 2010, 44(7):1260–1265.