Communications in Plant Sciences (July-December 2016), Volume 6, Issues 3-4, Pages 55-60 Commun. Plant Sci. (ISSN 2237-4027)
www.complantsci.wordpress.com
Manuscript received on August 20, 2016, and published on October 18, 2016
Correlation analysis for yield and fiber quality traits in upland cotton
Muhammad Yaqoob1, Sajid Fiaz1,2*, and Babar Ijaz1,3
1
Department of Plant Breeding & Genetics, University of Agriculture Faisalabad, Pakistan. 2
State key laboratory of Rice Biology, China National Rice Research Institute, Hangzhou 310006, China. 3
Department of Plant Genetics and Breeding, China Agricultural University, Beijing, 100193, China.
ABSTRACT
Yield and fiber quality are most important and complex trait as they depend on interaction of genetic architecture of plant and environment. To achieve this objective, two parents FH153, KZ191 and their F2 population were evaluated for the existence of inter-relationship of characters under study during 2014-2015, at University of Agriculture, Faisalabad. The experiment was carried out in a randomized complete block (RCB) design with three replications. Data were recorded for Plant height (cm), number of sympodial branches, number of monopodial branches, pedicel length (mm), number of bolls per plant, number of seed per boll, boll weight (g), ginning out turn (%), fiber fineness (μ/inch), staple length (mm), fiber strength (g/tex), seed cotton yield (g). The obtained data were analyzed through correlation analysis at 0.01 and 0.05 significance level. The traits under study showed considerable range of phenotypic variability. The parent FH153 had maximum mean value for all traits under observation expect fiber strength. The parent KZ191 showed maximum fiber strength (21.1 g/tex). The F2 population of parents (FH153×KZ191) had minimum results for all traits. The results also showed positive association of characters with each other except staple length showed negative association with monopodial branches per plant, fiber strength and seed cotton yield.
Keywords:Gossypium hirsutum, Correlation, Cotton, Fiber quality, Yield.
______________________________ *Corresponding author
INTRODUCTION
Cotton (Gossypium hirsutum) is an important cash crop playing a crucial role in economy of Pakistan. Cotton is a multipurpose crop providing fiber, edible oil and seed cake. About 1.5 million population of Pakistan earn their livelihood from the cultivation of cotton (Hussain et al. 2010). Fiber quality in cotton has supreme importance as yield, which involves growers, ginners and the textile industry simultaneously. Ginners prefer high ginning percentage. Fiber quality is the main interest of textile industry whereas, farmer does not compromise on yield (Tyagi 1987).
Due to its importance, cotton crop has attracted plant breeders to improve the genetic architecture of cotton plant. These efforts have led to the development of high yielding cotton cultivars by improving the quality traits and yield potential through breeding (Shabbir et al. 2016). Since, further genetic improvements are possible. Therefore, cotton breeders should continue their efforts to develop varieties with better quality and higher yield. The knowledge of character association affecting yield is very important for an effective plant breeding programme. In cotton breeding program, the improvement in lint yield is not the only objective but fiber quality characters like length, strength and fineness etc. are also important in textile industry. Science of plant breeding has a documented history of cotton improvement to meet the producer and processor requirements.
Cotton plant traits are linked naturally, so improvement in one trait may affect other traits. Determination of correlation coefficient is the most effective method to study strength and nature of association among traits. The present study was conducted to find correlation among plant height, number of monopodial branches, number of sympodial branches, pedicel length, number of bolls, number of seeds per boll, boll weight, ginning out turn, fiber fineness, fiber strength, staple length and seed cotton yield.
MATERIAL AND METHODS
General information. The experiment was comprised of parents FH153, KZ191 and their F2 population. They were sown in the field area of the Department of Plant Breeding and Genetics, University of Agriculture Faisalabad during normal cotton growing season of the year 2014. The experiment was laid out in randomized complete block design (RCBD) with three replications. Each replication contained one row for each parent and 15 rows for F2 population. Row to row and plant to plant distance was 30 cm and 75 cm respectively. All
agronomic practices were followed from sowing till harvest. At maturity, the data was collected from 5 guarded plants from each row of the following traits.
Observed traits. Plant height (cm), Number of sympodial branches, Number of monopodial branches, Pedicel length (mm), Number of bolls per plant, Number of seed per boll, Boll weight (g), Ginning out turn (%), Fiber fineness (μ/inch), Staple length (mm), Fiber strength (g/tex), Seed cotton yield (g).
Statistical analysis. The data collected was subjected to analysis of variance following the method as in Steel et al. (1997) in order to determine the significant differences in plant characters among the genotypes under study. The characters showing significant differences among the hybrids/parents were further analyzed for correlation coefficients, calculated by the formula as outlined by Dewey and Lu (1959) using Minitab programme of computer.
RESULTS AND DISCUSSION
The analysis of variance revealed that the parents and the F2 population showed significant difference for various traits under study, indicating a considerable range of genetic variability. Parents FH153, KZ191 and F2 population had a mean plant height of 105.4cm, 103.1cm and 99.3cm respectively. Plant height had positive influence on the characters under study (Table 1).
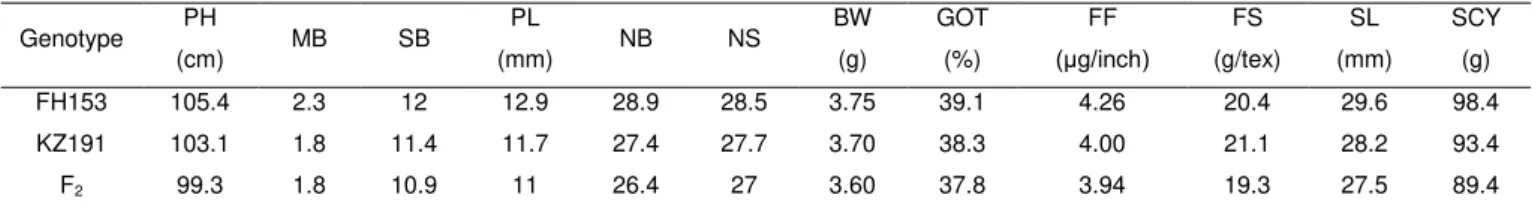
Table 1. Mean of the parents and F2 population for yield and quality traits. plant height (PH, cm), number of monopodial
branches (MB), number of sympodial branches (SB), pedicel length (PL,mm) , number of bolls per plant (NB), number of seed
per boll (NS), boll weight (BW,g), ginning out-turn (GOT%), fiber fineness (FF,μg/inch), fiber strength (FS,g/tex), staple length
(SL,mm) and seed cotton yield (SCY,g).
Genotype PH
(cm) MB SB
PL
(mm) NB NS
BW (g) GOT (%) FF (μg/inch) FS (g/tex) SL (mm) SCY (g)
FH153 105.4 2.3 12 12.9 28.9 28.5 3.75 39.1 4.26 20.4 29.6 98.4
KZ191 103.1 1.8 11.4 11.7 27.4 27.7 3.70 38.3 4.00 21.1 28.2 93.4
F2 99.3 1.8 10.9 11 26.4 27 3.60 37.8 3.94 19.3 27.5 89.4
Table 2. Correlation matrix among the traits, plant height (PH, cm), number of monopodial branches (MB), number of sympodial
branches (SB), pedicel length (PL,mm), number of bolls per plant (NB), number of seed per boll (NS), boll weight (BW,g),
ginning out-turn (GOT%), fiber fineness (FF,μg/inch), fiber strength (FS,g/tex) ,staple length (SL,mm) and seed cotton yield
(SCY,g).
PH
(cm) MB SB
PL
(mm) NB NSB
BW
(g) GOT%
FF (μg/inch) FS (g/tex) SL (g)
MB 0.693**
SB 0.522** 0.539**
PL 0.789** 0.693** 0.724**
NB 0.389** 0.407** 0.520** 0.536**
NSB 0.611** 0.475** 0.380** 0.556** 0.487**
BW -0.050 0.070 0.005 0.114 0.096 0.206
GOT% 0.396** 0.424** 0.318** 0.444** 0.231 0.230 0.104
FF 0.565** 0.643** 0.480** 0.749** 0.464** 0.372** 0.091 0.525**
FS 0.652** 0.470** 0.501** 0.591** 0.335** 0.464** 0.019 0.218 0.451**
SL -0.390** -0.308* -0.208 -0.180 -0.076 -0.163 -0.122 -0.050 0.041 -0.397**
SCY 0.925** 0.727** 0.608** 0.870** 0.458** 0.650** 0.056 0.421** 0.655** 0.633** -0.267*
*=significant
**= highly significant
and Farooq et al. (2013) observed similar results. The parent FH153 had maximum pedicel length (12.9mm) followed by parent KZ191 (11.4mm).
The F2 population showed lowest sympodial branches (11mm). Pedicel length showed positive association with number of bolls, number of seeds per boll, ginning out turn, fiber fineness, fiber strength and seed cotton yield. The genotype FH153 had maximum number of seeds per bolls (28.5) while less number of seeds per bolls (27.4) was observed in KZ191. The F2 population showed lowest number of seeds per bolls (27). Number of seeds per boll showed positive association with fiber fineness, fiber strength and seed cotton yield. Akbar et al. (1994), Bibi et al. (2011) also observe the positive association among these traits. The parent FH153 had maximum number boll weight (3.75g) followed by KZ191 (3.70G) and F2 population with (3.60g). It was observed that boll weight had no positive or negative association with ginning out turn, fiber fineness, fiber strength, staple length and seed cotton yield. Baloch et al. (2001) reported that boll weight had negative relationship with seed cotton yield.
Xu et al. (2003) reported that boll weight had negative association with number of bolls per plant and lint percentage. Rasheed et al. (2009) and Salahuddin et al. (2010) reported that boll weight had positive correlation with seed cotton yield.
Parents FH153 and KZ191 had maximum 39.1% and 38.3% followed by F2 population (37.8%) mean value for ginning out turn percentage. GOT% showed positive association with fiber fineness and seed cotton yield. Desalegn et al. (2009) found that high lint percentage showed positive correlation with high cotton lint yield. However they observed negative correlation between fiber length and the fineness indicator (micronaire), short fiber index and uniformity ratio. The parent FH153 and KZ191 showed maximum
(4.26μg/inch) and (4.00μg/inch) followed by F2 population (3.94μg/inch) mean value for fiber fineness.
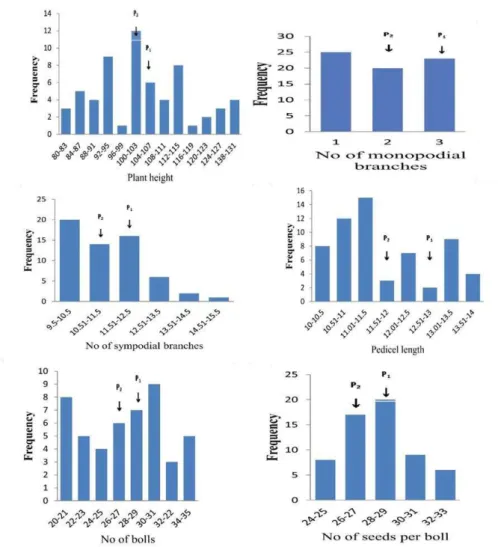
Figure 1. Frequency distribution of parents (FH153, KZ191) and F2 population for plant height, number of monopodial branches, number of sympodial branches, pedicel length and number of bolls per plant and number of seed per boll.
number of monopodial branches and plant height. Chao-zhu et al. (2007) observed positive correlation among boll weight, boll number and lint percentage. Desalegn et al. (2009) found negative correlation between fiber length and fiber fineness. The parent KZ191 had maximum (21.1g/tex) followed by FH153 with (20.4g/tex) and F2 population with (19.3g/tex) mean value for fiber strength. It was observed that fiber strength had positive association with seed cotton yield but had negative association with staple length. Karadimer et al. (2010) reported that negative correlation was found between fiber length and seed cotton yield but fiber length and fiber strength positively associated with each other.
Mendez-Natera et al. (2012) studied that fiber strength negatively correlated with cotton seed yield. The parent FH153 showed maximum (29.6mm) followed by KZ191 (28.2mm) and F2 population had (27.5mm) staple length. It showed negative association with fiber strength and seed cotton yield by Bing et al. (1996), Asif et al. (2008) and Karadimer et al. (2010) also observe Similar result confirming staple length had negative association with seed cotton yield, fiber strength and fiber fineness.
CONCLUSION
The parent FH153 showed maximum results for all the character under study followed by parent KZ191 whereas, F2 population showed minimum mean value for all the traits. The characters like plant height, sympodial branches per plant, pedicel length, number of bolls per plant, number of seed per boll, ginning out turn and fiber fineness had positive association for all other character under observation. Some character like monopodial branches per plant, fiber strength and seed cotton yield showed negative association with staple length. The correlation analysis suggested that selection based on the positive association of these characters with each other would be quite effective to improve the yield and fiber quality in upland cotton.
References
Akbar M et al. 1994. Genetic correlation, path coefficient and heritability estimates of some important plant traits in upland cotton. Pak J Agric Sci 31:47-50.
Ahuja SL et al. 2006. Comparative yield component analysis in
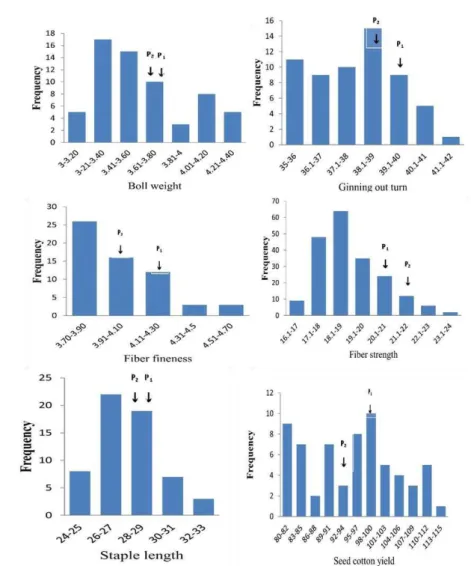
Figure 2. Frequency distribution of parents (FH153, KZ191) and F2 population for boll weight, ginning out turn, fiber fineness, fiber strength, staple length and seed cotton yield.
Annapurve SN et al. 2007. Correlation study of yield contributing characters in American cotton. J Cotton Res Dev 21:16-20. Asif JI et al. 2008. Genetics analysis for the fiber quality traits of
some cotton genotype. Pak J Bot 40:1209-1215.
Azhar FM et al. 1999. Path coefficient analysis of some advanced generation progenies of G. hirsutum L. Int J Agri Biol Sci 1:85-87. Baloch MJ et al. 2001. Path coefficient analysis for assesing direct
and indirect effects on yield in (Gossypium hirsutum). J Biol Sci 1:354-355.
Bibi M et al. 2011. Genetics divergence and association among polygenic characters in Gossypium hirsutum L. Pak J Bot 43:2751-2758.
Bing T et al. 1996. Evaluation of Genetic variances and Correlation for yield and fiber traits among cotton F2 hybrid populations. Euphytica 91:315-322.
Chattha WS et al. 2010. Correlation analysis of quality and yield contributing traits in upland cotton (Gossypium hirsutum L). Int J Mod Agri 2:95-101.
Chao-zhu X et al. 2007. Heterosis performance and correlation analysis on economic traits of upland cotton in different ecological environments. Cotton Sci 19:3-7.
Desalegn ZN et al. 2009. Correlation and heritability for yield and fiber quality parameters of Ethiopian cotton (Gossypium hirsutum
L.) Estimated from 15 (diallel) Crosses. Kasetsart J Nat Sci 43:1-11.
Echekwu CA. 2001. Correlation and correlated responses in upland
cotton (Gossypium hirsutum L.). Tropicaltura 19:210-213.
Farooq JM et al. 2013.Association and path analysis of earliness, yield and fiber related traits under cotton leaf curl virus (CLCuV) intensive conditions in Gossypium hirsutum L. Plant Knowl J 2:43-50.
Hussain SS et al. 2000. Path coefficient and correlation analysis of some important plant traits of G. hirsutum L. Pak J Biol Sci 3:1399-1400.
Hussain S et al. 2010. Evolution of performance, genetic divergence and character association of some polygenic traits in upland cotton. J Agric Soc Sci 6:79-82.
Karademir E et al. 2010. Relationship between yield, fiber length and other fiber-related traits in advanced cotton strains. Notulae Bot Hort Agrobot Cluj-Napoca 38:111-116.
Mendez-Natera JR et al. 2012. Genetic study in upland cotton. Three genetic parameters, correlation and path analysis. SABRAO J. Breed. Genet 44:112-128.
Naveed M et al. 2004. Estimates of heritability and correlations among seed cotton yield and its components in Gossypium hirsutum L. Int J Biol 6:712- 714.
Pandey SK et al. 2003. Analysis of character association in upland cotton (Gossypium hirsutum L.). Prog Agric 3:139-140.
Rahman SA et al. 2013. Cause and effect estimates for yield contributing and morphological traits in upland cotton (Gossypium hirsutum L.). J Agric Res 51:393-398.
analysis of yield and fiber traits in upland cotton. J Res 24:3-4. Rasheed A et al. 2009. Genetic evaluation of fiber yield and yield
components in fifteen cotton (Gossypium hirsutum) genotypes. Int J Agric Biol 11:581-585.
Rauf S et al. 2004. Correlation and path coefficient analysis of components of yield in cotton (Gossypium hirsutum L.). Int J Agric. Biol 6:686-688.
Salahuddin S et al. 2010. Correlation and path coefficient analysis of yield components of upland cotton (Gossypium hirsutum L). World Appl Sci J 8:71-75
Shabbir RH et al. 2016. Genetic divergence assessment in upland cotton (Gossypium hirsutum L.) using various statistical tools. J Glob Innov Agric Soc Sci 4:62-69.
Shahbaz A. 2004. Genetic linkage studied for drought tolerant and agronomic traits in upland cotton. M.Sc. Thesis, Deptt. Plant Breeding and Genetics, Uni. Agri. Faisalabad.
Tyagi A.P. 1987. Correlation studies on yield and fiber traits in upland cotton. Theor Appl Genet 74:280-283.