http://periodicos.uem.br/ojs/acta ISSN on-line: 1807-8621
Doi: 10.4025/actasciagron.v40i1.39364 GENETICS AND PLANT BREEDING
Interrelations between agronomic and technological fiber traits in
upland cotton
Paulo Eduardo Teodoro1*, Luiz Paulo de Carvalho2, Josiane Isabela Silva Rodrigues2, Francisco José Correia Farias2, Pedro Crescêncio Souza Carneiro3 and Leonardo Lopes Bhering3
1
Universidade Federal de Mato Grosso do Sul, Rodovia MS-306, Km 305, 75560-000, Chapadão do Sul, Mato Grosso do Sul, Brazil. 2Empresa Brasileira de Pesquisa Agropecuária, Embrapa Algodão, Campina Grande, Paraiba, Brazil. 3Departamento de Biologia Geral, Universidade Federal de Viçosa, Viçosa, Minas Gerais, Brazil. *Author for correspondence. E-mail: [email protected]
ABSTRACT. Fiber length stands out among technological traits as one that still needs to be improved in cotton. Thus, the objectives of this work were to quantify the interrelations between agronomic and technological fiber traits and to identify traits that could be used for the indirect selection of cotton genotypes with longer fiber lengths. Agronomic and technological traits were evaluated in 36 elite lines of cotton that were cultivated in three environments. Canonical correlations were estimated between two groups of traits: agronomic and technological. Path analysis was performed that considered fiber length as the primary dependent variable. The genotypes presented variability in all the evaluated traits, and no significant genotype vs. environmental interaction was observed for any of them. The main technological traits of cotton crops can be improved by an indirect selection of agronomic traits. The selection of cotton genotypes with a smaller size and a higher mean boll weight can be used to increase fiber length and improve other technological traits. Selection indices containing plant height, mean boll weight, fiber strength, and fiber uniformity can be one of the main strategies for the selection of cotton genotypes with a high yield of cotton bolls and long fibers.
Keywords: Gossypium hirssutum L.r. latifolium Hutch; path analysis; canonical correlations; indirect selection; fiber quality.
Inter-relações entre caracteres agronômicos e tecnológicos de fibra em algodoeiro
herbáceo
RESUMO. Dentre os caracteres tecnológicos que ainda precisam ser melhorados no algodoeiro, destaca-se o comprimento das fibras. Deste modo, os objetivos com este trabalho foram quantificar as inter-relações entre caracteres agronômicos e tecnológicos de fibras e identificar caracteres que possam ser utilizados para a seleção indireta de genótipos de algodoeiro com maior comprimento de fibras. Foram avaliados caracteres agronômicos e tecnológicos em 36 linhagens elite de algodoeiro cultivadas em três ambientes. Foram estimadas as correlações canônicas entre dois grupos de caracteres: agronômicos e tecnológicos. Realizou-se análise de trilha considerando o comprimento de fibras como variável dependente principal. Os genótipos apresentaram variabilidade para todos os caracteres avaliados e não houve interação genótipos x ambientes significativa para nenhum caráter. É possível melhorar os principais caracteres tecnológicos do algodoeiro a partir da seleção indireta em caracteres agronômicos. A seleção de genótipos de algodoeiro com menor porte e maior peso médio de capulhos pode ser uma estratégia para aumentar o comprimento de fibras e melhorar os demais caracteres tecnológicos. Índices de seleção contendo altura de plantas, peso de capulhos, resistência e uniformidade de fibras é uma das principais estratégias para selecionar genótipos de algodoeiro com alta produtividade de algodão em caroço e fibras longas.
Palavras-chave: Gossypium hirssutum L.r. latifolium Hutch; análise de trilha; correlações canônicas; seleção indireta; qualidade de fibras.
Introduction
Upland cotton (Gossypium hirssutum L.r.
latifolium Hutch.) produces one of the most important textile fibers in the world, being one of the most economically important crops in Brazil (Carvalho, Farias, & Rodrigues, 2015a). In the world
scenario, Brazil is the fifth largest cotton producer, accounting for 3.8 million tons produced in the 2016/17 harvest (Conab, 2017).
Page 2 of 7 Teodoro et al.
during spinning and baling, lower content of short fibers, and greater uniformity of length and mature fibers. All these traits are desirable to increase the processing speed in the textile industry (Smith, Hague, Hequet, Thaxton, & Brown, 2008).
For the promotion of the production of cotton with high quality fibers, American producers receive financial support to meet and exceed market standards. Studies involving technological traits have been the main focus of many cotton breeders (Ng, Smith, Hequet, Hague, & Dever, 2015). Fibers length is among the technological traits that still need to be improved, thus, it is essential the knowledge on correlations between agronomic and technological traits in breeding programs is essential. This is because when the selection is carried out based on one trait, changes occur in other traits of agronomic importance that are correlated with each other. In this sense, two biometric techniques stand out to direct the multiple trait selection strategies: canonical correlations and path analysis.
Canonical correlations are appropriate to estimate the relationship between two groups of traits of interest. This analysis consists of obtaining canonical functions, constituted by pairs of statistical variables, in order to quantify the interrelationship between the groups of traits of interest. Each variable of a pair is a linear combination of the traits of that group. The maximum number of canonical functions that can be obtained is equal to the number of traits in the smallest group. The first canonical pair is obtained by maximizing the correlation between linear combinations of groups of traits. The second canonical pair is also obtained to show the largest relation between groups of traits that had not been explained by the first pair, and the same happens to the other canonical pairs (Cruz et al., 2012).
Path analysis, proposed by Wright (1921), allows for a better understanding of the association of different traits, by the unfolding of the correlation coefficients into direct and indirect effects on the main trait (Corrar et al., 2007). Estimates of these effects are obtained by regression equations, in which the variables are previously standardized. However, few studies have used these analyses to select traits in cotton crop (Hoogerheide, Vencovsky, Farias, Freire, & Arantes, 2007; Farias et al., 2016a), and most of them considered fiber yield as the main dependent variable. Thus, the objectives of this work were to quantify the interrelations between agronomic and technological traits of fibers, and to identify traits that could be used for the indirect selection of cotton genotypes with longer fibers length.
Material and method
Field trials
The trials obtained data by evaluating 36 elite lines derived from the crossing between Guazuncho 2 and Acala SJ4, which represented long fibers. To obtain these lines, the seeds from this crossing were
multiplied from the F2 to F4 generation in the
greenhouse. The genealogical selection procedure was adopted from the F4 generation; in this last
generation, 271 plants were obtained, and 51 F4:5
plants with fiber lengths ≥ 31 mm were selected.
These lines were evaluated by Carvalho et al. (2015a), and 34 plants with fiber lengths above 32 mm were selected and evaluated in the next
generation (F5:F6). Of these, 32 lines with fiber
lengths greater than 32 mm were also selected. These lines were evaluated in three trials located in Apodi, Rio Grande do Norte State (2013 and 2014) and Santa Helena, Goiás State (2013) in a randomized block design with two replications. The trials established in Apodi were installed under an irrigation regime, and the trial established in Santa Helena was installed under a rainy season regime. The plot consisted of two 5-m rows that were spaced 0.80 m apart with 60 plants per row. Cultural treatments followed the recommendations for cotton cultivation: herbicide was used for weed control, and pest control was carried out according to the integrated pest management recommendation for crops in the region.
Evaluated traits
The evaluated agronomic traits were plant height (PH, cm), mean boll weight (MBW, g), fiber percentage (FP, %), and cotton boll yield (CBY, kg
ha-1). The following fiber technological traits were
evaluated in 20 bolls of each experimental unit by using the HVI device (high volume instrument) from the Embrapa Cotton Fibers Laboratory: upper-half mean length (UHM, mm), fiber uniformity (UNIF, %), short fiber index (SFI, %), fiber
strength (FS, gf tex-1), elongation (ELONG), fiber
maturity (FM, %), micronaire (MIC, ug pol-1) and
degree of yellowing (+b).
Statistical analyses
Initially, individual variance analyses were performed for each trait. However, after discovering that the relationship between the largest and the smallest mean square of the environmental residue did not exceed the 7:1 ratio (Pimentel-Gomes, 2009), a joint variance analysis was carried out according to the statistical model described in Equation 1:
where: Yijk is the observation in the kth block
evaluated in the ith genotype and jth environment, μ
is the overall mean of the experiments, B/Ejk is the
effect of block k within environment j, Gi is the
effect of the ith genotype considered as random, Ejis
the effect of the jth environment considered as fixed,
GEijis the random effect of the interaction between
genotype i and environment j, and eijk is the random
error associated with observation Yijk.
The phenotypic correlations (rF) between the
pairs of traits were estimated according to Equation 2:
= ( )
× (2)
where: COVF(XY) is the phenotypic covariance
between traits X and Y, is the phenotypic
variance of trait X, and is the phenotypic
variance of trait Y. A correlation network was used to graphically express the functional relationship between estimates of the phenotypic correlation coefficients between traits, where the proximity between nodes (traces) was proportional to the absolute value of the correlation between those nodes. The thickness of the edges was controlled by applying a cut-off value of 0.60, which meant that
only |rij| ≥ 0.60 had their edges highlighted.
Finally, positive correlations were highlighted in black, while negative correlations were represented in gray scale.
Subsequently, a multicollinearity diagnosis of the X’X correlation matrix was performed, which revealed severe multicollinearities (condition number > 1000) according to the classification from Montgomery and Peck (2001). Therefore, to perform the path analysis and canonical correlations, a constant k = 0.10 was added to the diagonal of the X’X matrix, which provided weak multicollinearity (condition number < 100).
For the analysis of canonical correlations, two groups of traits were established: group I, which consisted of agronomic traits (PH, FP, MBW, and CBY), and group II, which consisted of technological traits (UHM, UNIF, SFI, ELONG, FM, MIC, and b). The first canonical correlation
(r1) between a linear combination of the traits in
groups I and II was estimated by equation 3:
= (3)
where: λ1 is the greatest eigenvalue of matrix
Hobtained by equation 4:
= 1.1⋮ …⋱ ;⋮
; … 1.1
× 1.1 …⋮ ⋱ ⋮;
; … 1.1
×
× 1.1⋮ …⋱ ⋮ ;
; … 1.1
× 1.1 …⋮ ⋱ ⋮;
; … 1.1
(4)
Equations 5 and 6 were used to obtain the first
canonical pair, which was composed of XI and YI and
are linear combinations between group I and group II traits:
= ′ (5)
= ′ (6)
where: a’ and b’ were eigenvectors associated with the first eigenvalue of the matrix H, and X and Y were vectors that measured the traits that made groups I and II, respectively. The other three canonical correlations and canonical pairs were estimated from the expressions described above by using eigenvectors associated with the eigenvalues in descending order.
Path analysis, which considered fiber length (UHM) as the main dependent variable, was performed using the model described in equation 7:
= + + ⋯ + + (7)
where: β1, β2, …β11 were the direct effect estimates for
traits PH, FP, MBW, CBY, UNIF, SFI, FS,
ELONG, MIC, and b on UHM, and pεwas the
residual effect of the analysis. Thus, a normal system of equations was used to estimate the direct and indirect effects of each explanatory variable on UHM according to equation 8:
1.1 … ;
⋮ ⋱ ⋮
; … 1.1
× ⋮ = ;⋮
;
(8)
The coefficient of determination (R²) from the path analysis was obtained by equation 9:
² = ; + ⋯ + ; (9)
The residual effect (pˆε) of the path analysis was
obtained by equation 10:
Page 4 of 7 Teodoro et al.
All statistical analyses were performed using the GENES software (Cruz, 2013) and followed the procedures recommended by Cruz et al. (2012).
Result and discussion
Joint analysis of variance
The F test revealed a significant relationship (p < 0.05) between cotton genotypes for all agronomic (Table 1) and technological (Table 2) traits, which allowed for the inference of existing genetic variability between genotypes (Table 1). The coefficient of variation was inferior to 20% of all the evaluated traits, as it was similar to those obtained in published papers studying cotton (Freitas, Leandro, & Carvalho, 2007; Araújo et al., 2013; Jerônimo et al., 2014; Carvalho et al., 2015a, Carvalho, Farias, Morello, Rodrigues, & Teodoro, 2015b; Carvalho, Farias, Morello, & Teodoro, 2016a, Carvalho, Farias, Morello, & Teodoro, 2016b; Queiroz et al., 2017a; Santos et al., 2017). No significant G x E interaction was observed for the evaluated traits, which indicates similar phenotypic performance for the traits in these three environments. Therefore, the phenotypic correlations were estimated by the genotype means in the three environments (Table 2).
Phenotypic correlations
To facilitate the interpretation of phenotypic correlations between agronomic and technological traits, a two-dimensional correlation network was used to detect complex phenotypic patterns that were difficult to extract using other techniques (Figure 1). In the correlation network, significant correlation values from the t-test were highlighted with bold edges, negative correlations were expressed in gray lines, and positive correlations were expressed in black lines. The efficiency of this innovative technique has already been reported by Ursem, Tikunov, Bovy, Berloo, and Eeuwijk (2008), Dileo, Strahan, Bakker, and Hoekenga (2011), and Silva, Rêgo, Pessoa, and Rêgo (2016).
PH negatively correlated with the traits MBW, FP, UHM, FM, UNIF and ELONG (Figure 1). This
result indicates that plants of higher fiber quality generally have smaller size, higher mean boll weight, and higher fiber percentage. Silva, Ferreira, and Cassia (2011) reported that genotypes with smaller size minimize losses from lodging and compaction caused by the harvester. MBW positively correlated with FP, UHM and MIC and negatively correlated with SFI and ELONG. Carvalho, Baroso, Santos, and Alves (2005) reported that this trait is one of the main components of upland cotton production and is linearly related to fiber percentage. The positive correlation between FP and ELONG indicates that genotypes with higher fiber percentage, apart from increasing the profitability of upland cotton production, also have greater elasticity in the traction of fibers during textile processing.
Table 1. Summary of the joint analysis of variance for the agronomic traits plant height (PH), mean boll weight (MBW), fiber percentage (FP), and cotton boll yield (CBY) evaluated in 36 cotton genotypes cultivated in three environments in Brazil.
SV DF PH MBW FP CBY
Blocks/Environments 3 849.72 2.21 62.21 2.382.431.86 Genotypes (G) 35 600.72* 3.48* 90.71* 2.688.557.31* Environments (E) 2 21.998.65* 43.63* 57.84ns 46.311.651.59* G x E 70 118.97ns 0.62ns 12.08ns 1.340.192.92ns
Residue 105 291.03 1.16 29.33 1.547.672.00 CV (%) --- 15.98 16.92 15.24 16.29
MSr+/MSr- --- 1.88 2.4 2.4 1.31
ns and *: not significant and significant at 5% probability by the F test, respectively; SV: sources
of variation; DF: degrees of freedom; CV: coefficient of variation; MSr+/MSr: ratio between the greatest and smallest mean square of the residue in the individual analyses.
UHM positively correlated with FS and UNIF and negatively correlated with FM and b, indicating that this trait mainly affects the quality of the fibers. This information is important for cotton breeding programs aimed at selecting genotypes with longer fiber length, since an indirect selection will improve other important traits for fiber processing. Similar results were observed by Ulloa (2006), Hoogerheide et al. (2007), Araújo, Almeida, Bertini, Vidal Neto, and Bleicher (2012), Farias, Carvalho, Silva Filho, and Teodoro (2016 a and b) and Queiroz et al. (2017b), which verifies the importance of selecting cotton genotypes with higher UHM.
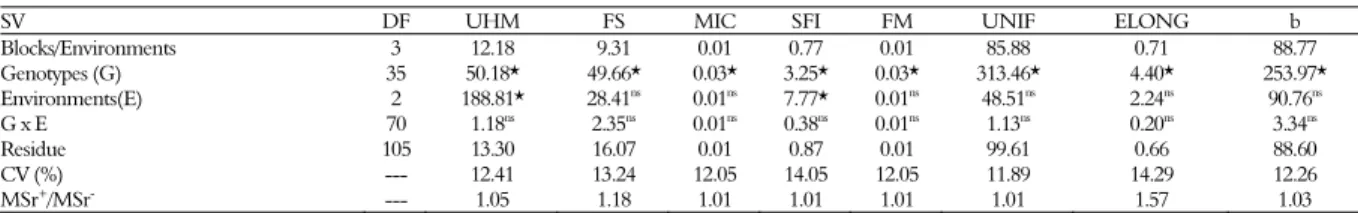
Table 2. Summary of the joint analysis of variance for the technological traits of fiber length (UHM), fiber strength (FS), micronaire (MIC), short fiber index (SFI), fiber maturity (FM), fiber uniformity (UNIF), elongation (ELONG,) and degree of yellowing (b) evaluated in 36 cotton genotypes cultivated in three environments in Brazil.
SV DF UHM FS MIC SFI FM UNIF ELONG b
Blocks/Environments 3 12.18 9.31 0.01 0.77 0.01 85.88 0.71 88.77 Genotypes (G) 35 50.18* 49.66* 0.03* 3.25* 0.03* 313.46* 4.40* 253.97* Environments(E) 2 188.81* 28.41ns 0.01ns 7.77* 0.01ns 48.51ns 2.24ns 90.76ns G x E 70 1.18ns 2.35ns 0.01ns 0.38ns 0.01ns 1.13ns 0.20ns 3.34ns Residue 105 13.30 16.07 0.01 0.87 0.01 99.61 0.66 88.60 CV (%) --- 12.41 13.24 12.05 14.05 12.05 11.89 14.29 12.26 MSr+/MSr- --- 1.05 1.18 1.01 1.01 1.01 1.01 1.57 1.03
Figure 1. Correlation between plant height (PH), mean boll weight (MBW), fiber percentage (FP), cotton boll yield (CBY), fiber length (UHM), fiber strength (FS), fiber maturity (FM), fiber uniformity (UNIF), elongation (ELONG), and degree of yellowing (b) evaluated in 36 cotton genotypes cultivated in three environments in Brazil. Positive correlations were highlighted in black lines, while negative correlations were represented in gray scale.
Canonical Correlations
The first two canonical correlations between the agronomic and technological trait groups were significant (p < 0.05) by the chi-square test (Table 3). The first canonical pair showed that genotypes with smaller size and higher MBW have higher values of UHM, FS, UNIF, and ELONG and are associated with lower values of SFI. The second canonical pair showed that more productive cotton genotypes with higher MBW correlate with higher values of UNIF and FS and lower values of SFI.
Currently, textile industries require high-quality fibers to increase processing speed (Carvalho et al., 2015a). In this sense, breeding programs aim at developing cotton genotypes
with high UHM, FS and UNIF and low SFI. However, the interrelations observed in the canonical correlations analysis do not translate the cause and effect between traits, which can be better understood by the path analysis.
Table 3. Canonical correlations and canonical pairs between agronomic traits (group I), plant height (PH), mean boll weight (MBW), fiber percentage (FP), and cotton boll yield (CBY); and technological traits (Group II) fiber length (UHM), fiber strength (FS), micronaire (MIC), short fiber index (SFI), fiber maturity (FM), fiber uniformity (UNIF), elongation (ELONG), and degree of yellowing (b) evaluated in 36 cotton genotypes cultivated in three environments in Brazil.
Trait 1st
2nd
3rd
4th Group I: agronomic traits
PH -0.7921 -0.1324 -0.5091 0.1678 MBW 0.8123 0.7845 0.0973 -0.0876 FP 0.2451 0.2461 0.2345 0.1234 CBY 0.0456 0.6456 0.3106 -0.1537
Group II: technological traits
UHM 0.6571 0.3898 0.1123 0.0456 FS 0.5478 0.6788 0.2456 -0.0897 MIC 0.0421 -0.1045 -0.0807 -0.2164 SFI -0.4356 -0.5645 -0.0015 0.1345 FM 0.0145 -0.0134 0.2456 -0.0561 UNIF 0.4789 0.7123 0.0981 0.1487 ELONG 0.3987 0.3461 -0.1643 0.1566 b -0.1798 0.0971 0.2121 0.1127 Correlation 0.95 0.89 0.45 0.40 p-value <0.00 0.01 0.67 0.81
Path analysis
The estimate for the coefficient of determination was large (R² = 0.9707), and the residual effect had a low magnitude (0.1712) (Table 4). The use of the path analysis to establish selection criteria in cotton is recent and restricted to the consideration of fiber yields as the main dependent variable (Hoogerheide et al., 2007; Farias et al., 2016a). These results indicate that practically all variation in UHM was explained by the auxiliary traits considered in the path analysis.
Table 4. Direct and indirect effects of plant height (PH), mean boll weight (MBW), fiber percentage (FP), cotton boll yield (CBY), fiber strength (FS), micronaire (MIC), short fiber index (SFI), fiber maturity (FM), fiber uniformity (UNIF), elongation (ELONG), and degree of yellowing (b) on fibers length (UHM) of 36 cotton genotypes cultivated in three environments in Brazil.
Effect PH MBW FP CBY FS MIC SFI FM UNIF ELONG b
Direct on UHM -0.5929 0.3354 -0.1213 0.1078 0.5730 -0.1373 -0.1629 -0.2300 0.5989 0.5753 0.4068 Indirect via PH --- -0.1839 0.0176 -0.0041 0.0213 0.0108 0.0106 0.0230 0.0239 0.0138 0.0007 Indirect via MBW 0.1011 --- -0.1158 -0.0772 -0.0772 -0.0588 0.1269 0.0680 -0.1030 0.0938 -0.0882 Indirect via FP 0.0885 -0.0764 --- -0.0351 -0.0266 0.0024 -0.0339 0.0169 0.0254 -0.0655 0.0849 Indirect via CBY 0.0622 0.1537 0.1061 --- 0.1061 0.1281 0.0878 0.0732 0.0658 0.0732 -0.0207 Indirect via FS -0.5043 0.1124 0.1260 0.1661 --- 0.2922 0.1891 -0.1833 0.5215 -0.5215 0.2464 Indirect via MIC 0.0618 -0.0439 0.0027 -0.0480 -0.0700 --- -0.0219 0.0618 -0.0219 0.0824 -0.0027 Indirect via SFI 0.0717 0.0133 -0.0456 -0.0391 -0.0538 -0.0260 --- 0.1271 0.1629 0.0228 -0.1124 Indirect via FM 0.2185 0.0851 0.0322 -0.0460 0.0736 0.1035 0.1794 --- 0.2277 0.0989 -0.0207 Indirect via UNIF -0.0242 0.2406 -0.1257 0.3660 0.5450 0.0958 -0.5989 -0.5929 --- -0.3174 -0.5689 Indirect via ELONG -0.3279 -0.2934 0.3106 0.1150 -0.5235 -0.3451 -0.0805 -0.2473 -0.3049 --- -0.2876 Indirect via b 0.0122 0.0851 -0.2848 -0.2319 0.1749 0.0081 0.2807 0.0366 -0.3865 -0.2034 --- Total (rF) -0.8577 0.4280 -0.0980 0.2735 0.7428 0.0737 -0.0236-0.8469 0.8098 -0.1476 -0.3624 Coefficient of determination (R²) = 0.9707
Page 6 of 7 Teodoro et al.
,
Among the agronomic traits that were considered auxiliary in the path analysis, PH and MBW stood out for presenting the highest estimates of direct effects on UHM. PH had a negative correlation with the negative high direct effect, while MBW had a correlation effect and positive direct effect of relatively low magnitude on UHM.
Among the technological traits considered that were auxiliary traits in the path analysis, FS and UNIF stood out with the highest estimates of direct effects. These traits also had high positive correlations with UHM, which indicate a cause and effect relationship between the traits. These results indicate that FS and UNIF can be used in the indirect selection of cotton genotypes with higher UHM.
ELONG showed a high positive effect on UHM; however, the correlation between these traits had a low magnitude on the reverse order. A similar result in the opposite direction was observed for FM, which obtained a direct moderate magnitude effect despite presenting a high negative correlation with UHM. These results can be explained by the negative indirect effect via FS and UNIF.
The future of cotton breeding programs
In plant breeding, the identification of traits with the highest direct effect that are favorable for selection is crucial so that correlated responses by means of indirect selection are efficient (Cruz et al., 2012). The identification of agronomic traits that can be used in the indirect selection is desirable due to easy measurements and lower costs. However, the establishment of selection indices involving agronomic traits PH, MBW, and CBY and technological traits UNIF and FS may be the most promising strategy for the selection of cotton genotypes with high cotton boll yield and long fibers.
The results obtained by canonical correlations between groups of traits indicated that no genotype had the primary desirable traits for a producer (short size and high cotton boll yield) or for the textile industry (long fibers). Thus, an alternative that brings together these desirable phenotypes would be the recombination of promising individuals selected based on the selection index. This strategy is supposed to favor the occurrence of transgressive segregants in the population as a result of recombination.
Conclusion
It is possible to improve the main technological traits of upland cotton from the indirect selection of agronomic traits.
The selection of cotton genotypes that have a smaller size and higher average weight of bolls can be used as a strategy to increase fiber lengths and improve other technological traits.
Acknowledgements
We are thankful to CAPES (Coordenação de Aperfeicoamento de Pessoal do Ensino Superior), Cnpq (National Counsel of Technological and Scientific Development), FAPEMIG (Fundação de Amparo a Pesquisa de Minas Gerais), Funarbe (Fundação Arthur Bernardes) and Federal University of Viçosa for financial support. We also thank the Biometric Lab (Federal University of Viçosa, Brazil) where all analyses were performed by remote access.
References
Araújo, L. F., Almeida, W. S., Bertini, C. H. C. M., Vidal Neto, F. C., & Bleicher, E. (2012). Correlations and path analysis in components of fiber yield in cultivars of upland cotton. Bragantia, 71(3), 328-335. doi: 10.1590/S0006-87052012005000036
Araújo, W. P., Pereira, J. R., Almeida, E. S. A. B., Araújo, V. L., Lima, F. V., & Sobrinho, F. P. C. (2013). Componentes da fibra de cultivares de algodoeiro herbáceo sob lâminas de água. Revista Educação Agrícola
Superior, 28(1), 78-81.
Carvalho, L. P., Baroso, P. A. V., Santos, J. A. T., & Alves, H. S. (2005). Seleção massal e porcentagem de fibra em cultivar de algodoeiro colorido. Pesquisa
Agropecuária Brasileira, 40(9), 895-898. doi:
10.1590/S0100-204X2005000900009
Carvalho.L. P., Farias, F. J. C., & Rodrigues, J. I. S. (2015a). Selection for increased fiber length in cotton progenies from Acala and Non-Acala types. Crop
Science, 55(1), 1-7. doi: 10.2135/cropsci2014.08.0547
Carvalho, L. P., Farias, F. J. C., Morello, C. L., Rodrigues, J. I. S., & Teodoro, P. E. (2015b). Agronomic and technical fibers traits in elite genotypes of cotton herbaceous. African Journal of Agricultural Research,
10(53), 4882-4887. doi: 10.5897/AJAR2015.10515 Carvalho, L. P., Farias, F. J. C., Morello, C. L., &
Teodoro, P. E. (2016a). Selection of cotton genotypes for greater length of fibers. Crop Breeding and Applied
Biotechnology, 16(4), 340-347. doi:
10.1590/1984-70332016v16n4n50
Carvalho, L. P., Farias, F. J. C., Morello, C. L., & Teodoro, P. E. (2016b). Uso da metodologia REML/BLUP para seleção de genótipos de algodoeiro com maior adaptabilidade e estabilidade produtiva.
Bragantia, 75(3), 314-321. doi: 10.1590/1678-4499.275
Companhia Nacional de Abastecimento [CONAB]. (2017).
Acompanhamento de safra brasileira: grãos, safra 2016/2017, 11º
arquivos/17_08_10_09_00_19_boletim_graos_agosto_201 7-pdf
Corrar, L. J., Paulo, E., & Dias Filho, J. M. (2007). Análise
multivariada. São Paulo, SP: Atlas.
Cruz, C. D. (2013). GENES - a software package for analysis in experimental statistics and quantitative genetics. Acta Scientiarum. Agronomy, 35(3), 271-276. doi: 10.4025/actasciagron.v35i3.21251
Cruz C. D., Carneiro P. C. S., & Regazzi, A. J. (2012).
Modelos biométricos aplicados ao melhoramento genético.
Viçosa, MG: UFV.
Dileo, M. V., Strahan, G. D., Bakker, M. den, & Hoekenga, O. A. (2011). Weighted correlation network analysis (WGCNA) applied to the tomato fruit metabolome. PLoS ONE, 6(10), 1-12. doi: 10.1371/journal.pone.0026683
Farias, F. J. C., Carvalho, L. P., Silva Filho, J. L., & Teodoro, P. E. (2016a). Correlations and path analysis among agronomic and technological traits of upland cotton. Genetics and Molecular Research, 15(3), 1-8. doi: 10.4238/gmr.15038239
Farias, F. J. C., Carvalho, L. P., Silva Filho, J. L., & Teodoro, P. E. (2016b). Usefulness of the HMRPGV method for simultaneous selection of upland cotton genotypes with greater fiber length and high yield stability. Genetics and Molecular Research, 15(3), 1-9. doi: 10.4238/gmr.15038439
Freitas, R. J., Leandro, W. M., & Carvalho, M. C. S. (2007). Efeito da adubação potássica via solo e foliar sobre a produção e a qualidade da fibra em algodoeiro
(Gossypium hirsutum L.). Pesquisa Agropecuária Tropical,
37(2), 106-112.
Hoogerheide, E. S. S., Vencovsky, R., Farias, F. J. C., Freire, E. C., & Arantes, E. M. (2007). Correlações e análise de trilha de caracteres tecnológicos e produtividade de fibra de algodão. Pesquisa Agropecuaria
Brasileira, 42(10), 1401-1405.
Jerônimo, J. F., Almeida, F. A. C., Silva, O. R. F. F., Brandão, Z. N., Sofiatti, V., & Gomes, J. P. (2014). Qualidade da semente e fibra de algodão na caracterização do descaroçador de 25 serras. Revista
Brasileira de Engenharia Agrícola e Ambiental, 18(6), 664–
671.
Montgomery, D. C., & Peck, E. A. (2001). E. A.
Introduction to linear regression analysis (3rd ed.). New
York, US: John Wiley & Sons.
Ng, E. H, Smith, C. W., Hequet, E., Hague, S., & Dever, J. (2015). Generation mean analysis for fiber elongation in upland cotton. Crop Science, 54(4), 1347-1353. doi: 10.2135/cropsci2013.07.0490
Pimentel-Gomes, F. (2009). Curso de Estatística
Experimental (15a ed.). São Paulo, SP: Fealq.
Queiroz, D. R., Farias, F. J. C., Cavalcanti, J. J. V., Carvalho, L. P., Neder, D. G., Souza, L. S. S., ..., Teodoro, P. E. (2017a). Diallel analysis for agronomic traits in upland cotton in semi-arid zones in Brazil.
Genetics and Molecular Research, 16(3), 1-8. doi:
10.4238/gmr16039677
Queiroz, D. R., Farias, F. J. C., Cavalcanti, J. J. V., Carvalho, L. P., Neder, D. G., Souza, L. S. S., ..., Teodoro, P. E. (2017b). Diallel analysis for technological traits in upland cotton. Genetics and
Molecular Research, 16(3), 1-8. doi:
10.4238/gmr16039727
Santos, I. G., Teodoro, P. E., Farias, F. C., Farias, J. F. C., Carvalho, L. P., Rodrigues, J. I. S., & Cruz, C. D. (2017). Genetic diversity among cotton cultivars in two environments in the State of Mato Grosso.
Genetics and Molecular Research, 16(2), 1-8. doi:
10.4238/gmr16029628
Silva, A. R., Rêgo, E. R., Pessoa, A. M. S., & Rêgo, M. M. (2016). Correlation network analysis between phenotypic and genotypic traits of chili pepper.
Pesquisa Agropecuária Brasileira, 51(4), 372-377. doi:
10.1590/S0100-204X2016000400010
Silva, R. P., Ferreira, I. C., & Cassia, M. T. (2011). Perdas na colheita mecanizada de algodão. Scientia
Agropecuaria, 2(1), 07-12.
Smith, C. W., Hague, S., Hequet, E., Thaxton, S., & Brown, N. (2008). Development of extra-long staple upland cotton. Crop Science, 48(5), 1823-1832. doi: 10.2135/cropsci2012.01.0020
Ulloa, M. (2006). Heritability and correlations of agronomic and fiber traits in an okra-leaf upland cotton population. Crop Science, 46(4), 1508-1514. doi: 10.2135/cropsci2005.08-0271
Ursem, R., Tikunov, Y., Bovy, A., Berloo, R. van, & Eeuwijk, F. van. (2008). A correlation network approach to metabolic data analysis for tomato fruits.
Euphytica, 161(1-2), 181-193. doi:
10.1007/s10681-008-9672-y
Wright, S. (1921). Correlation and causation. Journal of
Agricultural Research, 20(7), 557-585.
Received on September7, 2017. Accepted on November 12, 2017.