Jacqueline B. Copetti
[email protected] Universidade do Vale do Rio dos Sinos – UNISINOS Av. Unisinos, 950, São Leopoldo, RS, BrazilMario H. Macagnan
[email protected] Universidade do Vale do Rio dos Sinos – UNISINOS Av. Unisinos, 950, São Leopoldo, RS, BrazilNicole Kunsler
[email protected] Universidade do Vale do Rio dos Sinos – UNISINOS Av. Unisinos, 950, São Leopoldo, RS, BrazilBoiling of R-134a in Horizontal Mini
Tube
This work presents the results of an experimental study carried out with R-134a to characterize heat transfer and pressure drop during flow boiling in a horizontal smooth tube of 2.6 mm ID. The experimental tests included (i) heat fluxes in the range from 10 to 100 kW/m2, (ii) the refrigerant mass velocities set to discrete values in the range of 240-930 kg/m2sand (iii) saturation temperatures of 12 and 22°C. The study analyzed the heat transfer through the local heat transfer coefficient along the flow and pressure drop, under the variation of these different parameters. It was possible to observe the significant influence of heat flux on the heat transfer coefficient and mass velocity on the pressure drop, and the effects of saturation temperature. Moreover, it was possible to produce a complete database.
Keywords: flow boiling, mini tube, heat transfer coefficients, pressure drop, R-134a
Introduction
Flow boiling studies in mini and micro channels have been published mainly in the last decade. This trend is the result of the current great interest in compact refrigeration systems and cooling electronic devices.
Although there is an increment in the heat transfer due to reduction in channel size, as reported by some authors, the results exhibit discrepancies concerning the effect of heat flux, mass velocity and saturation temperature on the heat transfer coefficient and the characteristics of flow boiling in channels are not completely understood yet (Consolini, 2008; Vlasie et al., 2004). Therefore, the ability to predict heat transfer under these conditions through the correlations is limited.
According to the review of Ong and Thome (2009), the boiling heat transfer mechanisms in mini and micro channels could be controlled by nucleate boiling due to nearly exclusively dependence on heat flux (Tran et al., 1996; Lazarek and Black, 1982), or by convective boiling with the dependence of mass flux and vapor quality (Qu and Mudawar, 2003) or by both depending on vapor quality range (Yan and Lin, 1998). Tran et al. (1996) studied boiling of R-12 in a 2.46 mm circular tube and observed a heat transfer dependence on heat flux, but the effects of mass flux and vapor quality were negligible. The same tendency was reported by Lazarek and Black (1982) and Wambsganss (1993) with R-113 boiling in similar dimension tubes (3.1 mm and 2.92 mm, respectively). However, the results shown by Yan and Lin (1998), Lin et al. (2001) and Choi et al. (2007) demonstrated the effects of mass velocity and vapor quality. The results of Lin et al. (2001) with R-141b in 1.3 to 3.69 mm channels were different and significant variations in heat transfer coefficients with heat flux and vapor quality were observed, and also the influence of mass flux was verified decreasing the channel diameter. Some researches found that the heat transfer coefficient increases with the increase in vapor quality until a point when the coefficient decreases gradually and this behavior depends on the heat flux value, but the inflection point varies. Saitoh et al. (2005) carried out experiments with R-134a in 0.5 to 3.1 mm channels and for the larger diameter a clear dependence of heat flux and mass flux was found; however, for the narrower channel there was a dependence on heat flux only. Shiferaw et al. (2007) also studied R-134a and channel diameters from 2.01 mm to 4.26 mm and found similar results. This behavior allows relating the channel
which is characteristic of macro channels. Some effects, like the dryout, could happen earlier in micro channels as a result of confinement and the increasing relevance of surface tension, thus increasing the nucleate boiling contribution. Kew and Cornwell (1997) used this confinement concept and proposed a confinement number which allows classifying macro and microchannel flows and diameters.
In this paper, experimental data are presented for R-134a flow boiling, heat transfer and pressure drop in a horizontal stainless steel mini channel of 2.6 mm ID. Results are discussed in terms of heat flux, mass velocity, vapor quality and saturation temperature effects.
Nomenclature
h = heat transfer coefficient, W/m2K q” = heat flux, kW/m2
hlv = heat vaporization, kJ/kg G = mass velocity, kg/m2s dp/dz = pressure drop, kPa/m r = radio, m
T = temperature,°C
k = thermal conductivity, W/mK X = vapor quality, dimensionless
q = volumetric heat generated, W/m3 Tw = wall temperature,°C
Greek Symbols
= density, kg/m3
= surface tension, N/m
= viscosity, Pa.s
Subscripts
z = axial location along the test tube l = relative to liquid
sat = relative to saturation i = relative to the internal radio o = relative to the external radio
Experimental Aspects
Facility and instrumentation
A test rig was constructed to investigate flow boiling and pressure drop in electrically heated horizontal mini channels. The details of this rig are shown schematically in Fig. 1. The rig consists of two loops to provide controlled flow of refrigerant. The main loop has a Coriolis mass flow meter, a pre-heater section, the test section and the visualization section. The secondary loop consists of a condenser, a refrigerant reservoir, a dryer filter, a volumetric pump and a subcooler. The condenser and the subcooler have independent circuits, using an ethylene-glycol/water solution as secondary refrigerant. Each circuit is controlled by a thermal bath with constant temperature. This setup permits to control the refrigerant saturation temperature.
In the main loop of the circuit the preheater permits to establish the experimental conditions in the test section. It consists of a horizontal copper tube with length of 445 mm heated by an electrical tape resistance (11.7 m-1) uniformly wrapped around its external surface to guarantee a uniform heat flux to the refrigerant.
The electrical resistance is insulated from the tube with a kapton conductive tape. In the pre-heater the power is adjusted by a voltage converter. The test section consists of a smooth horizontal stainless steel tube with effective length of 183 mm and 2.6 mm ID and is uniformly heated by direct application of electrical current to the tube wall (Joule effect), controlled by a power supply. Downstream of the test section there is a visualization section with a 158 mm
length glass tube with the same test section inner diameter. The pre-heater and test section are thermally insulated.
The refrigerant enters in the preheating section as subcooled liquid and the saturation condition at the exit of the preheater, or the vapor quality, varies according to the heat flux. A sight glass before the preheater entrance makes it possible to monitor the thermodynamic state of refrigerant. The liquid reservoir is used for improving the stabilization of the refrigerant flow. The pressure measurements at the inlet and outlet of the preheater were carried out by two absolute transducers and the temperatures by 0.076 mm thermocouples type E, in direct contact with the refrigerant flow.
The refrigerant vaporizes along the test section. Refrigerant temperatures are measured at the inlet and outlet of this section as well as the tube wall temperatures. The tube wall thermocouples are 0.076 mm type E directly fixed by a thermally conductive paste. The position of each thermocouple is also shown in Fig. 1. In the three central positions of tube there are four thermocouples in each position, separated by 90 from each other. At the entrance and exit of the tube two thermocouples are fixed on the wall, in the upper and bottom parts. In the test section the differential pressure transducer allows the determination of the exit pressure.
The flow pump rate is controlled by a frequency inverter and a bypass pipe line after the pump allows for a more precise flow rate setting through a needle-valve.
The pressure transducers, thermocouples, mass flow and power meter were connected to an acquisition data system consisting of a multimeter (Agilent, model 34970A) connected to a microcomputer by a RS232 interface. Software BenchLink Data Logger from Agilent was used for data monitoring and acquisition.
Figure 1. Schematic view of the experimental facility.
top
bottom
side inner side-outer
P
T
P T
P T
Dryer filter Pump
Coriolis flow meter
Refrigerant reservoir
Condenser Subcooler
By pass valve
Visualization section
Test section Preheater
Digital camera T
T T T T
T
wall temperatures
top
bottom
side inner side-outer top
bottom
side inner side-outer
P
T
P T
P T
Dryer filter Pump
Coriolis flow meter
Refrigerant reservoir
Condenser Subcooler
By pass valve
Visualization section
Test section Preheater
Digital camera T
T T T T
T
Measurements procedures and data reduction
Single phase
Firstly, single phase tests were performed with R-134a to evaluate heat losses in the preheater and test section. The losses depend on mass velocity and heat power. The values of losses increase with decreasing mass velocity and increasing heat power. In the preheater the maximum loss was about 15% and in the test section 5%; these differences are probably due to different heating systems and tubes in both sections. These losses were considered in the boiling results.
Boiling experimental conditions
Boiling tests of R-134a in a 2.6 mm ID tube were carried out with the aim of verifying the thermal and hydraulic flow behavior for different refrigerant flow rates and heat flux. Experimental test conditions are shown in Table 1. The vapor quality condition at the entrance of the test section for each test was reached by different heating powers in the preheater.
Table 1. Test conditions.
Test section heat flux, q” 10, 20, 33, 47, 67, 87 and 100 kW/m2
Mass velocity, G 240, 440, 556, 740 and 930 kg/sm²
Saturation temperature, Tsat 12 and 22°C
Preheater heating power 45 to 270 W
Data reduction
The vaporization parameters, including vapor quality, inner wall temperature, saturation temperature and the heat transfer coefficient, were calculated from measured data of refrigerant temperatures, wall temperature in the test section, pressures, flow rate, heat flux and geometrical parameters. The thermodynamic properties of R-134a were obtained from REFPROPsoftware (Lemmon et al., 2007).
The heat transfer coefficient calculation assumed the following considerations:
- Heat transfer in the axial direction can be neglected. - Volumetric heat generation, and hence heat flux is uniform
along the tube in the test section.
- Pressure drop from the saturation point to outlet pressure is a linear function of tube length. This hypothesis is used by several authors, e.g. Shiferaw et al. (2009), and it was experimentally verified for adiabatic flow conditions by Tibiriçá and Ribatski (2010). Moreover, the current experimental data of temperature and pressure at the inlet and outlet of test section show that the variations are small, which indicates that the adoption of this hypothesis does not lead to significant differences in saturation temperature. The vapor quality at the entrance of the test section was calculated from an energy balance in the pre-heater and the enthalpies were estimated through pressure and temperature measurements downstream and upstream of the section. The exit enthalpy in the test section was estimated using the same procedure for the pre-heating section.
The local heat transfer coefficient, hz, was determined using Eq. (1):
z sat i w z T T q h
(1)
where
q
is the heat flux,i w
T
is the inner wall temperature andz sat
T
is the saturation temperature at the local refrigerant pressurecalculated by interpolation between the inlet and outlet pressures. The heat flux is calculated as the ratio between the electrical power and the internal area for the heated length. The
i w
T
was calculatedassuming radial conduction through the wall, subject to internal heat generation as given by Eq. (2):
i o 2 o 2 i 2 o o w i w r r ln r k 2 q r r k 4 q TT (2)
whereqis the volumetric heat generated,
T
wo is the external wall temperature, k is thermal conductivity, and ro and ri the external andinternal radios, respectively. For each axial location z along the test tube, the external wall temperature is the average of measured temperatures around the cross section and calculated by Eq. (3):
4
T T
T T
Two wtop wside,i wside,o wbottom
(3)
where
top w
T is the top temperature,
i , side w
T is the inner temperature,
o , side w
T
is the outer temperature andT
wbottom the bottomtemperature.
Results and Discussion
Heat transfer
Effect of heat flux
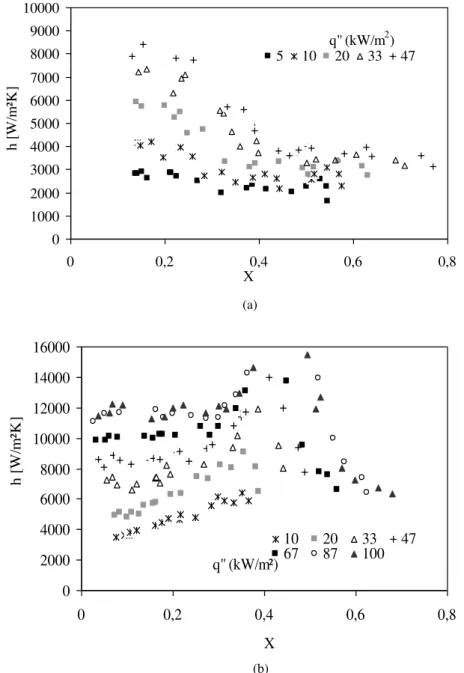
Figures 2(a) and 2(b) show the effect of heat flux on the heat transfer coefficient for different mass velocities. It is possible to verify the dependence of the heat transfer coefficients on the heat flux, mainly at the low quality region (quality less than 40%). The heat transfer coefficient increased with the heat flux increment. As previously pointed, several authors (Choi et al., 2007, and Lin et al., 2001) have associated this behavior with nucleate boiling in the initial part of boiling, mainly under high heat flux. This condition will tend to be suppressed at high vapor quality where the effect of heat flux on heat transfer coefficient becomes lower and the coefficient decreases, as can be observed in Figs. 2(a) and 2(b). Figure 2(a) also shows that for low mass velocity (G = 240 kg/sm2)
and low heat flux (
q
= 5 kW/m2), the heat transfer coefficient hardlyshows any variations with quality.
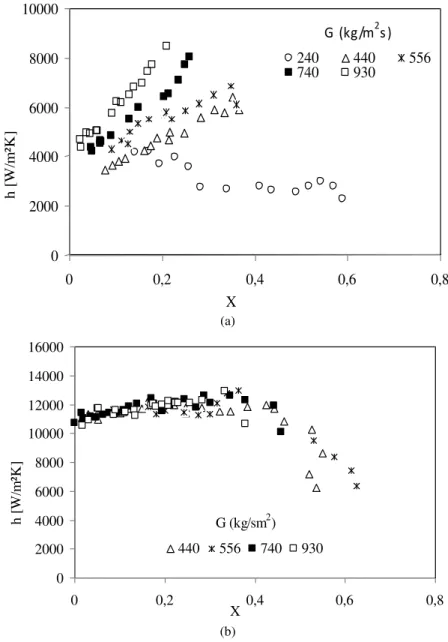
Effect of mass velocity
The effect of mass velocity on the heat transfer coefficient is shown in Figs. 3(a) and 3(b), for heat fluxes of 10 kW/m2 and 87 kW/m2,
q" (kW/m2)
0 1000 2000 3000 4000 5000 6000 7000 8000 9000 10000
0 0,2 0,4 0,6 0,8
X
h [
W
/m
²K
]
5 10 20 33 47
q" (kW/m²)
0
2000
4000
6000
8000
10000
12000
14000
16000
0
0,2
0,4
0,6
0,8
X
h [
W
/m
²K
]
10
20
33
47
67
87
100
(a)
(b)
Figure 2. Effect of heat flux on heat transfer coefficient for different mass velocities: a) G = 240 kg/m2s, b) G = 440 kg/m2s for Tsat = 22°C.
Effect of saturation temperature
Figure 4 illustrates the effect of saturation temperature on the heat transfer coefficient for G = 440 kg/sm2 and
q
= 10 kW/m2. Two temperatures were tested, 12C and 22C. The heat transfer coefficient increases with increasing saturation temperature, or pressure. According to Sharma et al. (in Shiferaw et al., 2009) this effect could be due to the fact that bubble departure diameterdecreases, but frequency increases as the system pressure increases. Then the bubble growth and departure from the tube wall is faster at high pressure values for the same heat flux. Therefore the disturbance caused by bubbles growing and escaping from the wall contributes significantly to the heat transfer rate. Also, the effect of pressure on properties, like density and heat of vaporization (see Table 2), may be important.
Table 2. Physical properties of R-134a at different temperatures.
T
C
p kPa
l
kg/m3
v
kg/m3 l/v
l
10-6 Pa.s
v
10-6 Pa.s l/v
10-3 N/m
hlv
kJ/kg
22 607.9 1218 29.54 41.23 202.28 11.57 17.48 8.48 180.51
G (kg/m
2s )
0
2000
4000
6000
8000
10000
0
0,2
0,4
0,6
0,8
X
h [
W
/m
²K
]
240
440
556
740
930
(a)
G (kg/sm2)
0 2000 4000 6000 8000 10000 12000 14000 16000
0 0,2 0,4 0,6 0,8
X
h [
W
/m
²K
]
440 556 740 930
(b)
Figure 3. Effect of mass velocity on heat transfer coefficient for different heat flux: a)
q
= 10 kW/m2, b)q
= 87 kW/m2 for Tsat= 22°C.
0 2000 4000 6000 8000 10000
0 0.2 0.4 0.6 0.8
X
h [
W
/m
²K
]
12 °C 22 °C
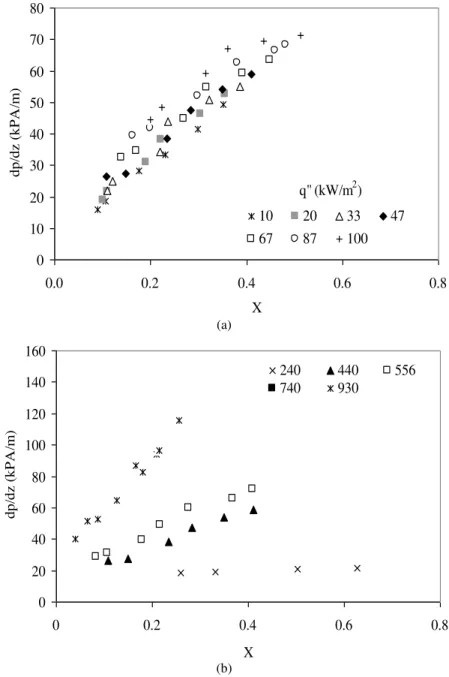
Pressure drop
The pressure drop measured in the test section as function of vapor quality for different mass velocities and heat fluxes is shown in Figs. 5(a) and 5(b). The stainless steel tube has an internal absolute roughness coefficient of 2.05 μm, measured with a Pantec roughness tester.
As can be seen in both figures, the pressure drop increases with the vapor quality regardless other parameters. The pressure drop increases with increasing heat flux for the same mass velocity, as shown in Fig. 5(a). With decreasing mass velocity, the pressure tends to remain almost constant, as presented in Fig.
5(b), for G = 240 kg/m2s. Similar trends were presented by Ould Didi et al. (2002) for refrigerants flow in macro tubes of 10.92 to 12 mm and by Tran et al. (1999), for small channels.
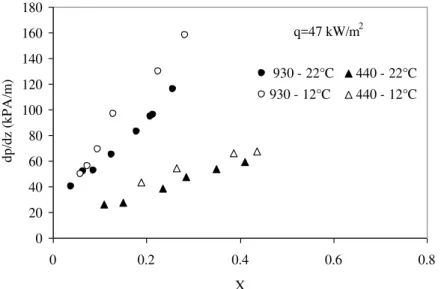
Figure 6 illustrates the effect of saturation temperature in pressure drop. A lower saturation temperature results in a higher pressure drop for both tested values of mass velocities. This result can be explained by the effect of the physical properties on the pressure drop, as shown in Table 2. The refrigerant at lower temperature and pressure has a higher density ratio, viscosity ratio and surface tension, which contribute to higher loss of pressure.
q" (kW/m
2)
0
10
20
30
40
50
60
70
80
0.0
0.2
0.4
0.6
0.8
X
dp/
dz
(
kP
A
/m
)
10
20
33
47
67
87
100
(a)
0
20
40
60
80
100
120
140
160
0
0.2
0.4
0.6
0.8
X
dp/
dz
(
kP
A
/m
)
240
440
556
740
930
(b)
q=47 kW/m2
0 20 40 60 80 100 120 140 160 180
0 0.2 0.4 0.6 0.8
X
dp/
dz
(
kP
A
/m
) 930 - 22°C 440 - 22°C
930 - 12°C 440 - 12°C
Figure 6. Pressure drop with different saturation temperatures for G = 930 and 440 kg/m2s.
Conclusions
Preliminary results of an experimental two-phase flow of R-134a in a horizontal mini channel are presented. It was observed the dependence of the heat transfer coefficient on heat flux and mass velocity. The heat transfer coefficient increased with increasing heat flux and mass velocity, but strong heat flux dependence was observed, mainly in the lower vapor quality region.
Comparing the results and observations made by different researches regarding boiling mechanisms in small diameter channels, many uncertainties and contradictions still exist. However, the results indicated that the nucleate boiling mechanism seems to be dominant in view of the heat flux effect.
In the pressure drop results it was possible to verify that the effects of heat flux, mass velocity and saturation temperature are also important; however, it should be further investigated due to its influence in evaporators design.
Acknowledgements
The authors gratefully acknowledge CNPq, Conselho Nacional de Desenvolvimento Científico e Tecnológico for the financial support for this work under contract 476843/2006-5. Kunsler, N.L.F. was supported by a grant from Fundação de Amparo a Pesquisa do Rio Grande do Sul (FAPERGS).
References
Choi, K., Pamitran, A.S., Oh, C.Y., Oh, J.T., 2007, “Boiling heat transfer of R-22, R-134a and CO2 in horizontal smooth minichannels”,
International Journal of Refrigeration, Vol. 30, pp. 1336-1346.
Consolini, L., 2008, “Convective boiling heat transfer in a single microchannel”, Ph.D. Thesis, Ecole Polytechnique Federale de Lausanne, Thesis n. 4024.
Kew, P., Cornwell, K., 1997, “Correlations for prediction of boiling heat transfer in small diameter channels”, Applied Thermal Engineering, Vol. 17, pp. 705-715.
Lazarek, G.M., Black, S.H., 1982, “Evaporative heat transfer,
pressure drop and critical heat flux in a small vertical tube with R113”,
International Journal of Heat and Mass Transfer, Vol. 25, pp. 945-960.
Lemmon, E.W., Huber, M.L., McLinden, M.O., 2007, NIST Standard Reference Database 23: Reference Fluid Thermodynamic and Transport Properties-REFPROP, Version 8.0, National Institute of
Standards and Technology, Standard Reference Data Program, Gaithersburg.
Lin, S., Kew, P.A., Cornwell, K., 2001, “Two-phase heat transfer to a refrigerant in a 1 mm diameter tube”, International Journal of
Refrigeration, Vol. 24, pp. 51-56.
Ong, C.L., Thome, J.R., 2009, “Flow boiling transfer of R134a,
R236fa and R245fa in a horizontal 1.030 mm circular channel”,
Experimental Thermal Sciences, Vol. 33, pp. 651-663.
Qu, W., Mudawar,I., 2003, “Flow boiling heat transfer in two-phase micro-channel heat sinks I: experimental investigation and assessment of
correlation methods”, International Journal of Heat and Mass Transfer, Vol. 46, pp. 2755-2771.
Ould Didi, M.B., Kattan, N., Thome, J.R., 2002, “Prediction of two
-phase pressure gradients of refrigerants in horizontal tubes”, International
Journal of Refrigeration, Vol. 25, pp. 935-947.
Saitoh, S., Daiguji, S.H., Hihara, E., 2005, “Effect of tube diameter on boiling heat transfer of R134a in horizontal small-diameter tubes”,
International Journal of Heat and Mass Transfer, Vol. 48, pp. 4973-4984.
Shiferaw, D., Huo, X., Karayiannis, T.G., Kenning, D.B.R., 2007,
“Examination of heat transfer correlations and a model for flow boiling of
R134a in small diameter tubes”, International Journal of Heat and Mass
Transfer, Vol. 50, pp. 5177-5193.
Shiferaw, D., Karayiannis, T.G., Kenning, D.B.R., 2009, “Flow boiling in a 1.1 mm tube with R134a: Experimental results and comparison with model”, International Journal of Thermal Sciences, Vol. 48, pp. 331-341.
Tran, T.N., Wambsganss, M.W., France, D.M., 1996, “Small circular and rectangular channel boiling with two refrigerants”, International
Journal of Multiphase Flow, Vol. 22, pp. 485-498.
Tran, T.N., Chyu, M.C., Wambsganss, M.W., France, D.M., 1999,
“Two-phase pressure drop of refrigerants during flow boiling in small
channels: an experimental investigation and correlation development”,
Proceedings of the International Conference on Compact Heat Exchangers and Enhancement Technology for the Process Industries, Banff, Canada.
Tibiriçá, C.B., Ribatski, G., 2010, “Flow boiling heat transfer of R134a and R245fa in a 2.3 mm tube”. International Journal of Heat and
Mass Transfer, Vol. 53, pp. 2459-2468.
Vlasie, C., Macchi, H., Guipart, J., Agostini, B., 2004, “Flow boiling in
small diameter channels”, International Journal of Refrigeration, Vol. 27, pp. 191-201.
Wambsganss, M.W., France, D.M., Jendrezczyk, J.A., Tran, T.M.,
1993, “Boiling heat transfer in a horizontal small diameter tube”, Journal
of Heat Transfer, Vol. 115, pp. 963-972.
Yan, Y.Y., Lin, T.F., 1998, “Evaporation heat transfer and pressure
drop of refrigerant R134a in a small pipe”, International Journal of Heat