Gaianê Sabundjian
Delvonei A. de Andrade
Pedro E. Umbehaun
Walmir M. Torres
Luiz A. Macedo
Thadeu N. Conti
Roberto N. de Mesquita
Gabriel Angelo
[email protected] Instituto de Pesquisas Energéticas e Nucleares IPEN / CNEN – SP Centro de Engenharia Nuclear 05508-000 São Paulo, SP, BrazilComparison Between Experimental
Data and Numerical Modeling for the
Natural Circulation Phenomenon
The study of natural circulation phenomenon has been object of crescent interest in scientific community in recent years. The new generation of compact nuclear reactors uses natural circulation of the fluid as a residual heat removal cooling system in case of accident or shutdown. The objective of this paper is to present a comparison between experimental data and numerical simulation results for the natural circulation phenomenon in single and two-phase flow regime. Experimental data were obtained from a circuit built with glass tubes, through which thermal hydraulic phenomenon visualization was possible. The circuit is composed of an electric heater as the heat source, a heat exchanger as the heat sink and an expansion tank to accommodate fluid density changes. Instrumentation data acquisition is performed through thermocouples and pressure meters, and controlled by a computer interface developed using LABVIEW. Numerical modeling and simulations were done with the thermal hydraulic code RELAP5, which is widely used for this purpose. The cyclic reverse flow observed in the circuit was well represented by the numerical model. The comparison demonstrated that the numerical simulations are very close to the experimental data.
Keywords: Natural Circulation, RELAP5, two-phase flow
Introduction
Natural circulation phenomenon is very important for the safety and design of nuclear reactors. Advanced reactors have been designed using passive safety systems based on natural circulation (Braaten et al., 1987). There are also some conceptual designs using the natural circulation where the components and systems have been simplified by eliminating pumped recirculation systems and pumped emergency core cooling systems (Jaluria et al., 1986).
A theoretical and experimental research project is under development at Instituto de Pesquisas Energéticas e Nucleares (IPEN-CNEN/SP). The objective is to understand the complex phenomena involving the instabilities in single and two-phase flow in a natural circulation circuit.
This study started at Departamento de Engenharia Química da Escola Politécnica (USP). Experiments concerning single and two-phase flow in natural circulation regime were performed by this team (Tema Especial XI ENFIR 1997, Sabundjian et al. 2005, Sabundjian et al. 2006, and Sabundjian et al. 2008). Other experiments were carried out by different authors as found in the literature (Kaliatka et al. 2010, Azzoune et al. 2010 and Omar et al. 2010).
The goal of this work is to present a comparison between numerical simulation and experimental data for single and two-phase flow in natural circulation regime.
Experiments are performed for single and two-phase flow and RELAP5 code (RELAP5 code, 1999) is used to simulate this circuit. Theoretical results from RELAP5 are compared to the experimental ones in order to validate the RELAP5 models.
Nomenclature
A = cross area, m2 F = friction coefficient, N.m g = gravity, m/s2
h = enthalpy, J/kg
p = pressure, Pa
q” = heat flux, W/m2
Q = heat transfer between the phases, W/m3 t = time, s
u = internal energy, J/kg v = velocity, m/s m = flow rate, kg/s
Greek Symbols
= void fraction, %
= density, kg/m3
Г = mass transfer, kg/m3 s
Subscripts
g = gaseous phase k = relative phase l = liquid phase
Experimental Circuit Description
The experimental circuit consists of a rectangular glass loop with an electric heater as the heat source and a coil cooler as the heat sink. Glass is used in the circuit to allow the flow visualization in order to identify the flow patterns. The main dimensions of the circuit as well as the thermocouple positions are indicated in Fig. 1. Figure 2 is a photo of the circuit.
Figure 1. Natural Circulation Circuit diagram.
Figure 2. Natural Circulation Circuit photo.
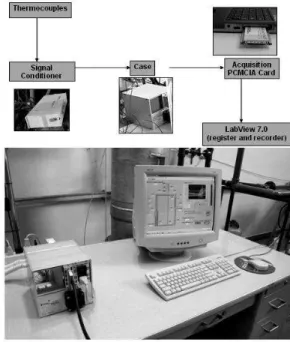
The heating power is imposed through an alternate voltage controller, variac. At the circuit, temperature is measured in 15 points, three on the tubes surface and the others inside the tubes, Fig. 1. Type K thermocouples are used and a pressure meter is positioned at the heating section top. Signal conditioning and a data acquisition board hosted in a PC completes the data acquisition system.
Heaters are installed inside a glass tube with 76.2 mm diameter, 880 mm high and 8 mm thick, Fig. 1. There are two heaters of
4200 W each. The power of the first one is fixed and, for the second, a variac controls the heater power from 0 to 4200 W.
Coil cooler is composed of two concentric spirals, primary water circuit flows inside the shell and refrigeration water inside the spirals.
Expansion tank is also glass made with 7 liters volume, 1270 mm high and 120 mm diameter. It is located at 700 mm above the horizontal section of the circuit. Its upper nozzle is opened to the environment. The lower nozzle is connected to the surge line which is connected to cold leg.
The positions of the thermocouples can be seen in Fig. 1. Special connections were made in order to allow the introduction of thermocouples into the tubes in a very practical way. Connections are made of Teflon and connections are mounted on its surfaces, Fig. 3.
Figure 3. Connections and Instrumentation.
Data acquisition system is supplied by National Instruments. It consists of two signal conditioner modules, two terminal blocks and an acquisition PCMCIA card installed into a notebook computer. LabView (LabView 7.0, 2003) is used to create an interface, Fig. 4, through which all the configuration is done.
Temperature data listed below are registered at a sampling rate of approximately 7 seconds:
a) six at the hot leg; b) four at the cold leg;
c) two, inlet/outlet of the cooling water;
d) three on the external tube walls to estimate heat losses, Fig. 1.
The secondary flow rates were measured by rotameters. The circuit received many improvements, in particular its instrumentation. A new interface using Labview pack was developed for the new data acquisition system. The details of the data acquisition system based on LabView are presented in Fig. 5.
Figure 5. Software interface.
Methodology
The methodology used in this work consisted of different experimental and theoretical studies. RELAP5 code was used to simulate the natural circulation circuit. This code was originally developed for the analysis of thermal hydraulic transients in Pressurized Water Reactors (PWR). RELAP5/MOD3.2 can model, with geometric details, the primary and secondary cooling system of nuclear experimental facilities and reactors. It uses the two-fluid model and takes into account the mass, momentum and energy equations for the liquid and gaseous phases, Eqs. (1), (2) and (3), respectively. One dimensional model is used to deal with the fluid flow and the heat conduction at structures. However, generally the one model assumption is not used for the plant core cross flow and for the flooding model; instead the bidimensional heat conduction in the neighborhoods of the rewetting region is used.
Two mass equations for each one of the phases (liquid and gaseous), Eq. (1):
k k
k k k
kz
t
(1)Where: ) ( ) ( gaseous g k or liquid l k
Two momentum equations for each one of the phases (liquid and gaseous), Eq. (2):
n g n F p z n F n z t z k k k z sk k k i i z wk z ks k k k k k k k . . . . N 1 2
(2)Two energy equations for each one of the phases (liquid and gaseous), Eq. (3):
k k k i k k sk ks k k k k k k k k g A P q t p Q h h z u ti k k
N 1 '' 0 0 0 (3)
Equations (4) and (5) represent the energy and enthalpy of the stagnation of the “k” phase:
2
2
0
kk k u
u (4)
0 0 k k k
k
p
h u
(5)
Figure 6. Two-phase flow patterns.
Experimental and Theoretical Simulation
To simulate the thermal hydraulic behavior of the circuit, a new nodalization (Borges et al. 2006) was developed using PIPE and BRANCH components to represent all the circuit. At the beginning, all the volumes were filled with water except that one representing the upper part of the expansion tank, which had also some air. Heat losses to the environment were also considered. This model was able to predict the behavior for the single and two-phase experiments.
Experiments showed that two-phase oscillation only started when the upper part of the hot leg became completely filled with vapor. The saturation temperature is considered as the temperature of the change from liquid to vapor phase, in the pressure of the circuit, disregarding the presence of non-condensable gases. Table 1 presents operational conditions for the single- and two-phase flow.
RELAP5 nodalization is presented in Fig. 7.
Table 1. Operational condition of the experiment.
Single-phase flow conditions Two-phase flow conditions
Total power: 4700 W Total power: 6500 W
Cooling water: 0.05 kg/s Cooling water: 0.0233 kg/s
Initial temperature: 200
C Initial temperature: 200
C
Environment temperature: 210C Environment temperature: 210C
Figure 7. RELAP5 – Circuit nodalization.
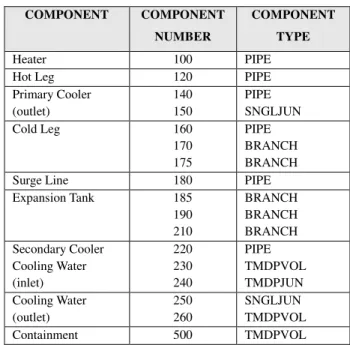
Table 2 shows the association of components between RELAP5 nodalization and the circuit.
Table 2. Nodalization of the natural circulation experimental facility.
COMPONENT COMPONENT
NUMBER
COMPONENT
TYPE
Heater 100 PIPE
Hot Leg 120 PIPE
Primary Cooler (outlet)
140 150
PIPE SNGLJUN
Cold Leg 160
170 175
PIPE BRANCH BRANCH
Surge Line 180 PIPE
Expansion Tank 185
190 210
BRANCH BRANCH BRANCH Secondary Cooler
Cooling Water (inlet)
220 230 240
PIPE TMDPVOL TMDPJUN Cooling Water
(outlet)
250 260
SNGLJUN TMDPVOL
Containment 500 TMDPVOL
Results and Discussion
For low power levels there was no phase change and, after a damped oscillatory initial behavior, a stationary flow regime was established. For higher power levels the two-phase flow patterns were observed at the beginning, followed by a two-phase oscillatory regime.
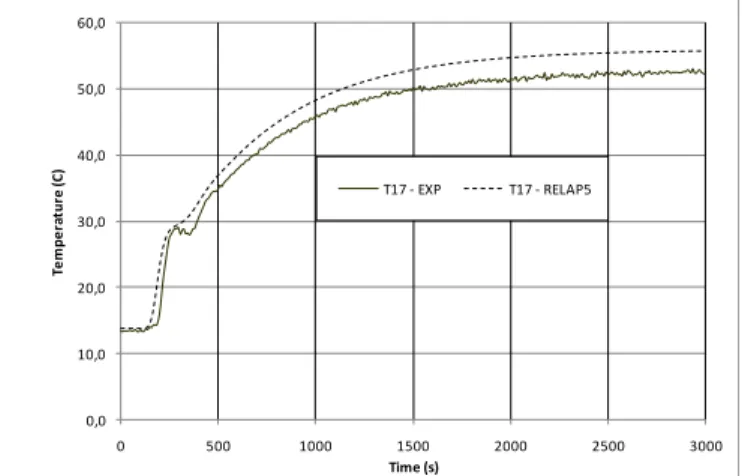
Figures 8, 9 and 10 show the comparison of measured and calculated temperature for three points of the circuit for single-phase flow. These points correspond to the thermocouples: T12, T17 and T22, respectively, represented in Fig. 1.
0,0 10,0 20,0 30,0 40,0 50,0 60,0 70,0 80,0
0 500 1000 1500 2000 2500 3000
T
e
m
pe
ra
tur
e
(
C
)
Time (s)
T12 - EXP T12 - RELAP5
0,0 10,0 20,0 30,0 40,0 50,0 60,0
0 500 1000 1500 2000 2500 3000
T
e
m
pe
ra
tur
e
(
C
)
Time (s)
T17 - EXP T17 - RELAP5
Figure 9. Theoretical and experimental temperatures for single-phase flow, T17.
0,0 5,0 10,0 15,0 20,0 25,0 30,0 35,0 40,0
0 500 1000 1500 2000 2500 3000
T
e
m
pe
ra
tur
e
(
C
)
Time (s)
T22 - EXP T22 - RELAP5
Figure 10. Theoretical and experimental temperatures for single-phase flow, T22.
Figures 11, 12 and 13 show the results of measured and calculated temperatures for the same three circuit positions, shown before, for two-phase flow regime. For higher power levels, the same single-phase oscillatory flow pattern was observed at the beginning, followed by a two-phase oscillatory regime. The cycles observed at the experiment had a well-defined amplitude and periodicity of approximately 50 seconds. Analyzing the behavior of the hot leg, a cycle can be divided into three stages: incubation, expulsion and a refill period.
At the incubation period there was no net flow at the loop. The vapor bubbles, generated at the heater, merged at the contraction, creating a slug flow at the vertical part of the hot leg. During this period, the vapor remained at the upper horizontal leg of the loop drying this part of the circuit. At this period, the circuit pressure grew slightly expulsing the liquid from the cold leg to the expansion tank. A thermocouple at the heater inlet registered the gradual rise of the liquid temperature.
As more and more vapor was generated at the heater, the slug flow was replaced by a churn flow with the expulsion of liquid, entrained by the vapor, to the cold leg through the coil cooler. This period characterized the expulsion period. The expansion tank water level rose, consequently, increasing a little more the pressure inside the circuit.
The difference of the hydrostatic head between the hot and cold legs increased, creating a flow rate at the circuit, replacing the hot water at the heater by cold water from the coil cooler. Then, the vapor production at the heater decreased, and the
horizontal part of the hot leg was partially filled with water again. At this time, a natural circulation flow, similar to single-phase flow, was established for a short period until two-phase flow process started again.
0,00 20,00 40,00 60,00 80,00 100,00 120,00
0 500 1000 1500 2000 2500 3000
T
e
mp
e
ra
tu
re
(C
)
Time (s)
T12 - RELAP5 T12 - EXP
92,00 94,00 96,00 98,00 100,00 102,00 104,00 106,00
2200 2300 2400 2500 2600
T
e
m
p
e
ra
tu
re
(C
)
Time (s) T12 - RELAP5 T12 - EXP
Figure 11. Theoretical and experimental temperatures for two-phase flow, T12.
RELAP5 simulation was able to predict the natural circulation oscillatory behavior as shown in the detail of Fig. 11. This was also observed for the pressure behavior, Fig. 14. Additional RELAP5 models will be considered to improve the results.
0,00 10,00 20,00 30,00 40,00 50,00 60,00 70,00 80,00 90,00 100,00
0 500 1000 1500 2000 2500 3000
T
e
m
pe
ra
tur
e
(C
)
Time (s)
T17 - RELAP5 T17 - EXP
Figure 12. Theoretical and experimental temperatures for two-phase flow, T17.
0,00 10,00 20,00 30,00 40,00 50,00 60,00 70,00 80,00 90,00
0 500 1000 1500 2000 2500 3000
T
e
m
pe
ra
tur
e
(
C
)
Time (s)
T22 - RELAP5 T22 - EXP
Figure 13. Theoretical and experimental temperatures for two-phase flow, T22.
0,9 1 1,1 1,2 1,3 1,4 1,5
0 500 1000 1500 2000 2500 3000 3500 4000 4500 5000
P
re
ss
u
re
(
b
a
r)
Time (s)
RELAP5 (pressure) EXP. (pressure)
Figure 14. Theoretical and experimental pressure for two-phase flow.
Figures 15 and 16 show the mass flow and void fraction of the primary circuit, respectively, obtained with RELAP5 simulations for two-phase flow.
-0,4 -0,15 0,1 0,35 0,6 0,85 1,1 1,35 1,6
0 1000 2000 3000 4000 5000
M
a
s
s
F
lo
w
(
k
g
/s
)
Time (s)
RELAP5
Figure 15. Mass flow in the primary circuit for two-phase flow.
0 0,2 0,4 0,6 0,8 1
0 1000 2000 3000 4000 5000
V
oi
d
Fra
c
ti
on
Time (s)
RELAP5
Figure 16. Void fraction in the secondary circuit for two-phase flow.
Besides the absence of a specific instrumentation to measure mass flow rate in the circuit, it was observed a reverse flow for two-phase regime. This behavior was captured by RELAP5 as shown in Fig. 15.
Conclusions
Natural circulation circuit upgrade was successfully done and operational improvements were verified.
Experiments were performed in single- and two-phase flow. Natural circulation phenomenon was also numerically simulated with RELAP5. The experimental and theoretical comparison showed to be in a good agreement.
Some experiments are scheduled in order to measure: flow rate of the primary circuit, level of the expansion tank and heat section outlet void fraction. Void fraction estimates will be done using different techniques in a comparative study. Additionally, new experiments with a wider power range will be performed in order to compare with some RELAP5 numerical models. It will contribute to the better understanding of the single- and two-phase natural circulation phenomena.
Acknowledgements
The authors wish to acknowledge the support for this work by Departamento de Engenharia Química da Escola Politécnica (USP).
References
Azzoune, M., Mammou, L., Boulheouchat, M.H., Zidi, T., Mokeddem, M.Y., Belaid, S., Salah, A.B., Meftah, B. and Boumedien, A., 2010, “NUR research reactor safety analysis study for long time natural convection (NC)
operation mode”,Nuclear Engineering and Design, Vol. 240, pp. 823-831. Braaten, M.E. and Shyy, W., 1987, “Study of Pressure Correction Methods with Multigrid for Viscous Flow Calculations in Nonorthogonal Curvilinear Coordinates”, Numer. Heat Transfer, Vol. 11, pp. 417-442.
Borges, E.M., Braz, F.A. Filho, Sabundjian, G., 2006, “Familiarização do programa computacional RELAP5”, Relatório Técnico da Divisão de Energia Nuclear, IEAv, CTA.
Jaluria, Y. and Torrance, K.E., 1986, Computational Heat Transfer, Hemisphere, Washington, D.C.
Kaliatka, A., Uspuras, E., Vaisnoras, M. and Krivoshein, G., 2010,
“Analysis of decay heat removal from RBMK-1500 reactor in decommissioning phases by natural circulation of water and air”,Nuclear Engineering and Design, Vol. 240, pp. 1242-1250.
LabView 7.0 Express, 2003, National Laboratory, USA.
Omar, H., Ghazi, N., Alhabit, F. and Hainoum, A., 2010, “Thermal Hydraulic analysis of Syrian MNSR research reactor using RELAP5/Mod3.2
code”, Annals of nuclear Energy 37, pp. 572-581.
RELAP5/MOD3.2.2Gamma, NUREG/CR-5535, IDAHO LAB. SCIENTECH Inc., Idaho (1999).
Sabundjian, G., Andrade, D.A., Umbehaun, P.E., Torres, W.M., Belchior Jr, A., Castro, A.J.A, R. Rocha, T.V. and Damy, O.L.A., 2005,
“Simulação e Análise do Fenômeno de Circulação Natural Monofásica e Bifásica no Circuito Experimental Instalado na Engenharia Química POLI –
USP, com o Código RELAP5”, INAC2005, Santos.
Sabundjian, G., Andrade, D.A., Umbehaun, P. E., Torres, W.M., Belchior Jr, A., Castro, A. J.A, R. Rocha. T.V.,Damy, O.L.A. and Torres, E.,
2006, “Análise Experimental do Fenômeno de Circulação Natural”, ENCIT 2006, Curitiba.
Sabundjian, G., Andrade, D. A., Umbehaun, P.E., Torres, W.M.., Castro, A.J.A., Conti, T.N., Masotti, P.H.F., Mesquita, R.N., Paladino, P.A., Braz, F.A. Filho, Borges, E.M., Belchior Jr, A.., Rocha, R.T.V. and Damy,
O.L.A., 2008, “Análise Teórico e Experimental do Fenômeno de Circulação
Natural”, EBECEM2008, Florianópolis.