João Monteiro Ferreira de Mira Coroa
Bachelor in Micro and Nanotechnologies EngeneeringTransfer of a Single Layer Graphene
Dissertation submitted in partial fulfillment of the requirements for the degree of
Master of Science in
Micro and Nanotechnologies Engineering
Adviser: Prof. Dr. Stefan De Gendt, Full Professor, University of Leuven
Co-advisers: Dr. Steven Brems, Senior Researcher, imec
Prof. Dr. Rodrigo Paiva Fernão Martins, Full Professor, Faculty of Sciences and Technology, Nova University of Lisbon
Transfer of a Single Layer Graphene
Copyright © João Monteiro Ferreira de Mira Coroa, Faculty of Sciences and Technology, NOVA University Lisbon.
The Faculty of Sciences and Technology and the NOVA University Lisbon have the right, perpetual and without geographical boundaries, to file and publish this dissertation through printed copies reproduced on paper or on digital form, or by any other means known or that may be invented, and to disseminate through scientific repositories and admit its copying and distribution for non-commercial, educational or research purposes, as long as credit is given to the author and editor.
Acknowledgements
In this section I would like to express my deepest gratitude to everyone involved in these last amazing 5 years that culminates with a master’s degree in Micro and Nanotechnolo-gies Engineering.
Firstly, I would like to thank my promotor, Prof. Dr. Stefan de Gendt, for the unfor-gettable opportunity he gave me by accepting me as his student and for all the advices that helped enrich this thesis. To my advisor Dr. Steven Brems, for taking responsibility of my person throughout my staying at imec, for all the first introductions at brand new topics and for all the meetings, opinions and laughs about our amazing friend graphene.
A big thanks to also my advisor, Prof. Dr. Rodrigo Martins, not only for the support during my staying in a foreign country but also for the important opinions about my work. Moreover, I would like to thank him and Prof. Elvira Fortunato for creating this amazing course of Engineering in Micro and Nanotechnologies.
Next, a very special thanks to Ken Verguts. Although your name is not in the first page you were a pillar in this thesis alongside with my promotor and advisers. Thank you, Ken, for all the successful and failed experiments, for all the runs you told me about, for the most excruciating pain I ever felt (Dodentoch, next year!), for all the laughs, late lunches, late afternoons working in the clean room but above all, thank you for all the things you taught me about graphene, our lovely and compliant friend. Also, I’m grateful to Kenny that in my first month helped more than ever adapting to Belgium, imec and even my home residence where I would be the next 7 months.
I would like also to acknowledge imec for receiving me as a student intern and for the excellent, top of-the-art conditions that allowed me to do an amazing research. A big thanks to all the NAME team that contributed with knowledge, challenges and ideas to the improvement of this thesis.
To all my friends and colleagues that helped me through this academic journey, and helped me study but also have fun. Because it all started with “dois amigos e um indiano” to my two friends, Tiago Gameiro and Shiv Bhudia, for the endless stories we shared together, the countless hangouts to study and to try to explain things to Shiv (but in the end he was getting higher grades), for all the parties, mts travels, it would not be the same without you. Also to my brother, Alexandre Fonseca, that showed me new expressions that only he knew like “é o pagode”, for all the times he gave me shelter until the next day so I couldn’t miss the test in early morning, for all the bad moments that he always knew how to turn in good moments. To Viorel Dubceac, my margem sul brother, for actually
making me “respect” margem sul and for all the talks with always inspiring words. To Sara Silvestre, my surfing partner that always had time for a quick surf no matter how busy her life was and by being a friend that I can always rely on. To Inês Martins, the little girl from Melisses with a big hearth that always has patience for us. To Jolu, David, Crespo, Chico, Xana, Vasco, Cátia, Sabrina, Caupi, Oliveira, Afilhada, Marco and all my nano friends that I “forgot” to mention here. . . all of you helped in your own special way. Thank you all.
Also, I would like to thank my tropas from Massamá for your unconditional support, love and coffes during the weekend. No matter how apart life take us you always can count on me and will be forever in my hearth.
To my Belgium family, Karen, Kostas, Panos, Pavlos, Yannis, Boren, Yahan, Eric and Ammar and my Erasmus boys, Ricardo, Marc and George. Thank you for providing great barbeques, bowling games, amazing trips and inspirational discussions. Belgium without you will never be the same.
Last, but not least, to my loving family, without them I could not be here. Thanks for all the help and the opportunity to have an education for the future. To my father, my mother, my brother, my uncles, Bé e Tia, my cousins, Marta e Madalena (as feias) and to my grandmothers, Avó Ilda e Avó Bia. You have always been in my thoughts, giving me energy and support for one more “cold” day in Belgium. This work is also yours, thank you.
Abstract
Graphene is a truly outstanding 2D material that holds the promise of revolutionizing the world with its many applications. All this expectation requires a high-quality graphene synthetized and transferred at large scale. Unfortunately, such industrial graphene is not currently feasible due the difficulty of the transfer even though its synthesis via chemical vapour deposition is becoming viable. Graphene is synthetized on a metal substrate, ren-dering graphene transfer an absolute necessity for use in electronic applications. A very recent transfer method, named direct transfer, has been proposed based on the electro-chemical delamination that gives some hope in the matter. However, it is a method that still needs optimization by understanding its basis and by studying new target materials.
In this sudy, the intercalation of different ions/molecules during the electrochemical delamination is discussed. According to literature, during the electrochemical delamina-tion H2bubbles produced at the cathode are responsible for delaminating the graphene. This work contradicts it, by saying that it is not the H2bubbles but rather charged species
of the electrolyte. A cathodic and anodic study was made, where solutions with ions that would undergo electrochemical reactions in and outside the electrochemical window (EW) of water were tested. This thesis concluded that only if the cation/anion reaction is outside the EW or that the charged species will not react that the graphene would delam-inate. Sodium hydroxide is the standard electrolyte used although it originates sodium contamination in graphene but now, electrolytes such as tetramethylammonium hydrox-ide and chlorhydrox-ide and tetraethylammonium hydroxhydrox-ide can be used instead, avoiding at last sodium contamination in graphene devices.
Furthermore, this work also briefly discusses graphene adhesion to the target substrate and suggests, perhaps, hydrogen silesquioxane as target substrate due its capability of being transformed partially in SiO2after curing and avoiding the doping caused by the previous target substrate used.
Keywords: Graphene, direct transfer, electrochemical delamination, ion intercalation, chemical vapour deposition
Resumo
O grafeno é um material 2D extraordinário que promete revolucionar o mundo através das suas diversas aplicações. Todo este idealismo requer um grafeno de alta qualidade sintetizado e transferido em largas escalas. Infelizmente, tal grafeno industrial não é atualmente fiável devido à dificuldade existente em transferi-lo, apesar da sua síntese por deposição química de vapores estar-se a tornar plausível. O grafeno é crescido num substrato metálico, dando uma extrema importância à transferência do grafeno para aplicações electrónicas. Muito recentemente um método de transferência, denominado por transferência direta, foi proposto baseado na delaminação eletroquímica que pretende dar alguma esperança. Contudo, é um método que precisa de ser otimizado ao entender o seu funcionamento e ao estudar novos materiais para substrato alvo.
Neste estudo, a intercalação de diferentes iões/moléculas durante a delaminação ele-troquímica é discutida. De acordo com a literatura, durante a delaminação elecele-troquímica bolhas de hidrogénio são produzidas no cátodo e são responsáveis por delaminar o gra-feno. Este trabalho contradiz isso na medida que não são as bolhas de hidrogénio, mas sim os iões do eletrólito. Um estudo catódico e anódico foi feito, onde soluções com iões que iriam ter uma reação eletroquímica dentro e fora da janela eletroquímica (JE) da água foram testados. Esta tese conclui que apenas quando a reação do catião/anião é fora da JE ou quando os iões não reagem é que o grafeno irá delaminar. Hidróxido de sódio é o eletrólito normalmente usado apesar da contaminação de sódio que causa ao grafeno mas, agora, eletrólitos como o hydróxido e cloreto de tetrametilamónio e hidróxido de tetraetilamónio surgem como alternativas, evitando por fim a contaminação por sódio em dispositivos de grafeno.
Para além disso, este trabalho também discute brevemente a adesão do grafeno ao substrato alvo e sugere possivelmente o hidrogénio silsesquioxano como substrato alvo devido à sua capacidade de se transformar parcialmente em SiO2após recozimento e ao
facto de evitar a dopagem causada pelos substratos alvos já usados.
Palavras-chave: Grafeno, transferência directa, delaminação electroquímica, intercalação de iões, deposição química de vapores
Contents
List of Figures xv
List of Tables xvii
Acronyms xix
Motivation xxi
Objectives xxiii
1 Introduction 1
1.1 Graphene . . . 1
1.1.1 A Carbon structure . . . 2
1.1.2 Electronic and Crystal structure. . . 3
1.1.3 Stacking . . . 5
1.1.4 Properties . . . 5
1.1.5 Applications . . . 6
2 Experimental Methods 7 2.1 Synthesis . . . 7
2.2 Transfer . . . 8
2.2.1 Direct Transfer . . . 9
2.2.2 Wet-Transfer . . . 10
2.2.3 Dry-transfer . . . 10
2.3 Characterization . . . 11
2.3.1 Optical Microcope . . . 11
2.3.2 Raman spectroscopy . . . 12
3 Results and Discussion 15 3.1 Starting Material. . . 15
3.2 Direct Transfer - issues . . . 15
3.3 Electrolyte Study . . . 16
3.3.1 Sample as cathode. . . 17
3.3.2 Sample as anode. . . 21
C O N T E N T S
3.4 Graphene’s adhesion to HSQ . . . 25 3.5 Direct Transfer - a solution? . . . 27
4 Conclusion and Future Perspectives 29
Bibliography 31
A Target Substrate 39
B Support Material 41
C Calculations for the reduction/oxidation potential 43
List of Figures
1.1 Graphene monolayer, a plane of carbon atoms. . . 1
1.2 Graphene as the mother of all graphitic forms . . . 2
1.3 Atomic orbital diagram for a carbon sp2hibridization and its resultant trigonal planar geometry . . . 3
1.4 Band structure of graphene, metals, insulators and semiconductors . . . 4
1.5 Crystal structure of graphene . . . 4
2.1 A process flow chart of graphene synthesis . . . 7
2.2 Process route for the direct transfer . . . 10
2.3 Process route for a standard wet-transfer . . . 10
2.4 Process route for a standard dry-transfer . . . 11
2.5 Optical microscopy image after a wet graphene transfer using NaOH . . . . 12
2.6 Comparison of Raman spectra at 532 nm for few-layer graphene . . . 12
3.1 Scheme of a home-made bonding setup for a direct graphene transfer . . . . 16
3.2 Optical microscopy image after a direct graphene transfer . . . 16
3.3 Cations of an electrolyte being attracted by the electrode (cathode). . . 17
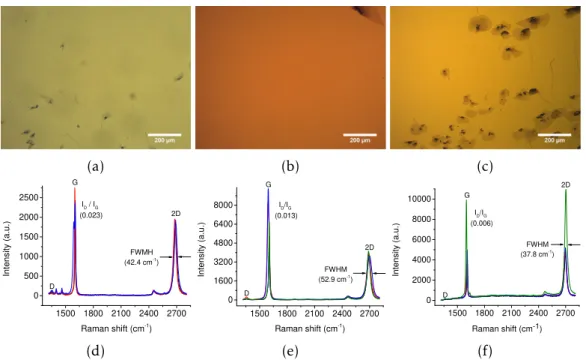
3.4 Optical microscopy images after a wet graphene transfer with (a) NaOH, (b) TMAH and (c) TEAH and their respective (d, e, f) Raman spectra measured in four different points. . . . . 18
3.5 Optical microscopy images after a wet graphene transfer with (a) NaNO3, (b) Na2SO4, (c) K2SO4 and (g) TMACl and their respective (d, e, f, h) Raman spectra measured in four different points. . . . . 19
3.6 Zoom in of the reduction area in a water electrochemical window. . . 21
3.7 Anions of an electrolyte being attracted by the electrode (anode). . . 22
3.8 Optical microscopy images after a wet graphene transfer with (a) HNO3, (b) NaNO3, (c) Na2SO4, (g) K2SO4, (h) TMACl and (i) NaCl and their respective (d, e, f, j, k, l) Raman spectra measured in four different points. . . . . 23
3.9 Zoom in of the oxidation area in a water electrochemical window. . . 24
3.10 (a) Optical microscopy image after a wet graphene transfer with Na2SO3and its respective (b) Raman spectra measured in four different points. . . . . 25
L i s t o f F i g u r e s
3.11 Optical microscopy image after a wet graphene transfer with HSQ as target substrate (a) before polymer removal, (b) after polymer removal and (c) after
annealing and polymer removal.. . . 27
3.12 Optical microscopy images after a wet graphene transfer with HSQ as target substrate (a) before and (b) after polymer removal and its respective (c) Raman spectra measured in four different points. . . . . 28
3.13 Optical microscopy image after a direct graphene transfer with (a) TMAH, (b) TEAH and (c) TMACl and their respective (d,e,f) Raman spectra measured in four different points. . . . . 28
A.1 Graphene visible on a Si/SiO2substrate. . . 39
B.1 Skeletal formula of (a) PMMA, (b) PDMS and (c) PC. . . 41
B.2 Chemical structures of HSQ: (a) cage form, (b) network form. . . 42
C.1 Electrochemical window of water for: (a) acidic solutions, (b) neutral solutions and (c) alkaline solutions. . . 44
List of Tables
1.1 Some properties of graphene. . . 6
3.1 Electrolyte study results summary. . . 26
C.1 Reduction/oxidation potentials of water depending on the pH of the solution. 43 C.2 Reduction/oxidation potentials of the remaining ions. . . 45
Acronyms
0D zero-dimensional.
1D one-dimensional.
2D two-dimensional.
3D three-dimensional.
BLG bi-layer graphene.
BZ Brillouin zone.
CB conduction band.
CMOS complementary metal-oxide semiconductor.
CVD chemical vapour deposition.
DCM dichloromethane.
EW electrochemical window.
FDTS perfluorodecyltrichlorosilane.
FLG few-layer graphene.
FWHM full width at half maximum.
HSQ hydrogen silsesquioxane.
IFW interfacial water.
MLG multi-layer graphene.
PC polycarbonate.
PDMS polydimethylsiloxane.
PMMA poly-methyl methacrylate.
AC R O N Y M S
rpm rotations per minute.
SHE standard hydrogen electrode.
SLG single-layer graphene.
TCO transparent conductive oxide.
VB valence band.
Motivation
Since early ages I always felt a duty in preserving the world as we know it and, at the same time, in working towards a better and sustainable world for everyone. As I grew up I watched, enthusiast and perplex, the constant evolution and innovation of technology and the impact that did on our daily life. Rapidly I noticed that knowledge allied with technology it is what drives us to a brighter and exciting future.
The exploitation of our world’s natural resources has always been a fundamental lever for technology success. A great example is the use of silicon in the semiconductor industry, a fundamental element for all of our integrated circuits (computers, cell phones and modern technology depends on it). However, with silicon pushed beyond limits in terms of miniaturization, we are coming to a technology barrier that challenges Moore’s law. Thus, it is fundamental that we find alternatives and new ways to approach this obstacle. Scientists are constantly searching for a way to overcome, either by re-thinking the production process of devices, either by searching new materials that could replace silicon. Graphene reflect this potentiality in the means that represents a new path that could lead us to the next technology revolution, being one of the examples more discussed the supercapacitors that make our batteries obsolete. And this is only the tip of the iceberg, because graphene has extraordinary properties that, if applied with success, will revolutionize our world. However, high-quality graphene (required for these novel devices) is a material hard to synthetize and even more difficult to transfer, especially in larger scales so we can produce it industrially. With this mindset, my motivation becomes clear: transform this hope into reality.
Objectives
Single layer graphene has been called as the “wonder material” since its isolation in 2005 and its amazing properties promise to change the world as we know it. To integrate graphene in a novel architecture concept for CMOS technology it is necessary to transfer the graphene from its catalytic growth substrate to a dielectric substrate. The aim of this work is to study the intercalation of different ions/molecules during the electrochemical transfer process, which can be accelerated by attracting them via a potential. At the same time, it also intends to optimize the graphene direct transfer method by avoiding sodium contamination. Finally, it briefly discusses a different material, hydrogen silesquioxane, as a new target substrate for graphene direct transfer.
The transfer is said to be successful and with good quality if the following conditions are met:
• No additional damage on the graphene (wrinkles and cracks) during and after the transfer;
• No presence or minimal contamination of supporting material, solvents and other chemicals in the surface of the graphene or in the interface graphene-substrate;
• Scalability of the process to enable transfer of wafer scale graphene sheets (large production).
C h a p t e r
1
Introduction
In this chapter the concept of graphene and how it emerged in our scientific world is explained. Additionally, it explores the unique structure of graphene and its amazing properties and thereafter the outstanding applications that have captured the attention and imagination of everyone.
1.1 Graphene
By entering the micro and nanoworld, size and dimension are the most crucial parameters when studying material properties.Two-dimensional (2D)materials are known for hav-ing only one (out of three) dimension restricted in size, usually in the vertical direction. A single atomic plane is considered a2Dcrystal, whereas 100 layers of that should be considered as a thin film of athree-dimensional (3D)material. Therefore, they will differ in some properties from their bulk form, such as: optical and electronic properties (due the confinement of electrons) and chemical and mechanical response (due the geometry effect and high surface area) [1,2].
Figure 1.1:Graphene monolayer, a plane of car-bon atoms.
Graphene appears as the most promis-ing2Dstructure for carbon materials due its potential technology impact. In simple terms, graphene is made of one atom thick layer of pure carbons atoms that are highly packed in a hexagonal honeycomb arrange-ment, and can be thought of as fused
ben-zene rings without their hydrogen atoms [3], as illustrated in Figure1.1.
Its first theoretical approach was done in 1974 by Wallace [4] and it was considered by the scientific community that strictly2Dcrystals were thermodynamically unstable and could not exist [5,6]. However, it was not until 2004 that A. Geim and K. Novoselov [7] proved the contrary and isolated for the first time a few layers of graphene at room temperature. One year later [8] they successfully narrowed it down to a single-layer graphene (SLG)by micromechanical exfoliation using the scotch tape method, a simple process but yet time consuming. Subsequently, their work led to more experimental activity regarding two dimensional materials [9,10] and thanks to their groundbreaking experiments on graphene in 2004, they were awarded the 2010 Nobel Prize in Physics [11]. Bi-layer graphene (BLG) is considered to have two sheets of graphene andfew-layer
C H A P T E R 1 . I N T R O D U C T I O N
graphene (FLG)has three to ten sheets whereas more than that is consideredmulti-layer graphene (MLG)and has the same electronic properties of graphite [12].
1.1.1 A Carbon structure
Carbon plays an intrinsic role in our nature, providing the basis for life on Earth. It is one of the few elements known since antiquity and the sixth element off our periodic table. Has a total of six electrons that occupy the atomic orbitals as 1 s2, 2 s2, 2 px1and
2 py1. Being a tetravalent element (i.e. only the four exterior electrons participate in
the formation of covalent chemical bonds) carbon atoms can likely bond together in different molecular/crystalline arrangements, forming the distinct carbon allotropes with dissimilar properties. The most common crystalline forms of carbon are graphite (the ’lead’ of a common pencil) and diamond [13,14].
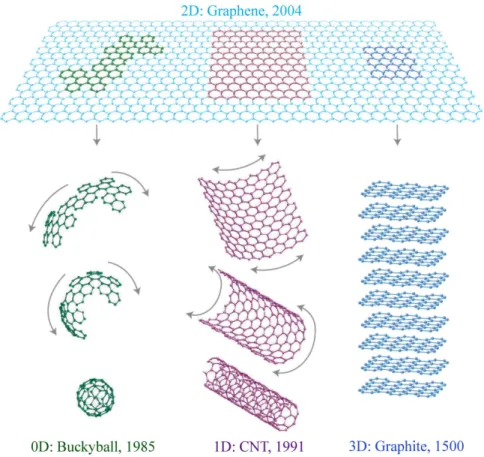
As depicted in Figure1.2graphene is the basic building block of all graphitic forms. From there it can “wrap” itself into a zero-dimensional (0D)spherical C60 buckyball, “roll” itself into a one-dimensional (1D) CNT or it can be stacked into a 3D block of
graphite, with an interplanar space of 0.335 nm [15].
Figure 1.2:Mother of all graphitic forms. Graphene is a 2D building material for carbon materials of all other dimensionalities. It can be wrapped up into 0D buckyballs, rolled into 1D nanotubes or stacked into 3D graphite. Adapted from [16].
It is important to note that all these carbon allotropes result from a phenomenon
1 . 1 . G R A P H E N E
called hybridization, i.e. the concept of mixing atomic orbitals into new hybrid orbitals suitable for the pairing of electrons to chemically bond to other atoms. There are three types of hybrid configurations: sp3, sp2 and sp. In the case of carbon, its allotropes distribute themselves in a tetragonal sp3configuration (diamond), in a trigonal sp2 con-figuration (carbon nanotubes, buckyballs and graphite) and in a planar sp concon-figuration (acetylene). In particular, graphene is a single-layer sheet of sp2 carbon atoms with a carbon-carbon bond length of 0.142 nm [17, 18]. A sp2 hybridization occurs when one s-orbital is combined with only two 2p-orbitals, specificallypx andpy (see Figure1.3a).
By this, the sp2 orbitals contribute together to a planar assembly with an angle of 120° between them where the additionalpz orbital is perpendicular to them [19], as shown in Figure1.3b.
(a) (b)
Figure 1.3: (a) Atomic orbital diagram of a carbon atom hybridizing to a sp2 configuration
(adapted from [20]) and (b) its resultant trigonal planar geometry (from [21]).
1.1.2 Electronic and Crystal structure
Regarding the electronic structure of graphene, the sp2-orbitals are responsible for form-ing a strong covalent bond (σ-bond) between the three neighboring atoms inducing the planar hexagonal honeycomb structure of graphene. The C-C bonding is enhanced by a fourth bond (π-bond) associated with the overlap of pzorbitals. The electronic properties
are determined by the bondingπandπ* orbitals, forming the electronic valence and con-duction bands. The dispersion of the pi electrons in graphene was first calculated within the tight-binding approximation in 1947 [4] (see Figure1.4a) and they are responsible for most of the electronic and chemical properties of graphene [15].
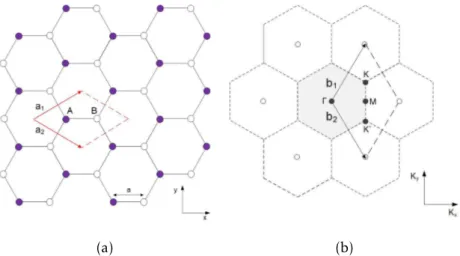
Concerning the crystal structure, the unit cell of graphene has a basis of two non--equivalent carbon atoms (A and B) and graphene has a honeycomb bipartite lattice struc-ture with two corresponding triangular sublattice sites (see Figure 1.5a). The lattice vectors (known as the real space vectors, a1 and a2) and the reciprocal-lattice vectors (denoted as the Fourier transformation of the real space vectors, b1and b2) can be written
in cartesian coordinates as the following, wherea= 0.142 nm [3,14,23]:
a1= a
2(3,
√
3) ; a2= a 2(3,−
√
3) ; b1= 2π 3a(1,
√
3) ; b2=2π 3a(1,−
√
3)
C H A P T E R 1 . I N T R O D U C T I O N
Figure 1.4: (a) Energy dispersion of single-layer graphene obtained via nearest neighbour ap-proximation. Band structure of (b) graphene, (c) metals and (d) insulators (for Eg > ~4 eV) or
semiconductors (for Eg< ~2 eV). Adapted from [22].
(a) (b)
Figure 1.5:Crystal structure of graphene: (a) hexagonal lattice of graphene in real space with basis vectors a1 and a2. The unit cell is marked in red. It contains two nonequivalent carbon
atoms A and B, each of which span a triangular sublattice; (b) Reciprocal lattice (dashed) with reciprocal lattice vectors b1and b2. The first Brillouin zone is highlighted in grey and the high
symmetry pointsΓ, M, K and K’ are indicated. Adapted from [20].
The first Brillouin zone (BZ)can be defined as the primitive cell in the reciprocal space, represented in Figure1.5b. Furthermore, the unit cell of graphene in the real space is transcribed to the firstBZwith four independent high-symmetry points. Of particular importance for the physics of graphene are the two points K and K’ at its corners. At these points, denominated Dirac points, something extraordinary occurs: theconduction band (CB)and thevalence band (VB)touch each other in a conical energy spectrum with a linear dispersion, forming a structure known as Dirac cone (see Figure1.4b). For this reason, graphene is often called a zero-gap semiconductor at these points and the charge carriers (electrons or holes) are considered massless Dirac Fermions (i.e., same velocity and absolutely no inertia), exhibiting exceptional high mobilities [24]. These Dirac cones
1 . 1 . G R A P H E N E
are rather unique strucutures since there is no partially-filled band, unlike the metals (see Figure1.4c), but no gap, unlike the insulators and semiconductors (see Figure1.4d) [3, 10].
1.1.3 Stacking
As pointed out in Section 1.1, graphene can be quantified accordingly to the amount of layers existing (SLG, BLG,FLG orMLG). When stacked, carbon atoms can be set in different ways [25–27]:
• Hexagonal or AA stacking, where the carbon atoms of both layers are situated on top of each other;
• Bernal or AB stacking, which have one layer shifted with respect to the other layer - one corner of the hexagons of the top sheet is located above the center of the hexagons of the bottom sheet. Is the lowest energy stacking and therefore the most common form in single crystal graphite andFLG;
• Turbostratic stacking, where one layer is rotated with respect to the other by an angle ofθ,n 60° where n = 0, 1, 2...;
• Rhombohedral or ABC stacking (only for more than two layers), where the third layer has no overlap with the first nor with the second layer.
Depending on the number of layers and in the stacking sequence, graphene can have its electronic properties changed considerably, altering its band structure itself. For example, AB stacked bi-layer graphene is considered the only tunable gap (i.e., it can develop into an energy gap if it is subjected to an external perpendicular electric field [28]) semiconductor and shows a gapless state with parabolic bands (quadratic dispersion) instead of the linear dispersion in SLG. In contrast with SLG, charge carriers in BLG have finite mass and are called massive Dirac fermions [29–31]. Although the different electronic properties obtained by stacking graphene, onlySLGis in the interest of this thesis.
1.1.4 Properties
After the first report of graphene’s exceptional electronic properties in 2005 there has been a gold-rush in exploring more amazing properties that graphene might have to offer. So far, there are some remarkable properties reported (see Table1.1) that provided the graphene the title of the thinnest, most flexible and strongest material known to humankind. Graphene also shows room-temperature ambipolar characteristics, where charge carriers can be alternated between holes and electrons depending on the nature of the gate voltage [32,33].
C H A P T E R 1 . I N T R O D U C T I O N
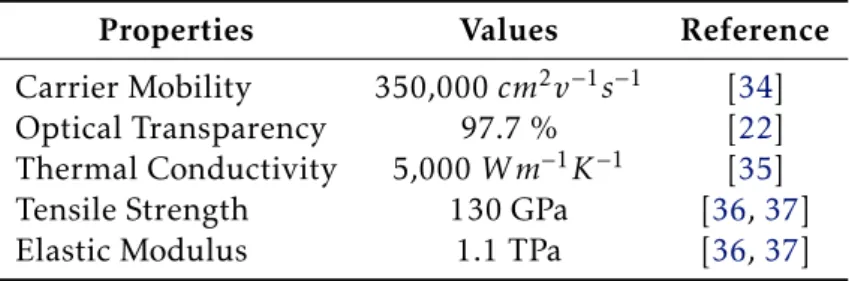
Table 1.1:Some properties of graphene.
Properties Values Reference
Carrier Mobility 350,000cm2v−1s−1 [34]
Optical Transparency 97.7 % [22]
Thermal Conductivity 5,000W m−1K−1 [35]
Tensile Strength 130 GPa [36,37]
Elastic Modulus 1.1 TPa [36,37]
1.1.5 Applications
A close look to the values represented in Table1.1shows the huge potential of graphene. Not only it has the best thermal conductivity of any known material but also exhibits the highest carrier mobility at room temperature, with values ~100 times greater than silicon and even ~10 times better than the state-of-the-art high mobility group III-IV semiconductors [38,39], holding the expectation of even reaching extremely large values of 3×106cm2V– 1s– 1[40]. However, due to the zero bandgap, it is not possible to switch
offdevices with channels made of purely graphene, limiting the on-offcurrent. There are some approaches in trying to open a bandgap [41–43]) although it is a complex method. Nevertheless, this does not rule out radio-frequency or analogue applications, such as amplifiers and transmitters, being a promising candidate for higher maximum operating frequencies (>100 GHz) [44].
Graphene’s conductivity can also be changed easily either by chemical doping or by an electric field, making it ideal for sensor applications. A scalable gas sensor from chemically derived graphene has already been demonstrated [45]. Furthermore, graphene also appears as a new generation of transparent conductors when trying to account the emerging necessity to replace existing transparent conductive oxide (TCO) materials and the growing market towards bendable electronics. Here, flexible graphene based electrodes provide critical performance advantages due the combination of a high charge carrier mobility, high transparency in the visible region and the additional flexibility and high stretchability while the standardTCOs are brittle due their ceramic nature, hard to obtain and expensive to manufacture reflecting in their high prize. However, efforts to make transparent conducting films from graphene have been hindered by the lack of efficient methods for the synthesis, transfer and scalability of graphene at a quality required for applications [46–48].
Regarding energy applications, there is a global demand for more and more energy with minimal damage to the environment. Graphene with its high electrical conductivity, large surface area, interlayer structure and being environmental friendly makes it a poten-tial contender as a material in electrochemical energy systems, such as supercapacitors [49,50], lithium ion batteries [49,51], fuel cells [49,52] and solar cells [49,53]. Moreover, its outstanding mechanical properties, large specific surface area and two dimensional high aspect ratio geometry make it ideal as a nanofiller in composite materials [54].
C h a p t e r
2
Experimental Methods
This chapter briefly reviews the various methodologies for fabricating graphene before finally depicting the transfer process of graphene and later-on its characterization.
2.1 Synthesis
Since the first isolation of graphene by scotch tape in 2005 several other techniques have been established for graphene synthesis. These new processing routes came along with efforts for efficient synthesis of large-scale graphene and can be seen as two main approaches: top-down (a bulk material is ‘carved’ out to create nano-sized graphene structures) and bottom-up (graphene is built from scratch, i.e., self-assembly of carbon atoms). An overview of graphene synthesis techniques is shown in the flow chart in Fig-ure2.1. Each one has its advantages and drawbacks depending upon the final application of graphene.Chemical vapour deposition (CVD)is the one that stands out due its high--quality, large-area scalable graphene and because it is a compatible method for future
complementary metal-oxide semiconductor (CMOS)technology [55]. Nevertheless, its bottleneck is that graphene synthesized byCVDshould be transferred from the catalyst metal substrate (such as Ru, Pt, Ni and Cu [56]) to a dielectric substrate for application to a variety of fields, making the transfer a very important and determinant step for having high-quality graphene [18].
Figure 2.1:A process flow chart of graphene synthesis. From [18].
C H A P T E R 2 . E X P E R I M E N TA L M E T H O D S
The recipes for growing graphene are optimized with the objective of growing only SLG. Graphene is grown both on Al2O3(0001)/Pt(111) wafers and Pt foils (Alfa Aesar, 50µm thick, 99.99 % trace metals basis) depending on the type of transfer that will be used and also at different conditions since they are different in terms of thickness and crystallinity. The growth was done in a vertical cold-wall Aixtron Black Magic 6”CVD system, with the reactor pressure at a constant 750 mbar throughout the full process.
In the case of the Pt on sapphire wafers, the reactor was heated in 850 sccm hydrogen atmosphere untill 1080 °C. Next, 6 sccm methane was introduced into the chamber for 30 min. Finally, the reactor was cooled down to room temperature at a cooling rate of 15 °C min– 1under a methane and hydrogen ambient with a methane to hydrogen ratio of 3:850 sccm. For the Pt foils the reactor was heated in 800 sccm hydrogen atmosphere until 980 °C. Then 5 sccm methane was introduced to the chamber for 20 minutes. To end, the reactor was cooled down to room temperature at a cooling rate of 15 °C min– 1 in a methane to hydrogen ratio of 4:800 sccm.
2.2 Transfer
As pointed out in the previous section,CVDgraphene needs to be transferred to a target substrate for most applications and basic research. A variety of transfer routes have been reported [57] and the typical adopted approach to separate graphene from its growth metal substrate is through chemical etchants to completely dissolve the metal, resulting in some unfortunate drawbacks due the etchant used, such as: environmental and costs issues, damage (defects, excess doping, etc.) and metal contamination in the graphene and loss of the growth substrate. Usually, graphene is supported by a polymeric film while the metal is being removed and the resultant polymer/graphene complex (named from this point forward as ‘stack’) is then placed on the target after which the polymer is removed by a solvent [58–60].
It was not until a few years back [61,62] that a transfer technique based on an electro-chemical delamination was proposed where the catalyst foils are not consumed and can be recycled for re-growing graphene. In this approach electrolysis takes place, by which charged ions (cations or anions) are formed when an electric current (generated by the cathode and anode) is passed through an ionic substance (electrolyte). The half reactions on the cathode (negative side) and on the anode (positive side) depends on the electrolyte used, more specifically in its pH (see equations2.1to2.6).
According to the literature [61–63], electrochemical delamination is a mechanism that counts with the mechanical separation of graphene from the metal substrate only by H2bubble formation at the cathode of an electrolytic cell. Previous studies [64], also indicate that a step of water intercalation is crucial in order for this method to work. A thin layer of water between the graphene and the metal substrate (interfacial water (IFW))
2 . 2 . T R A N S F E R
helps the hydrogen bubbles intercalate and drive the delamination forward. However, delamination by hydrogen bubbling depends on several parameters such as sample size, the cell overpotential, type of electrolyte and its concentration, etc., and although it is a simple mechanism is a process that is not quite yet understood [58]. After the delamina-tion, the graphene is transferred to the target substrate via two standard methods [56]: a dry-transfer where there is no water between the final target substrate and the graphene, and a wet-transfer where there is. The disadvantage of these methods remains in the need of a polymeric film on top of the graphene, so it can endure the process of the transfers, causing future polymer contamination when tried to remove it. Very recently [64], a new approach based on the electrochemical delamination of graphene without the need of a polymeric film was proposed, entitled direct transfer. All of them have their own route that will be explained in the following sub-sections.
Alkaline solutions
Cathode: 2 H2O (l) + 2 e− −→H
2(g) + 2 OH−(aq) (2.1)
Anode: 4 OH−(aq)−→O
2(g) + 2 H2O (l) + 4 e− (2.2)
Overall reaction: 2 OH−(aq)−→2 H
2(g) + O2(g) (2.3)
Acidic solutions
Cathode: 2 H+(aq) + 2 e−−→H
2(g) (2.4)
Anode: 2 H2O (l)−→O2(g) + 4 H+(aq) + 4 e− (2.5)
Overall reaction: 2 H2O (l)−→2 H2(g) + O2(g) (2.6)
2.2.1 Direct Transfer
Figure2.2shows the basic procedure for direct transfer. Graphene is grown in a Al2O3 (0001)/ Pt(111) wafer that limits the multilayer growth and smooths the surface, to pre-vent the trapping of water/air molecules at the target/graphene interface. Likewise, the target substrate has to be hydrophobic so it can repeal any water while doing the transfer and avoid trapping. Then a dry-bonding is made between the sample and the hydropho-bic target substrate at a pressure of 250 kPa. The electrolyte is introduced in the structure until it is completely filled and the electrolysis takes place to delaminate the graphene. At the same time, the pressure is gradually decreased where the transfer happens due the combination of the promoted water intercalation (IFW) between graphene and the Pt sap-phire wafer and the prevented water intercalation (due the hydrophobic target substrate) between the graphene and the target substrate [64].
C H A P T E R 2 . E X P E R I M E N TA L M E T H O D S Al2O3 (0001) Graphene IFW Pt (111) Target substrate + H2 O2 Electrolyte inlet + H2 O2 Electrolyte outlet
Dry-bonding between sample and the hydrophobic target
substrate, at 250 kPa
Introduction of the electrolyte and start
of electrolysis Pressure realeased gradually while graphene
delaminates naturally
Rinse a few times Remove
dry-bonding setup
-Figure 2.2:Process route for a direct transfer based on the electrochemical method with the sample as cathode and a bare Pt foil as anode.
2.2.2 Wet-Transfer
Figure 2.3 illustrates the steps for the wet-transfer. During electrolysis, the sample is carefully introduced in the electrolyte at the same time the stack is being delaminated. After a successful delamination, the stack is fished with a dummy substrate and trans-ferred to water a few times in order to rinse it. Then, it is fished with the hydrophilic target substrate (for an easier fishing and to avoid future solvent intercalation) and left to dry at 50 °C. Finally, the polymer is removed by a solvent and the transfer is complete. It is a process that is entirely dependent on the natural delamination of graphene [56].
Polymer Graphene IFW
Pt foil + Pt Electrolyte O2 H2 + Pt Electrolyte O2 H2
H2O
T = 50 ºC Hot plate
Electrolysis start Natural Graphene delamination
After some rinses, stack is fished with a hydrophilic target substrate
Dry overnight with a hot plate Polymer removed
by solvent
-Figure 2.3:Process route for a wet-transfer based on the electrochemical method with the sample as cathode and a bare Pt foil as anode.
2.2.3 Dry-transfer
Figure 2.4depicts the overall process for the dry-transfer. This time, the sample has a polydimethylsiloxane (PDMS)of 1 mm thickness on top of the polymer that allows a more carefree handling. The electrolysis starts with the appropriate voltage and after some time the graphene delaminates naturally and the PDMSis picked up with the tweezer. In case the complex stack/PDMSis not detached naturally, a minimal mechanical force
2 . 3 . C H A R AC T E R I Z AT I O N
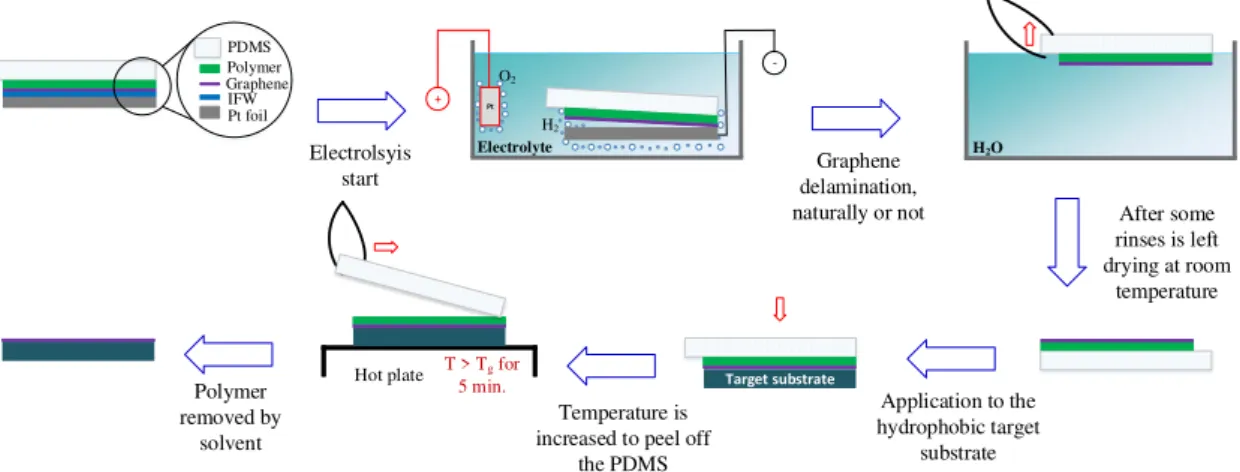
is added with the tweezer in order to promote the delamination. Then some rinses with water are made, it is usually left to dry at room temperature over-night and later-on is applied to the hydrophilic target substrate. By heating up the structure above the glass transition temperature of the support layer it is possible to peel of thePDMSleaving the stack behind attached to the target substrate. Finally, the polymer is removed by a solvent and the transfer is complete. The big advantage of this method over the wet-transfer rely in preventing ions at the graphene/target substrate interface since it does not get wet. However, this method often compromises the structural integrity of graphene making the wet-transfer a better method to obtain an uniform graphene layer capable of being used and characterized [56].
PDMS Polymer Graphene IFW
Pt foil + Pt
Electrolyte
O2
H2
H2O
T > Tg for 5 min.
Hot plate Target substrate
Electrolsyis
start delamination, Graphene
naturally or not After some rinses is left drying at room
temperature
Application to the hydrophobic target
substrate Temperature is
increased to peel off the PDMS Polymer
removed by solvent
-Figure 2.4:Process route for a dry-transfer based on the electrochemical method with the sample as cathode and a bare Pt foil as anode.
2.3 Characterization
The characterization of the resultant transfer is an important step to verify the quality and the condition of theSLG. Different characterizations like optical microscopy, Raman spectroscopy, X-ray photoelectron spectroscopy and atomic force microscopy make all together a powerful tool to achieve that. In this study it was used two main methods: optical microscopy and Raman spectroscopy.
2.3.1 Optical Microcope
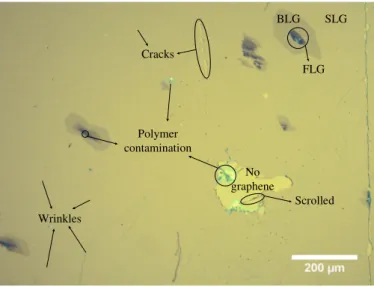
Figure 2.5 shows an example of a wet transferred graphene with sodium hydroxide
(NaOH) as an electrolyte. The microscopic images allow us the first look and estima-tion of the quality of the graphene. With it, it is possible to identify the presence of graphene (see AppendixAfor more details), as well as cracks, polymer contaminations, wrinkles and even if it is scrolled or with more than one layer (BLGorFLG).
C H A P T E R 2 . E X P E R I M E N TA L M E T H O D S
Wrinkles
SLG BLG
FLG
No graphene
Scrolled Polymer
contamination Cracks
Figure 2.5:Optical microscopy image after a wet graphene transfer using NaOH as electrolyte.
2.3.2 Raman spectroscopy
Raman spectroscopy is a vibrational technique that is extremely sensitive to geometric structure and bonding within molecules. By identifying vibrational modes using only laser excitation, Raman spectroscopy has become a powerful, noninvasive method to characterize graphene and related materials. In graphene, the spectra exhibit a relatively simple structure characterized by two principle bands designated as the G and 2D bands. A third band, the D band, may also appear in graphene when defects within the carbon lattice are present [65,66]. The band positions are illustrated in Figure2.6.
Figure 2.6:Comparison of Raman spectra at 532 nm for few-layer graphene. From [67].
Clearly, these Raman spectra demonstrate the ability to distinguish between the dif-ferent graphene layer thickness at an atomic layer resolution , although its utility relies in differentiatingSLGfrom BLG andFLG through the position of the G peak and the spectral features of the 2D band. Yet, this thesis only focus inSLGwhere each band can give us some details about it [65,66]:
2 . 3 . C H A R AC T E R I Z AT I O N
• The D band (~1350 cm– 1) is known as the disorder band or the defect band and is associated to a presence of a sp3carbon. If the D band is significant it means that
there are a lot of defects in the material. The smaller the ratio between the intensity of the D peak with the G peak (ID/IG) the less defects are present. This thesis aims
for a high-quality graphene which has this peak absent;
• The G band position (~1580 cm– 1) is an in-plane vibrational mode involving the
sp2hybridized carbon atoms that comprises the graphene sheet;
• The 2D band (~2690 cm– 1) is the second order of the D band, and is the result of
a two phonon lattice vibrational process. Unlike the D band, it does not represent defects but rather appear as a strong band in graphene. The full width at half maximum (FWHM)of this band can give an important clue about the flatness of the
graphene: smaller theFWHMsmoother is the surface and consequently the more
mobility attained, above 40 cm– 1graphene start to have large strain variations [68]. In this work, graphene is characterized using a Horiba Labram HR with a green laser (λ= 532 nm), recording intensities fromυ= 1250 cm– 1toυ= 2850 cm– 1.
C h a p t e r
3
Results and Discussion
This chapter summarizes all the work done regarding the transfer of graphene. First the direct transfer is approached as an alternative and innovative technique along with its advantages and obstacles. Secondly, to try to overcome those obstacles, a detailed study of electrolytes is made with the dry- and wet-transfers. Finally, graphene’s adhesion to the target substrate is discussed, namely with hydrogen silsesquioxane, since it is a critical factor in the transfer.
3.1 Starting Material
After the growth, the Pt sapphire wafers and Pt foils were also put in water at 50 °C for 24h in order to create theIFWlayer. Only then, the samples were considered ready to transfer.
3.2 Direct Transfer - issues
The direct transfer shows up as an exciting new method for graphene transfer. It requires few handling, does not need support/polymeric material and has the possibility to be scalable. It combines the electrolysis from the electrochemical delamination with a home--made bonding setup. The structure needed is minutely depicted in Figure3.1, with all
the important components although it still needs optimization. Apart from depending completely in the natural delamination of graphene, two major aspects are important for the success of this transfer, being the growth substrate and the target substrate. As said in sub-section 2.2.1 the growth substrate has to be sapphire (Al2O3 (0001)) with platinum oriented in the (111) direction. This way the multilayers are considerably reduced because there are no grain boundaries in the platinum (contrary to the Pt foils) and the surface is almost completely flat helping with the adhesion between the graphene and the target substrate since it will trap less water/air molecules. At the same time, the target substrate has to be hydrophobic (see AppendixA) to repel the electrolyte and minimize its intercalation between graphene and the target substrate.
Sodium hydroxide is the standard electrolyte used by the literature [56,59,61, 69]. As soon as the 250 kPa are applied, NaOH is introduced until the chamber is filled. Then the electrolysis begin with a voltage set to -2.5 V and after 3 minutes, the pressure is
decreased by 10 kPa per minute. Figure 3.2 shows the resulted graphene previously
C H A P T E R 3 . R E S U LT S A N D D I S C U S S I O N
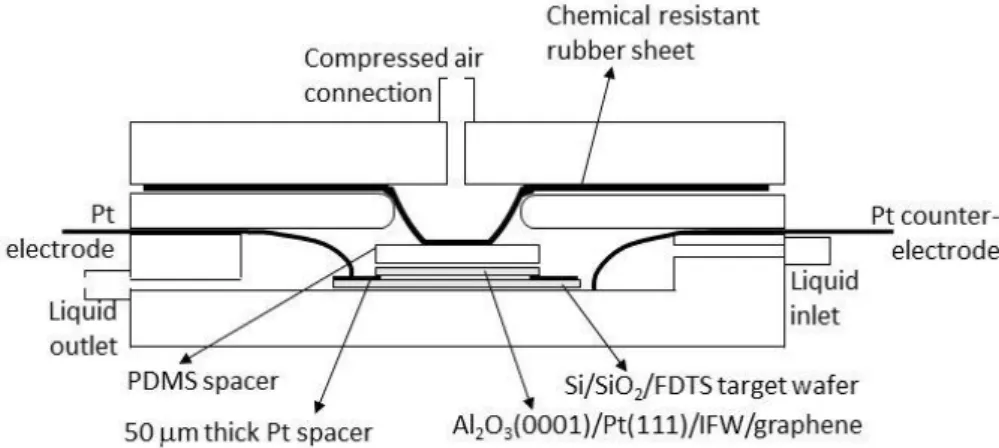
Figure 3.1:Scheme of a home-made bonding setup for a direct graphene transfer to a hydropho-bic wafer. 50 µm thick Pt spacers at the edge of the wafers are used to electrically contact the Al2O3/Pt/graphene layer and to separate the growth wafer from the target wafer. Compressed air
is used to bond graphene on top of the target wafer. A Pt working electrode connected to the Pt growth template and a Pt counter electrode is used to construct the electrochemical cell. A liquid inlet and outlet are included to introduce the electrolyte and allow the rinsing. From [64].
Figure 3.2:Optical microscopy image after a direct graphene transfer. From [64].
obtained in another study with a very clean and effective transfer (free of polymers and cracks). However, this transfer still has some issues such as sodium contamination and doping in the graphene, caused, respectively, by the electrolyte used [70,71] and by the hydrophobic substrate [72], which ultimately decreases one of the prestigious properties of graphene: its mobility. Therefore an electrolyte study and a substrate study was made in order to try to give some answers to these problems.
3.3 Electrolyte Study
As discussed in Section2.2, the electrochemical method is a technique that depends on the electrolytic cell. Actually, not every electrolyte, despite being conductive and therefore contributing with charged ions to the process, helps in graphene delamination [58]. In order to eliminate sodium contamination, it is important to understand why NaOH works and also to have an idea of which electrolyte would work for further process optimization.
3 . 3 . E L E C T R O LY T E S T U DY
The sapphire wafers with platinum are an expensive material to obtain and hence the stan-dard electrochemical methods (dry-and wet-transfers using graphene grown on Pt foils) are used from this point onwards to do a close study concerning the electrolytes and their influence in the transfer process. In spite of the big advantage of the dry-transfer over the wet-transfer, it is a method that often fails in retaining the macroscopic structural in-tegrity of graphene (i.e., broken and scrolled graphene is usually present) mainly due the bad adhesion between graphene and the target substrate, later discussed. Nevertheless, a dry-transfer was done first to give an idea about the natural delamination of graphene (by the aid of the mechanical force or not). Then, if it was indeed a natural process the wet-transfer was done resulting in a more uniform, undamaged transferred graphene. All the remaining conditions were maintained the same throughout the experiments so it could not affect the results, such as:
• The target substrate was always a silicon/silicon dioxide (Si/SiO2) wafer, pretreated with NH4OH: H2O2: H2O (see AppendixA);
• The support layer used was alwayspolycarbonate (PC)(see AppendixB);
• All the electrolytes had a concentration of 0.2 M in 1L of H2O.
This discussion will be divided in two main approaches:
1. Sample as cathode: where the cations are attracted to the negatively charged elec-trode, like represented in Figures2.3and2.4;
2. Sample as anode: where the anions are attracted to the positively charged electrode.
3.3.1 Sample as cathode
The following electrolytes were used: NaOH, sodium nitrate (NaNO3), sodium sulfate
(Na2SO4), potassium sulfate (K2SO4), sulfuric acid (H2SO4), cerium sulfate (Ce(SO4)2),
nitric acid (HNO3), ammonium hydroxide (NH4OH), tetramethylammonium hydroxide
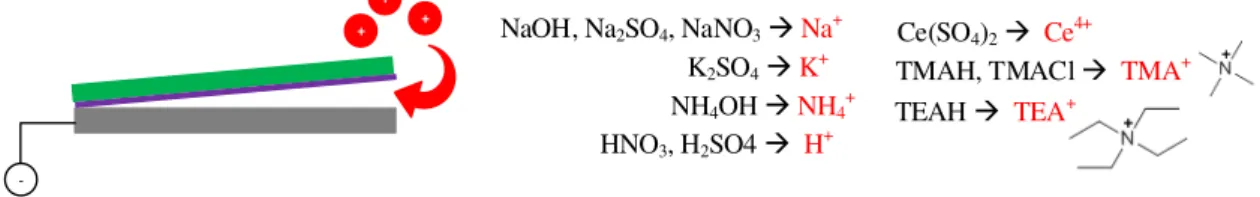
and chloride (TMAH and TMACl) and tetraethylammonium hydroxide (TEAH). Fig-ure 3.3 shows them with the respective cation that is being attracted to the interface. Note again that all these electrolytes are conductive and adequate for the process of electrolysis.
+
+ + NaOH, Na2SO4, NaNO3Na+
K2SO4K+
HNO3, H2SO4 H+
NH4OH NH4+
Ce(SO4)2 Ce4+
TMAH, TMACl TMA+
TEAH TEA+
-Figure 3.3:Cations of an electrolyte being attracted by the electrode (cathode). The cations of each electrolyte are marked in red.
C H A P T E R 3 . R E S U LT S A N D D I S C U S S I O N
With NaOH, TMAH and TEAH the delamination of graphene in the dry-transfer is completely smooth where it is just needed to pick-up thePDMSfrom the solution after 3 minutes of electrolysis at -2.5 V. Although it shows a very natural delamination, the transferred graphene appears broken and scrolled with the presence of a lot of cracks. This happens mainly due the bad adhesion between graphene and the substrate, since during the removal of the polymer the solvent intercalates under the graphene (between the treated target substrate and the sheet of graphene) and removes it [73–75]. This situa-tion happens more frequently when it is done the dry-transfer because of the applicasitua-tion and removal of thePDMS: air bubbles trapped in between the surfaces and/or too much stress applied when transferring the stack to the treated target substrate might crack the polymer/graphene and promote solvent intercalation. In contrast, the wet-transfer does not need assistance reflecting in much better results (no/few cracks and uniform graphene) since the delamination is very smooth, fast and with the same potential applied (see figs.3.4ato3.4c). The Raman spectra reveals a high-quality graphene (low ID/IG peak ratio) withFWHMvalues corresponding to a not so smooth high-quality graphene.
(a) (b) (c)
1500 1800 2100 2400 2700 0 500 1000 1500 2000 2500 2D G
ID / IG
(0.023) In te n s it y ( a .u .)
Raman shift (cm-1
)
FWMH (42.4 cm-1
)
D
(d)
1500 1800 2100 2400 2700 0 1600 3200 4800 6400 8000 In te n s it y ( a .u .)
Raman shift (cm-1
)
D G
2D ID/IG
(0.013)
FWHM (52.9 cm-1)
(e)
1500 1800 2100 2400 2700 0 2000 4000 6000 8000 10000 FWHM (37.8 cm-1
) 2D G In te n s it y ( a .u .)
Raman shift (cm-1) D
ID/IG
(0.006)
(f)
Figure 3.4:Optical microscopy images after a wet graphene transfer with (a) NaOH, (b) TMAH and (c) TEAH and their respective (d, e, f) Raman spectra measured in four different points.
The same results are produced with NaNO3, Na2SO4, K2SO4, and TMACl (
Fig-ures3.5ato3.5cand3.5g) for the dry- and wet-transfer even though the delamination is longer than with the first electrolytes discussed. Regarding the quality of graphene, all the Raman spectra present a low ID/IGpeak ratio (< 5%) proving a high-quality graphene
although with some strain variations related with highFWHMvalues.
When trying the electrochemical method with the remaining electrolytes, delamina-tion gets more complicated. For H2SO4, HNO3and NH4OH it was a difficult delamina-tion in the dry-transfer where thePDMShad to be pulled with some mechanical strength
3 . 3 . E L E C T R O LY T E S T U DY
(a) (b) (c)
1500 1800 2100 2400 2700
0 1500 3000 4500 6000 7500 FWMH (41.9 cm-1)
2D G
ID / IG
(0.044) In te n s it y ( a .u .)
Raman shift (cm-1)
D
(d)
1500 1800 2100 2400 2700
0 7000 14000 21000 28000 35000 FWMH (48.4 cm-1) G
2D ID / IG
(0.026) In te n s it y ( a .u .)
Raman shift (cm-1) D
(e)
1500 1800 2100 2400 2700 0 1200 2400 3600 4800 6000 In te n s it y ( a .u .)
Raman shift (cm-1
)
D G
2D
ID/IG
(0.012)
FWHM (45.3 cm-1)
(f)
(g)
1500 1800 2100 2400 2700 0 2500 5000 7500 10000 12500 In te n s it y ( a .u .)
Raman shift (cm-1)
D G
2D
ID/IG
(0.014) FWHM (39.3 cm-1)
(h)
Figure 3.5:Optical microscopy images after a wet graphene transfer with (a) NaNO3, (b) Na2SO4,
(c) K2SO4and (g) TMACl and their respective (d, e, f, h) Raman spectra measured in four different
points.
in order to detach thePDMSand stack from the platinum foil. This auxiliary force tell us that the delamination is very slow and non-natural and thus, these electrolytes are not adequate for delaminating graphene. Regarding Ce(SO4)2, it was diluted in 0.2 M of H2SO4 because it did not dissolve well only in water. With it, the stack/PDMSdid not
separate at all from the Pt foil while at the same time cerium ion was precipitating around the cathode. Then, the wet-transfer was done for all these electrolytes but without success proving the assumed logic: when the dry-transfer is not a natural process the wet-transfer will not work.
These results show that not only the hydrogen bubbles are important to the delami-nation of the stack but also the type of cation that is attracted to the interface. Sodium, potassium, tetramethylammonium and tetraethylammonium ions appear to be helping further water intercalation through the interface (and therefore helping the delamination of the stack) while ammonia, hydrogen and cerium ions do not. In this matter, Na+,
K+, TMA+and TEA+appear to reach the cathode without reacting, they intercalate be-tween the platinum and the stack spreading them and helping the delamination. On
C H A P T E R 3 . R E S U LT S A N D D I S C U S S I O N
the contrary, NH4+(eq.3.1), H+(eq.3.2) and Ce4+(eq.3.3) are reduced as soon as they
reach the electrode (cathode) and are not helping the delamination at all. Although Ce4+
reduces to Ce3+, this ion still will not intercalate in between graphene and platinum be-cause it exceeds its solubility limit and starts to precipitate as Ce2(SO4)3, not aiding the
delamination.
2 NH4OH (aq) + 2 e−−→2 NH
3(g) + H2(g) + 2 OH−(aq) (3.1)
2 H+(aq) + 2 e−−→H
2(g) (3.2)
Ce4+(aq) + e−−→Ce3+(aq) (3.3)
In order to have a better overview on which cations work with the electrochemical delamination, a mechanism based on theelectrochemical window (EW)of water is pro-posed. In this window, it is possible to clearly see a range between the potentials for water reduction and oxidation. Since the graphene is in the negative side (cathode) only the part where there are negative currents is relevant. Here, the reduction of water takes place and hydrogen bubbles are produced only when a potential more negative than the onset potential of this reaction (reduction point) is applied. Different pH values in the solution means that there are different concentrations of [H+]/[OH–] ions available for the reaction, that will require different potentials (more or less) to start reacting. This relationship can be correlated with the Nernst equation that indicates the cell potential according to the pH of the solution, in this case being the potential to produce H2bubbles
depending on the pH of the electrolyte used. For acidic solutions the reduction point is around 0 V, for neutral solutions around -0.4 V and for alkaline solutions around -0.8 V (see AppendixCfor calculations). Figure3.6depicts that region of the waterEWwith all the cations involved. It is divided into two regions: the first (I) is where hydrogen bubbles are being produced after the reduction point (negative direction) and the second (II) where there are no water reduction (positive direction). The electrolytes that worked (with Na+and K+) are far to the left from the reduction point and the ones that did not (with H+, NH4+and Ce4+) are right at the border of it or far to the right from the
reduc-tion point. Meanwhile, TMA+and TEA+have a relatively low electroreductive reactivity,
and are thus expected to intercalate between graphene and the Pt foils because they will not react.
To assure that graphene delamination is successful, it is imperative that the cations have a low electroreductive reactivity (like TMA+and TEA+) or that they reduce at po-tentials more negative to the hydrogen evolution reaction (like Na+and K+), which
con-sequently means that is the water/hydrogen ion that is being reduced and not the cations. In other words, the reduction half-reaction needs to be outside of the EWso that the cations will not reduce, but the water will. For example, Na+has a reduction potential
of -2.7 V and H2O a reduction potential of -0.8 V (for alkaline solutions). Since the re-duction of water to hydrogen occurs at more positive potentials, it will accept electrons
3 . 3 . E L E C T R O LY T E S T U DY 0 -0.4 -2.8 Potential vs SHE (V) Current (A) -0.8 -3 1.4
pH = 1
pH = 7 pH = 13 Reduction
half-reaction pH = 1
pH = 7 pH = 13 Reduction
half-reaction
I II
Figure 3.6:Zoom in of the reduction area in a water electrochemical window with the cations of the electrolytes used represented according to their reduction potential. The regions will shift according to the reduction point.
more easily and will reduce first. This will “block” Na+reduction, not reacting with the electrode and therefore helping the intercalation. In contrast, Ce4+ is at 1.4 V against
0.0 V (for acidic solutions) of H+ which implies that cerium ion will react before the hydrogen ion. Moreover, as said before, Ce3+ will form a solid meaning that will not help the intercalation and thus the chosen electrolyte will not work. The same for H+
from H2SO4and HNO3, that reduces at the same time as the water reduction and only contributes for more production of hydrogen bubbles and not for the intercalation.
Until now the hydrogen bubbles were considered a determining factor for the success of the electrochemical method, an assumption that in fact is revealed incorrect and at its best only accelerates graphene delamination. As a matter of fact, with H2SO4 and HNO3the H+is reduced to H
2and therefore more hydrogen bubbles are being produced
and the delamination still does not work. It is also important to emphasize that the cell potential was always set at -2.5 V (overpotential), being enough potential to overcome the various activation barriers and reduce the water. Furthermore, the mechanism used was a two-electrode setup, which does not fully control the exact values of the potentials. The values given in theEW(the calculated ones) are always vsstandard hydrogen electrode (SHE)and thus the cell potential cannot be represented in theEW. The hydrogen bubbles produced follows different reactions depending on the pH of the solution, following the chemical eq. (2.1) for alkaline electrolytes, eq. (2.4) for acidic and a combination of the two for neutral pH.
3.3.2 Sample as anode
To obtain process optimization it is important to find other ions that also intercalate between the interface of platinum/graphene and drive the delamination forward, as good as Na+ does. In the following experiments, the polarity has been changed to attract
C H A P T E R 3 . R E S U LT S A N D D I S C U S S I O N
negatively charged anions to a positively charged anode. The electrolytes used were some of the ones used in the cathode configuration with a few more added: sodium chloride (NaCl) and sodium sulfite (Na2SO3). Figure3.7shows them with the respective anion that is being attracted to the interface.
-- - NaOH, TMAH, TEAH, NH
4OH OH
-Na2SO4, K2SO4, H2SO4 SO4
2-NaNO3, HNO3NO3
-Na2SO3 SO3
2-NaCl, TMACl Cl
-+
Figure 3.7:Anions of an electrolyte being attracted by the electrode (anode). The anions of each electrolyte are marked in black.
Electrolytes such as NaNO3, HNO3, Na2SO4, K2SO4and H2SO4worked in the dry--transfer requiring a soft pull in thePDMSto help the delamination. Once again, there is
some evidence that the type of ion that is in the interface (in this case nitrate and sulfate ion) matters to the delamination of the stack since electrolytes that did not work before in the cathode setup (HNO3and H2SO4) are now working. Nevertheless, it is important to note that it was still a pull in thePDMS(soft or hard) predicting a hard wet-transfer. Indeed, the wet-transfer worked but it had to be assisted by a tweezer (by pulling the corners and the parts that got stuck), contributing to a long non-natural delamination and the probability of defecting the graphene. Additionally, the voltage had to be increased from 2.5 V to 4 V in order to start peeling the corners of the stack. The same results
are produced with TMACl and NaCl. Figure3.8 shows the optical microscope images
and the Raman characterization for each wet-transfer. A uniform and wrinkled graphene was obtained with a presence of some cracks probably due the harsh handling while doing the delamination. The Raman spectra reveals large strain variations for some of them (not for K2SO4and TMACl) indicated by the highFWHMalthough it shows a low
ID/IG peak ratio (< 6%). A particular note to3.8fthat shows a highly defective graphene (ID/IG = 51%) although the optical microscopy image does not show major defects. This example perfectly demonstrates why is so important to combine different characterization techniques when studying graphene. The high D peak was originated during the transfer probably due the severe handling (pulling the corners, etc.), stressing the importance of a free/minimal handling during graphene transfer.
The electrolytes that did not work were NaOH, NH4OH, TMAH and TEAH. Likewise, it is believed that as soon as the hydroxide ion reaches the electrode (anode) it oxidizes into O2according to eq. (2.2) not contributing to the delamination. This does not happen for the electrolytes with SO42 – and NO3– ions. The waterEWlogic was again applied, this time for water oxidation since graphene is connected to the positive side (anode) and the relevant current values are now positive. In this case, oxygen bubbles are produced instead of hydrogen at the adequate potential (oxidation point). For the same reasons explained before, the oxidation potential will depend on the pH of the electrolyte. For
3 . 3 . E L E C T R O LY T E S T U DY
(a) (b) (c)
1500 1800 2100 2400 2700 0 1200 2400 3600 4800 6000 FWHM (43.5 cm-1
)
2D G
ID / IG
(0.015) In te n s it y ( u .a )
Raman shift (cm-1
) D
(d)
1500 1800 2100 2400 2700
0 4500 9000 13500 18000 22500 FWHM (49.4 cm-1)
2D G
ID / IG (0.037) In te n s it y ( a .u .)
Raman shift (cm-1 ) D
(e)
1500 1800 2100 2400 2700
0 3500 7000 10500 14000 17500 2D G FWHM (52.5 cm-1
) ID / IG
(0.51) In te n s it y ( a .u .)
Raman shift (cm-1) D
(f)
(g) (h) (i)
1500 1800 2100 2400 2700 0 1500 3000 4500 6000 7500 FWHM (34.4 cm-1
) 2D G In te n s it y ( a .u .)
Raman shift (cm-1) D
ID/IG
(0.026)
(j)
1500 1800 2100 2400 2700 0 1200 2400 3600 4800 6000 In te n s it y ( a .u .)
Raman shift (cm-1
)
D G
2D ID/IG
(0.014)
FWHM (44.7 cm-1)
(k)
1500 1800 2100 2400 2700 0 1500 3000 4500 6000 7500 FWHM (36.3 cm-1)
In te n s it y ( a .u .)
Raman shift (cm-1
)
D G
2D
ID/IG
(0.055)
(l)
Figure 3.8:Optical microscopy images after a wet graphene transfer with (a) HNO3, (b) NaNO3,
(c) Na2SO4, (g) K2SO4, (h) TMACl and (i) NaCl and their respective (d, e, f, j, k, l) Raman spectra measured in four different points.
![Figure 2.1: A process flow chart of graphene synthesis. From [18].](https://thumb-eu.123doks.com/thumbv2/123dok_br/16698145.743905/31.892.131.764.868.1122/figure-process-flow-chart-graphene-synthesis.webp)