v.13, n.4, p.369–375, 2009
Campina Grande, PB, UAEA/UFCG – http://www.agriambi.com.br Protocolo 152.07 – 27/09/2007 • Aprovado em 15/12/2008
Comparison of methodologies for automatic generation of limits
and drainage networks for hidrographic basins
1
Samantha A. Alcaraz2,Christophe Sannier3, Antonio C. T. Vitorino4 & O mar D aniel4
ABSTRACT
The objective of this work was to compare methodologies for the automatic generation of limits and drainage networks, using a geographical information system for basins of low relief variation, such as the Dourados catchment area. Various data/processes were assessed, especially the ArcHydro and AVSWAT interfaces used to process 50 m resoluti-on DTM s formed from the interpolatiresoluti-on of digitalized cresoluti-ontour lines using ArcInfo, ArcView and Spring GIS, and a 90 m resolution SRTM DTM acquired by interferometry radar. Their accuracy was estimated based upon the pre-proces-sing of small basic sub-basin units of different relief variations, before applying the best combinations to the entire Dourados basin. The accuracy of the automatic stream network generation and watershed delineation depends essen-tially on the quality of the raw digital terrain model. The selection of the most suitable one then depends completely on the aims of the user and on the work scale.
Key words: watershed, catchment, geographic information systems
Comparação entre metodologias para geração automática de
limites e redes de drenagem em bacia hidrográfica
R E S U M O
Propôs-se, neste trabalho comparar metodologias para geração automática de limites e de redes de drenagem superficial na bacia hidrográfica do Rio Dourados, com baixa variação de relevo, usando-se sistemas de informações geográficas. Várias associações dados/processos foram testados, dentre os quais as interfaces ArcHydro e AVSWAT, usadas para processar DTMs com resolução de 50 m formados pela interpolação de linhas de contorno digitalizadas através de ArcInfo, ArcView e SPRING e DTMs com 90 m de resolução aplicadas ao SRTM, adquiridas por radar. Estudou-se a precisão com base no processamento de pequenas bacias de diferentes variações de relevo, antes de se aplicar a melhor combinação para toda a bacia do Rio Dourados. A precisão da geração automática da rede de drenagem e a delineação dos divisores de água da bacia, dependeram essencialmente da qualidade da formação das grades nos DTMs. A seleção da melhor combinação dados/processos depende, então, dos objetivos do usuário e da escala de trabalho.
Palavras-chave: divisor de águas, bacias hidrográficas, sistemas de informações geográficas
1 Part of the MSc Thesis of first author presented to Cranfield University at Silsoe
2 MSc student at Cranfield U niversity, Silsoe, Bedfordshire MK43 0AL, U K, United Kingdon, [email protected] 3 Department of Natural Resources Cranfield University, Cranfield, Bedfordshire MK43 0AL, UK, [email protected]
INTRODUCTION
The state of Mato Grosso do Sul in Brazil is subdivided into two main hydrological basins, drained respectively by the Paraguay and the Paraná rivers which flow from the
highlands of central Brazil to Argentina. The Paraná is one of the ten largest rivers of the world with a drainage area of 2,830,103 km², with one part coming from the Dourados catchment area estimated to be 9,205.41 km² (Mato Grosso do Sul, 2000).
The Dourados river is regionally of great importance as it is the main supplier of water used for human consumpti-on in Mato Grosso do Sul. To maintain the water quality, especially in this area of intensive farming, environmental and natural resource management are necessary. Usually, hydrographic basins are considered as the most basic unit of monitoring, analysis and management, and initially need to be delineated to define a spatial elementary area of study (Ribeiro et al., 2005).
Original attempts to link geographic information systems to hydrologic models began in the mid 1970s (Correia et al., 1998). These hydrological models require a detailed defini-tion of a watershed´s internal drainage structure (Turcotte et al., 2001). However, it was not until the early 1990s that hydrology really took advantage of this technology to enable the development of GIS and hydrological model interfaces that provide watershed delineation capabilities.
The recent expansion of digital representation has stimu-lated the development of automatic procedures to extract to-pographic and hydrologic information from Digital Terrain Model input, using GIS and hydrologic models that integra-te multiple databases within a minimal time. Currently, se-veral studies have been conducted using the tools of GIS in hydrographic basins (Campos et al., 2004; Lopes et al., 2007; Ribeiro & Campos, 2007), including for its delineation (Leão et al., 2004). However, until now the delineation of the Dou-rados basin was made manually from contour lines in topo-graphical maps or from aerial photo-interpretation.
The aim of this work was to compare methodologies for automatic generation of limits and drainage network, for the Dourados river basin, using a geographical information sys-tem.
MATERIAL AND METHODS
Different processes using different data sources were com-pared to identify which combination was the most accurate and suitable for the Dourados basin area. The procedures to be compared were ArcHydro, a hydrologic application in-terface of ArcGIS, and AVSWAT, a hydrologic model within ArcView. The potential of the Brazilian GIS SPRING for hydrographic study has also been assessed. To analyse and evaluate their accuracy in detail, the procedures were first applied to four selected small subwatersheds of different re-lief variations, to minimize the processing time and underli-ne the influence of topography on their accuracy.
Dourados hydrographic basin
The Dourados hydrographic basin lies between latitude S 21° 56’ 37’’ 22° 38’ 06’’ and longitude W 53° 59’ 57’’ -55° 57’ 26’’, in the south of the Mato Grosso do Sul state in Central-West Brazil. The basin covers 11 municipal districts, comprising more than 300,000 inhabitants, which concen-trate economical activities of high pollution, such as inten-sive farming projects. The agricultural development is im-portant due to fertile soils, gentle slope and appropriate climate, but it is also altering the natural characteristics of the vegetation patterns, originally steppe-savannah, savannah and semi-deciduous seasonal forest (Carneiro et al., 2006).
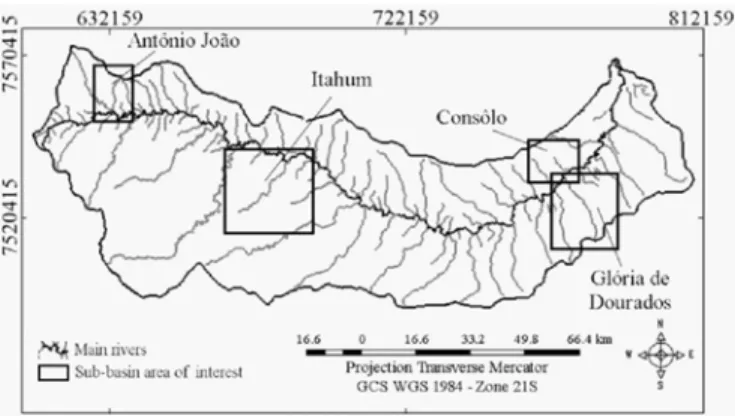
The main river of the basin is the Rio Dourados that ori-ginates in the Serra de Maracaju, at an altitude of 700 m, near the town of Antonio João (Figure1). It evolves along 370 km from west to east until joining the Rio Brilhante river, a tributary of the Rio Ivinhema that joins the main Rio Para-ná river, one of the largest rivers of South America. The Dourados river is itself navigable from Porto Mercedes, for about 50 km until reaching the Brilhante river (Figure 1).
To fulfill the objectives of this work, four sub-basins were selected within the overall Dourados drainage area (Figure 1), according to their different topographic properties:
• Moderate relief variation in the area of Antonio João ‘Córrego Paraiso’ river was selected. It is almost 15 km long and numerous tributaries appear in the upstream area. • Low relief variation in the areas of Itahum and Gória de Dourados
‘Córrego Tronqueira’ and ‘Córrego Estiva’ rivers were selected in the area of Itahum. They are located in the mi-ddle of the Dourados hydrographic basin. They are about 25 km long, and evolve in an area of regular and gentle slope until reaching the narrow valley bottom of the Dourados ri-ver.
‘Córrego das Moças’ was chosen to represent the sub-ba-sin of Gloria de Dourados. It is located in the south-downs-tream area of the whole catchment, where the Dourados val-ley is wider and flatter than in the Itahum area. The river is about 25 km long and is surrounded by swamps and ponds, especially when reaching the valley bottom.
‘Córrego Consolo’ was selected in the north and downstre-am area of the Dourados catchment. It is a short river of 8 km draining a small area of very gentle slope. Swamps are well developed from the higher part of the sub-basin to the large and flat valley bottom at the junction with the Dourados river.
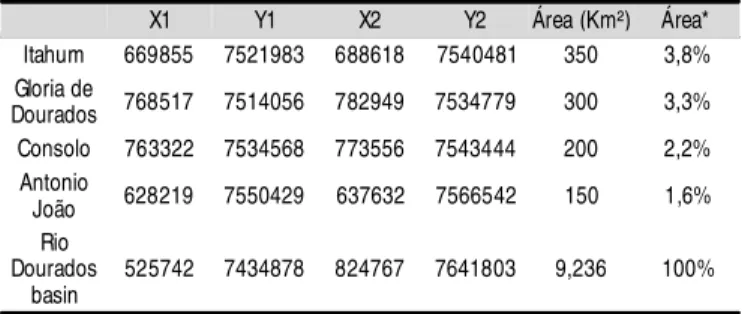
The coordinates of the area of interest considered in each case are provided on Table 1.
Watershed delineation using GIS
Techniques for automated watershed delineation have been available since the mid-eighties and have been im-plemented in various GIS systems and custom applicati-ons (Garbrecht & Martz, 1999). On the whole, automatic delineations follow a similar scheme, including the determi-nation of flow direction and accumulation, the derivation and ordering of drainage network and finally the delineation of the watershed (Jenson, 1991).
Principle methodology
Pre-processing of the DTM
The original Digital Terrain Model (DTM) used as an input had to be processed in order to identify and eli-minate the terrain depressions where the water could be tra-pped and where flow direction could not be defined. This automatic process of filling the sinks uses a function that identifies the pits and raised the terrain in order to have a smoother surface and let the water flow freely without for-ming ponds (Jenson, 1991). All comparison was made with original data, where the Dourados basin outline was esti-mated from aerial photography interpretation, the hydrogra-phic network digitized from the topograhydrogra-phic maps and the contour lines and spot points altimetric values.
Maidment (1996) suggested a variation to the DTM pre-processing method. Since critical errors might occur when only using the DTM to define the drainage network, especi-ally in areas of low relief or using low resolution grids, he recommended using the filled DTM in conjunction with a mapped representation of the stream network. The channels of interest, the Dourados river and a portion of the main stre-am in each sub-basin, were automatically converted into a grid and burned into the DTM by adding a constant value to all non-stream cells, while maintaining the elevation of the stream cells.
From the pre-processed DTM, a flow direction grid was generated (Jenson & Domingue, 1988). Based on local flow direction, the flow accumulation was used to generate a drai-nage network. The flow accumulation grid was used to defi-ne the drainage defi-network. This threshold provides the contri-buting source area (CSA) that represented the minimum support area required for a channel to form. After testing a wide range of values, a CSA of 2 km² appeared to be the most suitable for the area of interest.
From the previous network a stream link grid was cre-ated and based on the links grid and on the flow direction grid, one watershed per stream link was created (Jenson & Domingue, 1988) and the grids of stream links and catch-ment delineation were finally vectorized to generate stre-am line and watershed polygon datasets. The progrstre-am was then able to automatically generate the corresponding ca-tchment boundary.
GIS software and hydrologic models
In this work three systems were considered:
Available in ArcInfo
ArcHydro is an ArcGIS-based system geared to support water resource applications integrating spatial and tem-poral data. Terrain pre-processing and watershed proces-sing implement the different steps, leading to the water-shed delineation as detailed in (ESRI, 2007).
Available in ArcView 3.x
AVSWAT 2000 is a complete pre-processor, interface and post-processor of the hydrological model SWAT - Soil and Water Assessment Tool. The first component of the interface is the procedure to delineate watersheds, as detailed in (Di Luzio et al., 2002; 2004).
GIS widely used in Brazil
SPRING (Sistema para Processamento de Informações Georeferenciadas) is a free GIS and image processing sof-tware created by the INPE (Instituto Nacional de Pesquisas Espaciais) and commonly used in Brazil. It is not associated with any hydrologic model but offers some hydrologic analy-sis options (Camara et al., 1996).
Digital terrain model procurement
The main input data for the processing of watershed deli-neation and the extraction of morphometric information are Digital Terrain Models. Two kinds of DTM were used:
1) DTMs created from the contour lines and spot height data sources. Using GIS, the features have been rasterised to 50 m resolution grids:
- Workstation-DTM: was generated by the TOPOGRID software in Arc/Info to produce the final surface elevation model. TOPOGRID is an interpolation method, specifically designed to create hydrologically correct DTMs from eleva-tion data and stream networks (ESRI, 2007).
- ArcView-DTM: a Triangulated Irregular Network (TIN) had to be created from the elevation data before being
con-X1 Y1 X2 Y2 Área (Km²) Área*
Itahum 669855 7521983 688618 7540481 350 3,8% Gloria de
Dourados 768517 7514056 782949 7534779 300 3,3% Consolo 763322 7534568 773556 7543444 200 2,2% Antonio
João 628219 7550429 637632 7566542 150 1,6%
Rio Dourados
basin 525742 7434878 824767 7641803 9,236 100%
verted into a grid. ArcView does not have a direct interpola-tion grid available to form a DTM from vector layers.
- Spring-DTM: Spring presents functions of interpolati-on to create a grid from feature data source. One DTM was generated by using a nearest neighbour interpolation. Then, trying to improve its quality, the equidistant curves have been interpolated from 40 to 20 m intervals and a second DTM was produced using an inverse distance weighting interpo-lation from spot height and contour lines.
2) a DTM delivered by the Shuttle Radar Topography Mis-sion (SRTM) and acquired from the USGS website. The ele-vation information was obtained from interferometry: it requi-res simultaneous or repeated signal acquisitions by synthetic-aperture mapping radar systems, which were onboard Space Shuttle Endeavour during a 10 day mission in 2000 to image about 80% of the Earth’s surface. Those data are une-dited and are intended for scientific use and evaluation (NASA, 2007). One DTM product was available covering the south area of Mato Grosso do Sul, including the Dourados basin area and was freely downloadable for a grid resolution of 90 m.
Watershed delineation
Each DTM has been processed within ArcHydro and/or AVSWAT for the four subwatersheds area. Unfortunately, Spring could not be used directly to create watershed deline-ation. Indeed, SPRING offers an hydrological option to cre-ate flow direction, flow accumulation grid and stream ne-twork generation, but no more options for watershed delineation. The two first grids were created (a time consu-ming process) and used to create the stream network.
However, the process only generated a grid of gradients without any physical significance. Trying to clarify the pro-blem, the flow direction and flow accumulation grid were then directly entered within the ArcHydro at the adequate
steps. The resulting streams network and watershed delinea-tion where also not valid. Both results illustrated that the Spring generation process of flow direction and flow accumu-lation contained errors and could not be used in any procedu-res and that only the raw DTMs could be of inteprocedu-rest for fur-ther analysis. They were incorporated in the previous programs to be processed. However, it was impossible, with the data obtained in this work, to define the true cause of this problem with Spring, because comparisons were not carried out between digital elevation grids, that probably put errors in the analy-sis. Hancock (2005) explains that some geomorphic descrip-tors were shown to be sensitive to digital elevation model grid scale, for example the cumulative area distribution.
RESULTS AND DISCUSSION
The watershed outlines were compared for each area of interest using the Workstation DTM as a background, plus 10 m contours lines derived from it. As this DTM was con-sidered as topographing then each delineation process were also compared to quantify the differences (Figure 2).
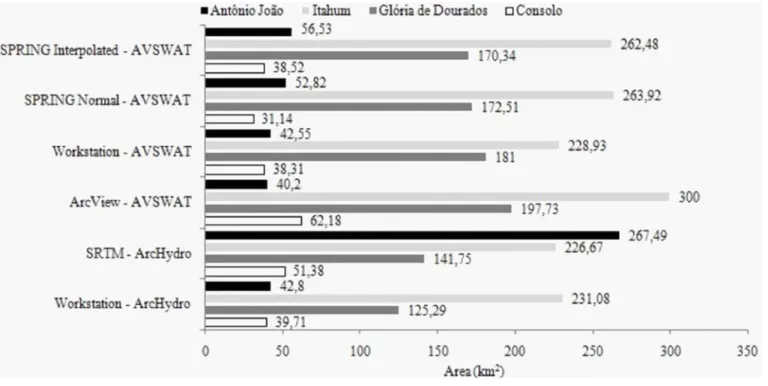
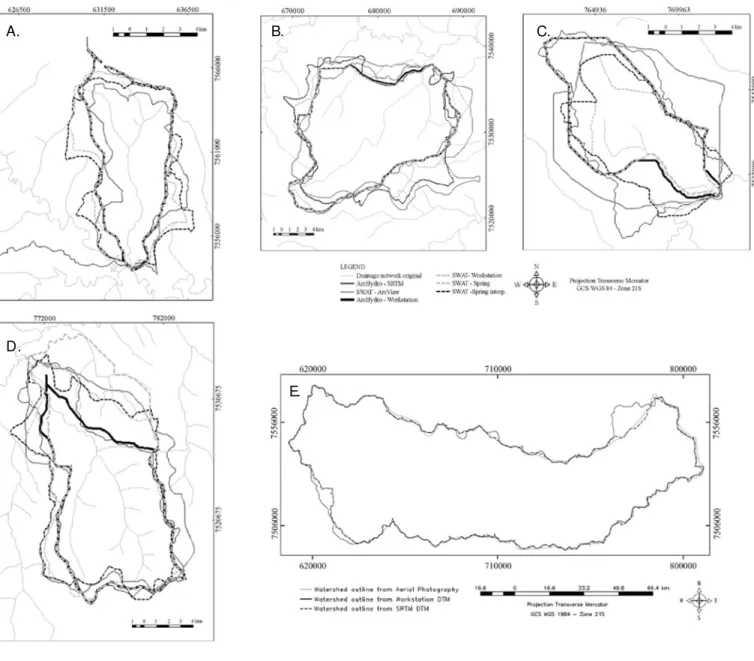
In the area of greatest relief variation, in the Antonio João sub-basin (Figure 3a), the results provided by the DTM Workstation match exactly the outline expectation according to the 10 m contour lines when processed by ArcHydro and by SWAT. On the other hand, an error of junction occurred in the drainage generation of the SRTM, increasing the drai-nage area (Figure 2) and inducing a total mismatch of the boundary on the western side of the catchment area accor-ding to the location of the outlet point. Spring DTM and ArcView DTM outputs, even if they are correct according to their own DTMs, do not concur with the previous results.
Within the area of intermediate relief variation in the Itahum sub-basin (Figure 3b), the outputs of the processes
cHydro, Workstation-ArcHydro and Workstation- AVSWAT are of very good quality. They accurately delineate the boundary of the subwatershed and revealed comparable areas for the sub-watershed generated: 226.67 km² for the SRTM, 228.93 km² and 231.08 km² for the Workstation DTM (Figure 2). The three remaining outputs display irregular boundaries that do not ma-tch the topographic variation of the Workstation DTM ba-ckground and present a high drainage area.
In the area of Gloria de Dourados (Figure 3c), the drainage generation of the DTM Workstation is incorrect, with both pro-cedures in the flattest area of the valley bottom. On the other hand, the SRTM output fits well the DTM variation and the drainage is well represented. The Spring methodology does not give a re-alistic stream network, nevertheless the boundary of the drainage area is quite accurate. The ArcView DTM output is also correct, but the eastern boundary is a little shifted.
Within the sub-watershed of Consolo (Figure 3d), in the area of very low relief variation, the drainage generation is only correct for the SRTM DTM processed by ArcHydro. The
streams generated by ArcHydro and AVSWAT for the Works-tation DTM are erroneous in the flat valley bottom, where the Dourados river pattern is not respected. Errors are even worse for the stream network generated from the ArcView and Spring DTM.
In this area, the results of the sub-watershed delineation are correct for the DTMs Workstation and SRTM, in accor-dance with their own characteristics. Nevertheless, a diffe-rence is clearly visible between both DTMs. The one from Workstation one contains an error clearly evident when com-pared with the original drainage network, close upstream of the sub basin outlet. The valley of the Consolo river is shif-ted towards the north, inducing the creation of an unreal stre-am, and modifying the western shape of the Consolo basin as this one is still rightly located because of the burn-in pro-cess. The SRTM stream network is accurate in comparison with the original, and also has suitable watershed delineati-on. To facilitate the visualization for this comparison, this DTM was used as the background.
Figure 3. Antonio João (a), Itahum (b), Consolo (c) and Glória de Dourados (d) sub-watershed and Dourados (e) basin delineation comparison
A. B. C.
D.
According to the objectives, the best combination Data Source/Automatic Process had to be applied to the entire Dourados basin. The results illustrated that the best fitting watershed delineations were obtained from the SRTM-DTM and the Workstation-DTM, using respectively ArcHydro and ArcHydro or AVSWAT. ArcHydro was then used to process both of these DTMs for the entire Dourados basin to finally compare which one was the most suitable (Figure 3e).
The drainage network generated from the Workstation DTM is globally of good quality, but looking at the details, a lot of inaccuracies and errors are present in the downstre-am area. Nevertheless, the basin delineation derived from this network is very good at the scale of the basin.
The drainage network generated from the SRTM is exce-llent, globally and in details, in the upstream as well as in the downstream areas. The watershed generated follows exac-tly the basin boundary created from aerial photography in-terpretation used as a reference, including even more details.
Watershed delineation discussion
It was observed that, for the same data source (DTM-Workstation), the procedures outputs did not vary between ArcHydro and AVSWAT, whatever the relief variation within the area of interest. The outputs presented the same range of quality: better when there was some relief variation, and poorer in the flattest area. This similarity is explained by the fact that both processes use the same standard methodology, based on the eight-pour point algorithm (Jenson & Domin-gue, 1988). The quality of the stream branches is controlled by the user specified threshold on contributing area. It was estimated to be 2 km² in the area of Dourados for the drai-nage network, automatically created to fit as accurately as possible the original network used as a reference.
The choice of using one process or the other is then mainly constrained by user aims, taking into account the ad-vantages and disadad-vantages of both of them. AVSWAT is more independent of the user than ArcHydro. AVSWAT also allows the user to focus on an area of interest, which consi-derably reduces the time of processing.
If not from the procedure, the variability between the re-sults comes from the source resolution and the spatial reso-lution of the data profiles. But, if a better resoreso-lution reduces the amount of errors, it also considerably increases the time of processing and the file size. The right balance must be found between a sufficient level of data quality (depending on the work scale) and an adequate processing time.
The ArcView DTM always generated inaccurate draina-ge networks and watershed delineation due to the inadequa-cy of the creation of the DTM itself. ArcView takes in ac-count only the contour lines or the spot points to construct firstly a TIN and then convert it into a grid. It creates an irregular landform made of successive flat steps that do not accommodate the progressive relief variation.
Results given by the Spring DTM were of intermediate quality. They are better than the one by ArcView, but not as good as the SRTM and Workstation ones. Two DTMs were created in Spring, and the results illustrated that the inter-polated DTM was not as good as the original one. The
stre-am network generated was, in both cases, erroneous and not realistic, whatever the sub-basin considered.
In the Antonio João area the best results were provided by the DTM Workstation. Nevertheless, the northern boun-dary of the sub-basin formed a very acute angle to reach the highest point that does not seem natural. Improvement could be achieved using a better grid resolution. In this area, the SRTM results were not reliable: the western watershed boun-dary was totally out of bounds because of an error in the drainage network in an area which was highly meandering. Within the area of Itahum, both SRTM and Workstation DTMs gave comparable results of very good quality. Never-theless, the drainage generation was better for the SRTM analysis, as the channel pattern was not always respected within the Workstation outputs.
In the basin of Gloria de Dourados, where there is an in-termediate relief variation in the upper part followed by a flat area when joining the Dourados river, the Workstation DTM was not adequate. The same observations were made within the very low relief variation area of Consolo. In ArcHydro, as well as in AVSWAT, the drainage generation was totally erroneous in the valley bottom, in spite of the burn-in opti-on available in both processes. The channel pattern was not respected, and instead of meanders the automatic procedu-res created straight segments of river. Moreover, in the area of Gloria de Dourados the outlet location was moved, and other channels were incorporated within the drainage area, inducing the overestimation of the sub-basin area. In the area of Consolo, the outlet location was not located on the main stream. As described, the DTM itself contains an er-ror in this area. The best procedure was, therefore, the SRTM one, with an accurate drainage network and suita-ble watershed delineation.
Both DTMs of respectively 50 and 90 m grid resolutions are of very good quality and, surprisingly, the SRTM one of poorer resolution seems even more adequate for the sub-ba-sins (except for a local error in the upstream area) but also to the Dourados basin scale (Figure 3e). The accuracy of the DTM is then not only due to the resolution grid but also on the process of creation. The SRTM DTM was generated from radar interferometry to extract the terrain information. With a 90 m resolution grid, it is as good as, and even better than, a 50 m grid DTM created from topographic contours lines of 40 m space intervals.
CONCLUSIONS
1.The accuracy of the automatic stream network genera-tion and watershed delineagenera-tion depends essentially on the quality of the raw digital terrain model. The selection of the most suitable one then depends completely on the user aims and on the work scale.
flat areas, some precaution can still be undertaken when using automatic procedures.
3.The radar technology of the SRTM generates excellent DTM that appear suitable for hydrologic analyses, which was shown to be accurate enough and suitable for a basin of the Dourados dimensions. It allows the fast, precise and repro-ducible automatic processing from the acquisition of the data to the output generation.
LITERATURE CITED
Camara, G.; Souza, R. C. M.; Freitas, U. M.; Garrido, J.; Mitsuo, F. I. SPRING: Integrating remote sensing and GIS by object-ori-ented data modelling Computers & Graphics, v.20, n.3, p.395-403, 1996.
Campos, S.; Araújo Júnior, A. A.; Barros, Z. X.; Cardoso, L. G.; Pi-roli, E. L. Sensoriamento remoto e geoprocessamento aplicados ao uso da terra em microbacias hidrográficas, Botucatu – SP. Engenharia Agrícola, v.24, n.2, p.431-435, 2004.
Carneiro, M. A.; Daniel, O.; Vitorino, A. C. T.; Comunello, E. Ap-tidão da Bacia do Rio Dourados para algumas espécies de eu-caliptos. Floresta, v.36, n.3, p.331-342, 2006.
Correia, F. N.; Rego, F. C.; Saraiva, M. da G.; Ramos, I. Coupling GIS with hydrologic and hydraulic flood modeling. Water Re-sources Management, v.12, n.3, 229-249, 1998.
Di Luzio, M.; Srinivasan, R.; Arnold, J. G. A GIS-Coupled hydro-logical model system for the watershed assessment of agricul-tural nonpoint and point sources of pollution. Transactions in GIS, v.8, n.1, p.113-136, 2004.
Di Luzio, M.; Srinivasan, R.; Arnold, J. G.; Neitsch, S. L. Soil and water assessment tool. ArcView GIS Interface Manual: Versi-on 2000. GSWRL Report 02-03, BRC Report 02-07, Temple, College Station: Texas Water Resources Institute Publish, 2002. 346p.
ESRI - Environmental Systems Research Institute. ArcGis – Tu-torials. http://www.esri.com/software/arcgis/index.html. 30 Jul. 2007.
Garbrecht, J.; Martz L.W. Digital elevation model issues in water resources modeling. In: ESRI Users Conference, 19, 1999, San Diego. Proceedings...San Diego: ESRI, 1999. 866p.
Hancock, G. R. The use of digital elevation models in the identi-fication and characterization of catchments over different grid scales. Hydrological Processes, v.19, n.9, p.1727-1749, 2005. Jenson, S. K. Applications of hydrologic information automatically
extracted from digital elevation models. Hydrological Proces-ses, v.5, n.1, p.31-44, 1991.
Jenson, S. K.; Domingue, J. O. Extracting topographic structure from digital elevation data for geographical information system analysis. Photogrammetric Engineering and Remote Sensing, v.54, n.11, p.1593-1600, 1988.
Leão, R. A. O.; Teixeira, A. S.; Andrade, E. M.; Oliveira, F. Deli-mitação e caracterização automática de uma micro-bacia hidro-gráfica da Fazenda Experimental Vale Curu, Pentecoste – CE. Revista Ciência Agronômica, v.35, n.1, p.26-35, 2004. Lopes, F.; Merten, G. H.; Franzen, M.; Giassoni, E.; Helfer, F.;
Cy-bis, L. F. A. Utilização de P-Index em uma bacia hidrográfica através de técnicas de geoprocessamento. Revista Brasileira de Engenharia Agrícola e Ambiental, v.11, n.3, p.312–317, 2007. Maidment, D. R. GIS and Hydrologic Modelling - an Assessment
of Progress. In: International NCGIA Conference, 3/Workshop on Integrating GIS and Environmental Modelling, 1996, San-ta Fé, New México. Proceedings...SanSan-ta Fé: NCGIA, 1996. p.21-25.
Mato Grosso do Sul. Bacia hidrográfica do Rio Dourados: Diagnós-tico e implantação da rede básica de monitoramento da qualdi-dade das águas. Campo Grande: Secretaria de Estado de Meio Ambiente, FEMAP/MS, Coordenadoria de Recursos Hídricos e Qualidade Ambiental, 2000. 78p
NASA - National Aeronautics and Space Administration. Shuttle radar topography mission. http://www.jpl.nasa.gov/srtm, 30 Jul. 2007.
Ribeiro, C. A. A. S.; Soares, V. P.; Oliveira, A. M. S.; Gleriani, J. M. O desafio da delimitação de áreas de preservação permanen-te. Revista Árvore, v.29, n.2, p.203-212, 2005.
Ribeiro, F. L.; Campos, S. Vulnerabilidade à erosão do solo na re-gião do Alto Rio Pardo, Pardinho – SP. Revista Brasileira de Engenharia Agrícola e Ambiental, v.11, n.6, p.628–636, 2007. Turcotte, R.; Fortin, J. P.; Rousseau, A. N. ; Massicotte, S.;