Studies of the vegetation
of a white-sand black-water igapó (Rio Negro, Brazil)
lNTRODUCTION
Since Takeuchi's preliminary investigation (1962), there h2ve not been any detailed studies dealing with the vegotation structure ot central amazonian igapós. The forests studied by Bluck
et a/.
(1950) near Rio Guamá and by Pires and Prance ( 1977) in the Catú Reserve (both in the vicinity of Belém). thouJh termed igapós, are in fact white-water várzea forests. Similarly, in his paper on igapó forests along the Rio Negro and its tnbutaries, Takeuchi treated the mixed water várzeas of Lago Janauacá as igapós. To a great extent. this confusion is the re.suit of incon-sistent use of terminology for amazoni::~nvegetation types subject to inundation. The corrcct application of 1erms to am2zonian forcst types subjected to inundation was tully disct.:ssed by Prance (1979). He suggested that the term .. igapó n be restricted ta forests immdated by black or clear waters. In the present study, Prance 's definition of igapó will be used.
The seasonal igapós in the Amazon basin are flooded annually by the rise of watc;r levei of black water rivers. In the case of the Rio Negro, flooding is during the rainy season from December to May (Table 1 & Fig. 1); the water levei does not recede until well into August, whit:h is the midâle of the dry season (Fig. 2) . Although temperatura is uniformly high throughout the Amazon basin, soil shows great variety and thereby plays a more im-portant role than climate in the different1ation o f vegetation types ( Ducke & Black, 1953) . Igapó vegetation growing on different soil types exhibits different physiognomies. Some seasonal igapós occur on white-sand podzol and are f!ooded annually by black water,
Shirl ey H. Kuo Keel ('') Ghillean T . Prance ( "')
which ranges in pH from 3.7 to 5.4 (Sioli, 1968). The investigation of amazonian podzol
hr~s revealed that it is extremely deficient in
nutrients. Rich in white quartz, this soil is highly porous and therefore rapidly leached by the usual heavy tropical rain. lts acidity results in low ion-retention capacity (Kiinge, 1965; Stark, 1971; Stark & Jordan, 1978). The poverty of this soil and seasonal flooding act as important edaphic factors which determine the vegetaticn of igapós. The purpose of this study was to investigate the effect of this environmental stress on the igapó vegetation, and especial ly to determine the relationship between stress and dominance.
a
b
:
27.2
1771
(
1.1}
(251
c
d
-
E1
E
._,
Fig . 1 - C li mate diagram For Manaus (adapted from Climate·diagram map of South America. Walter et ai..
1975). a: mean annual temperatura (•C); b: mean annual precipitation (mm); c: number of years with records of temperatura; d: number of years with re· cords of precipitation; dotted area represents dry season; area with vertical hatching represents rela-tively humid season; shaded area represents monthly precipitation in excess of 100 mm (note the scale is re-duced to 1:10 so that one scale interval represents
200 mm).
[ • ) - The New York Botanlcal Garden, Bronx New York 10456
The study area, a white-sand, black-water igapó, is located on the north bank of the Rio N€:gro near Manaus (3° 2'S, 60° 8'W), about
1 km E ot the confluence of Igarapé Tarumã and the Rio Negro . The area is relatively undisturbed and has a uniform topography
15
10
5
-
e
1965
1966
-
:z:&:
~15
CIC
W.l
...
cz: !C10
5
with a gentle slope (a vertical change of 5 m in about 50 m horizontal or 10% slope) . During the rainy season, the extent of flooding determines the duration and depth of inun-dation along the slope. In the present swdy , the flood levei along this slope is treated as a moisture gradient .
Flg . 2 - The variation o f water depth o f the Rio Negro at Manaus over a ten-year period (from Prance & Ar ias, 1975. Fig. 3).
TABLE 1. Climatic data of Manaus (Wernstedt, 1972)
BRAZ IL
STATION YRS ELEV LAT LONG JAN FEB MAR APR MAY JUNE JULY AUG SEPT OCT NOV DEC ANNUAL
Manaus 30 157 3.08
s
60.01w
10.87 10.91 11 .85 11.30 7.60 3.90 2.40 1.61 2.44 4.41 6.50 8.98 82.72 79.5 78,6 79.0 79.3 80.2 79.7 79.2 80.2 80.4 81.0 80.8 81.0 79.7"YR" (Yeor) represents the number of yeors of record over which the monthly ond onnuol precipitotlon volues hove been computed. "ELEV" (Eievotion) represents the elevotion in feet obove meon seo levei of the reporting stotion.
"LAT" (LotitudiP) ond "LONG" (Longitude) represent latitudes ond longitudes to the neorest degrce ond mlnute. "E" (Fost) ar '"H"
(West) ínôicote longitudes eost ar west of the Greenwlch Merídion
Thc first (ar upper) llnc of doto glvcn for eoch stotion represents lhe monthly ond onnuol precipototíon in inches ond hundredths.
The second (ar lower) llne ot doto glven for eoch stotion represcnt ~ lhe overoge monthly ond onnuol tcmperotures in degrees ond
tenths Fohrenhelt.
MATERIALS AND METHODS
The field work was carried out in 1977
from October to December. During t he dry season, the limit of the igapó can be easily recognized by the attachment of sponges (Photo 1) and flood marks on stems of trees and shrubs. A preliminary study was made to determine an adequate sample area. Figure 3 indicates that numbers of species increase sharply with the initial increase of area. However, the increace leveis off after a sample of 1.800 m2, with 68 species inc!uding
vines and herbs (54 species exc ludi ng vines and herbs).
The igapó vegetation was sampled by means of 12 randomly chosen plots, each 10 x 15 meters. These plots were la id with their longer sides at a right angle to the shore. Within each plot, trees and shrubs higher than 1 m were recorded and their diameters at ground levei were measured. The importance
cn
Wol
CJ
70
60
50
~
40
cn
...._
:30
Wol
CQ
E
~
20
.
.
.
O..._,r---r--~-,---.r---r---600 1000 1400 1 00 2200
AREA(m
21
Fig. 3 - Species-area curve for 14 plots of 150m2 area. The graph shows the cumulativa number of species In relation to the increase in numbers of plots sampled.
Studies of ...
Photo 1 - Sponge attached on the branch of a shrub. This ls used as a demarcation of lnundated are::~ lhe highest point of sponge attachment is usdd to ~stimate
the flood levei at a given area.
value (I . V.) for each species was calculated by summing up re!ative frequency, relative density and relative dominance. To calculate the Shannon d1versity index (H) and the evenness index (e) the following tormula was used (Odum . 1971):
H = -
LPi log P1 (Pi = importanceprobabili-ty for each species
=
importance value for each speciese=
Htotal of importance values)
(S: number of species)
To invest1gate the effect of moisture stress on vegetation change, five linear transects, each 50 m long and 50 m apart. were placed at a right angle to the shore. One transect was only 40 m in length because of an abrupt 1 m rise above which terra firme vegetation was present. Trees and shrubs higher than 1 m and within 50 em on both sides
of
transect !ines were recorded, and their diameters at ground levei were measured . The data from each 10 m segment of 5 transects were pooled separately, and the importance values were determined. The flood leveis at each 10 m interval of transects were obtained by the highest pointsof
sponge attachment on stems. \louchers of sterile plant specimens from transects and plots were deposited in INPA, while those of fertile plants were deposited in INPA (1st set) andNY
(3rd set) .RESULTS
The study site is a low, open to closed one-story forest consisting of shrubs 2 - 5 m high as the main life-form. The leading domi-nant in the area is Myrciaria dubia with an I.V. 75.78 (Table 2) . The subdominant sp0cies are Pithecellobium adiantifolium
(1. V.
=
33.74). Eugenia cachoeirensis (1. V.
=
30.96),andE. chrysobalanoides (1.
V.
= 19.41). The Shannon diversity index (H), 4. 358 bits per individual, is based on sampies of 12 plots which contaial 54 speciesof
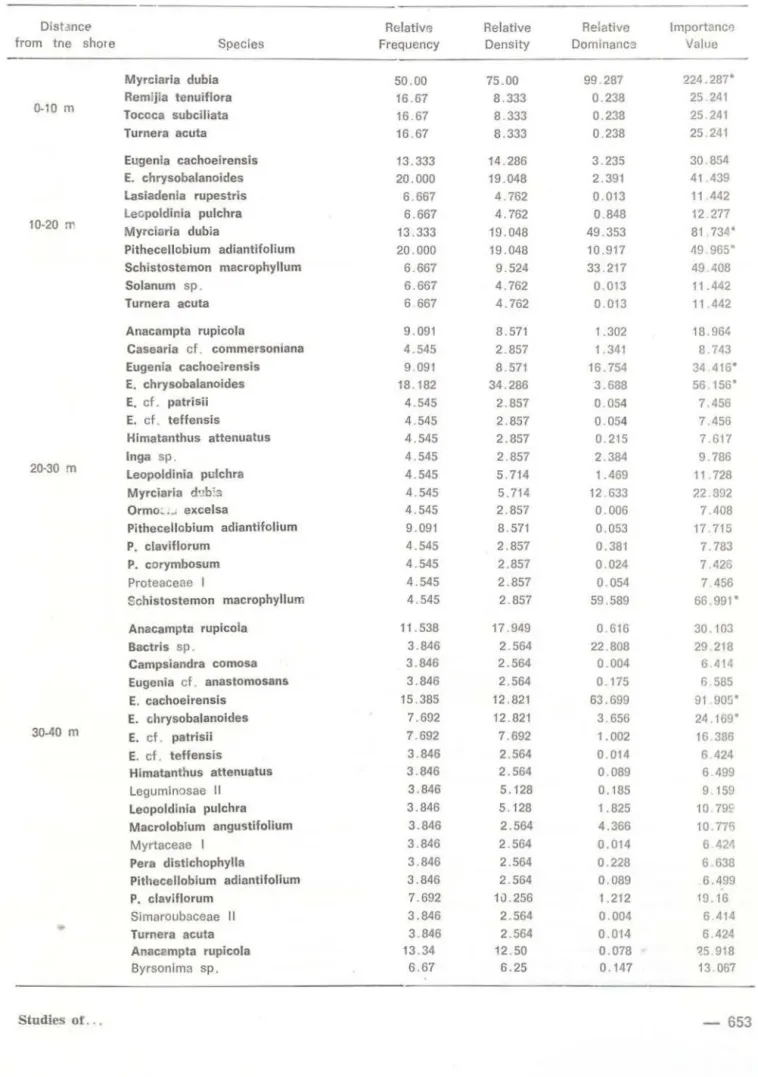
trees and shrubs higher than 1 m with 1028 individuais. This value represents an estimate; the total number of species in the community studied is actually unknown. For this reason , 4 . 358 bits per individual is a slightly underestimated value (Pielou , 1975) . The evenness value of abundance 75.73 % indicates that most species have few individuais.Transect data (Table 3) suggest that species with I . V. ?; 50 change nearly every 10 m, an arbitrarily dividing unit for segments of transects. The same leading dominant,
Myrciaria dubia occurs in both the O - 1 O m and the 1 O - 20 m segments, though the species composition of these two segments is very different. Myrciaria dubia has a higher I. V. in the O - 10 m segment than in the 10 - 20 m segment, where the dominance is
648-shared by Pithecellobium adiantifo/ium. Within the 20 - 30 m segment, Schistostemon ma-crophyllum and Eugenia chrysobalanoides are the dominant species with I . V . ~ 50 . The high I. V. of S. macrophyllum, a tree , is de-rived large ly from hiah relative domir.ance, whereas the high I. V. of E. chrysoba/anoides,
a shrub, is largely the result of high relative density . Eugenia cachoeirensís assumes the dominance in the 30 - 40 m segment, whereas Pera distíchophyfla and E. cf. patrisii
are the dominant species in the 40 - 50 m segment.
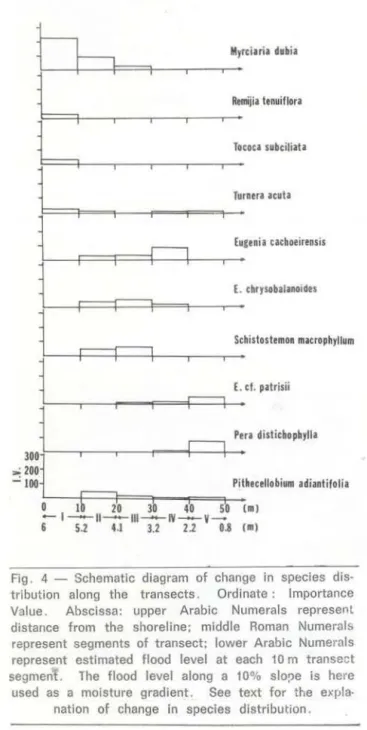
Although spccies zonation is obvious , along the moisture gradient boundaries of the zones are not abrupt (Fig . 4) . Myrciaria dubia
occurs only in the segments close to the water (between O - 30 m), and its abundance decreases along each subsequent 1 O m segment . Eugema cachoeirensis and f. chry-sobalanoides grow between the area delimited by the second and fourth segment, while
Schístostemon macrophyllum can be found only up to the third segment . Although f. cf.
patrísii grows from the third to the fifth segment, Pera distichophylla is limited to segments four and five. Pithecellobium adían-tifolium grows in every segment of the transects except the first, where only four species (M. dubia, Remijia tenuif/ora, Tococa subciliata and Turnera acuta) occur. The area covered by the first and second segments, with flood leveis that are 4 to 6 m high in the rainy season, appears to be more open with the individual plants widely spaced (Photo 2). i=urther up the slope, the space between indi-vidual plants decreases and species richness increases (Fig . 5) .
DISCUSSION
The importance value of Myrciaria dubia
(75. 78) demonstrates that there is dominance in the igapó studied. Dittus ( 1977) poir.teà out that thare is
a
marked contrast between maximum importance values (M.I.V.) of a temperatezone forest in Wisconsin (M .I.V. = 228) and equatorial rainforests in Brazil and in Borneo (M.I.V.=
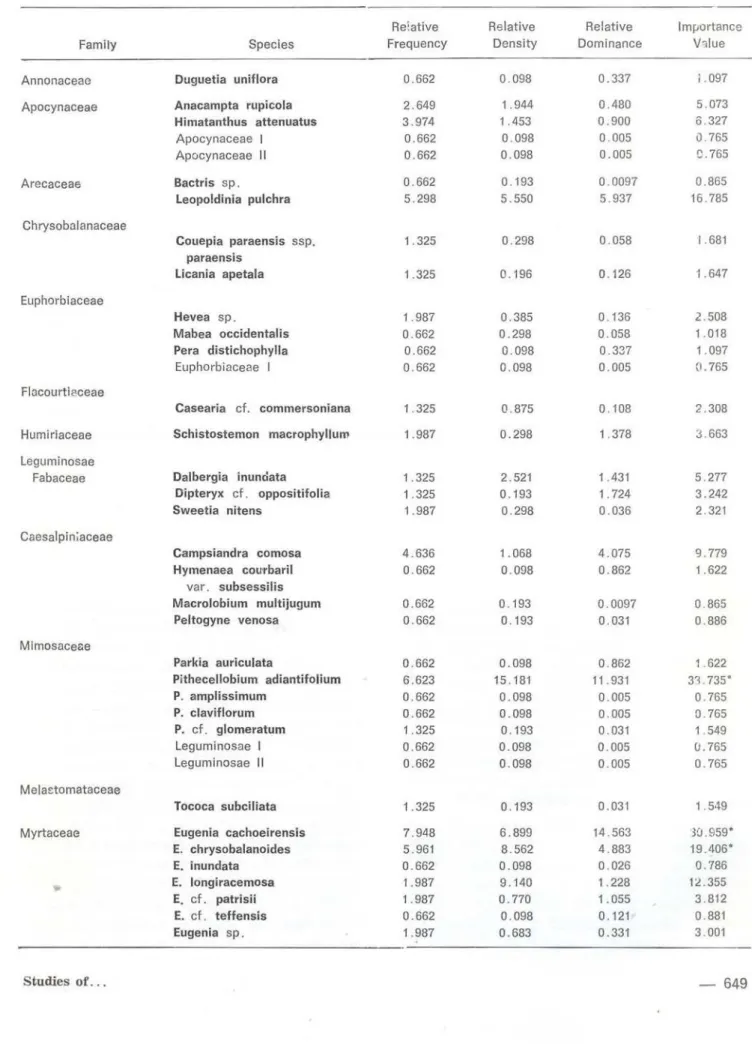
23.42 & 14). The M.I.V. of igapó vegetation is notably higher than those of rainforests which do not have clear-cutTABLE 2. Data of vegetatíon analysís from 12 plot s
Re!atíve Rei ative Rei ative lmportance
Family Species Frequency Density Dominance v .,Jue
Annonaceae Duguetía uni flora 0 .662 0.098 0.337 i . 097
Apocynaceae Anacampta rupicola 2.649 1.944 0 .480 5. 073
Himatanthus attenuatus 3 .974 1.453 0 .900 ô.327
Apocynaceae I 0.662 0.098 0. 005 0 .765
Apocynaceae 11 0.662 0.098 0.005 C.765
Arecaceae Bactris sp. 0 .662 0.193 0 .0097 0.865
Leopoldinia pulchra 5.298 5.550 5 .937 16.785
Chrysobalanaceae
Couepia paraensis ssp. 1.325 0 .298 0 .058 I .681
paraensis
Licania apetala 1.325 0.196
o.
126 1.647Euphorbiaceae
Hevea sp. 1 .987 0.385 0 .136 2.508
Mabea occidentalis 0 .662 0.298 0 .058 1 .018
Pera distichophylla 0.662 0.098 0 .337 1 .097
Euphorbiaceae I 0.662 0.098 0 .005 0.765
Flacourtiaceae
Casearia cf. commersoniana 1.325 0.875
o
.108 2.308Humiriaceae Schistostemon macrophyltum 1.987 0.298 1.378 3 663
Leguminosae
Fabaceae Dalbergia inunciata 1.325 2.521 1 .431 5 .277
Dipteryx cf. oppositifolia 1. 325
o
.193 1.724 3.242Sweet ia nitens 1.987 0.298 0 .036 2.321
Caesalpin;aceae
Campsiandra comosa 4 .636 1.068 4 .075 9.779
Hymenaea courbaril 0 .662 0 .098 0. 862 1.622
var . subsessilis
Macrolobium multijugum 0 .662 0 .193 0. 0097 0 .865
Peltogyne venosa 0 .662 0 .193 0.031 0.886
Mímosaceé:e
Parkia auriculata 0.662 0.098 0.862 1.622
Pithecellobium adiantifolium 6.623 15. 181 11 .931 33 . 735*
P. amplissimum 0 .662 0 .098 0.005 0. 765
P. claviflorum 0.662 0.098 0.005 0. 765
P. cf. glomeratum 1.325 0 .193 0.031 1.549
Legumínosae I 0 .662 0.098 0.005 0.765
Legumínosae 11 0 .662 0. 098 0 .005 0 . 765
Mela!:tomataceae
Tococa subcilíata 1.325 0. 193 0 .031 1.549
Myrtaceae Eugenia cachoeirensis 7.948 6.899 14 .563 3CJ.959*
E. chrysobalanoides 5 .961 8.562 4 .883 19 .406*
E. inundata 0.662 0.098 0 .026 0.786
E. longiracemosa 1.987 9.140 1.228 1 ~.355
E. c f. patrisii 1.987 0 .770 1. 055 3.812
E. cf. teffensis 0.662 0.098
o.
121 0.881Eugenia sp. 1.987 0.683 0.331 3.001
TA BLE 2 (cont inued)
Relotlve Relative Relativa lmp'lrtance
Famlly Specles Frequency Density Dominance Value
Myrcia sp. 0 .662 0. 098 0.026 0 .786
Myrciaria dubla 7.948 30.449 37.38 75 . 777**
Myrciaria sp. 0.662 0.193 0 .0097
o
865Polygonaceae Coccoloba excelsa 0.662 0.098 0 .026 0.786
Ruprechtia tenulflora 1.987 1.261 3.186 6.434
Proteaceae Roupala obtusa 0. 662 0.298 3.035 3.995
Rublaceae Remi jia tenuiflora 1.325 0.298 0.174 1.797
Sapotaceae Franchetella crasslfolla 1 .325 0.193 1.483 ~.00 1
Manllkara amazonica 1.325 0.098 0.820 2 243
Sapotaceae I 0.662 0 . 193 0 .242 1.097
Sapotaceae 11 0.662 0.098 0 .005 0.765
Slmaroubaceae Simaroubaceae 1 0.662 0 .098
o.
121 0.881Slmaroubaceae 11 0.662 0.098 0.005 0.765
Simaroubaceae 111 0.662 0.098 0.005 0.765
Solanoceae Solanum sp. 2 .649 0.771 0.039 3.459
Sterculiaceae
Buettneria oblíqua 0.662 0. 098 0 .005 0.765
Turneraceae Turnera acuta 7. 286 5. 831 0.313 13 .43
Shannon Diverslty Jndex:
H
(bits per individual)=
4 .:?58Evenness lndex : e
=
H 75 .73% (S: number of specles = 54)
...,---,::--log2 S leading dominant • subdominants
dominant spccies. However, the dominant and subdominant species in this study site, Myr ciaria dubia, Pithecellobium adiantifolium, Eu-genia cachoeirensis, and E. chrysobalanoides,
do not necessan ly characterize ali white-sand igapós along the Rio Negro. The forest inven-taries throughout Amazonia have revealed that characteristic species of forests differ from area to area within a short distance. Thus, to define the íorest by characteristic species is often misleading (Pires & Prance, 1977) .
The change of species distribution occurs a long transects . About 1 O m from the sllore, th €: area is overwhelming ly dominated by Myr-ciaria dubia. Beyond 10 m, Pithecel/obium adiantifolium, Schistost~::;mon macrophyllum, Eugenia chrysobalanoides, E. cachoeirensis
and Pera distichophylla appear and increase in
650-thf:ir relative importance sequentially. The rapid change of dominant species within a short distance in a homogeneous substrate (white-sand) po ints to the influence of other important environmental factors, e. g . flood levei. The physiological basis of flood tolerance h as been discussed by Crawford ( 1976) . McMannon & Crawford ( 1971 ) demonstrated that in anaerobic conditions flood-intolerant species accu mulate ethanol, w hereas flood-tolerant species undergo a metabolic change, accum ulating malate rather then ethanol. To overcome the lack of
Ch,
flood to lerant species use more effectively nitrate as an alternate electron accept or (García-Noro et a/., 1973) Since the area has a gentle 10% slope, vege-tation near t he shore is water-logged Jonger and deeper than t hat in t he upper area. Thusthe change of spec ies along the moíst ure gré:ldient probably reflects the difference of physiological ability to flood tolerance.
The transects cover only sandy areas exposed in the dry season. There are perma· nent water-logged areas with sparse vegetation stret ch ing out from the shore into the water (Photo 3). Due to limited t i me ava'lable for field work, they were not subjected to the transect ancõlysis . Eugenia inundata, Sphinc-tanthus stmflorus and Securidaca longifolia
are most frequent in the water. Takeuchi
(1962) indicated that E. inundata is a dominant
Myrciuia d•~ ia
Remiiia tenuiflora
Totota subtiliata
Turnera acuta
Eugenia cachoeirensis
E. thrysobalanoidts
~
Schistostemon macrophyllum1~~--,--.
~
E. ti. patrisii1~ --~--~--~
==~
r==l---+--1
3001!---.----.--~~r=lf----+-,..: 200
...: 100 Pithmllobium adiantifolía
o ln
o 3b
.~
sb
(111)Pm distithphylla
-
1---11-111---IV---V-6 5.2 4.1 3.2 21 0.8 (1111
Fig. 4 - Schematic diagram of change in species dis· tribution along the transects . Ordinate : lmportance Value . Abscissa: upper Arabic Numerais represent distance from the shoreline; middle Roman Numeral& represent segments of transect; lower Arabic Numerais represent estimated flood levei at each 10m transe ct segment. The flood levei along a 10% slo!)e is here used as a moisture gradient. See text for the expla·
natíon o f change in species distribution.
Studies of ..
of igapó forests along river shores and perma· nenlly inundated islands. However, according to the authors' observation, this species is mainly restricted to the permanent water-loggecl area rcgardless of whether the water is of black or white type. Along sa~1dy beaches which become dry annually for a period of time, different dominant species, such as
Myrciaria dubia, occur.
The various adaptive strateJies of igapó vegetation to seasonal inundation and drought merit further investigat1on . The study a a woody swamp in Suriname has shown that some trees survived dunng h1gh water periods by becoming partly deciduous in the crowns or by corky breathing roots (pneu-matophores) which bend down sometimes during low water period and develop as prop roots. Others, (e lled by the flood, regenerate vegetatively with root suckers (Teunissen ,
1976) . In thc area studied, pneumatophores are seen on the trun k o f an unknown tree . The vegetation change during the rainy season remains to be investigated. Prance ( 1979) indicated that some igapó vegetation displays xerornorphic adaptat ion to seasonal dryness with sclerophyllous leaves. Since no plant with sclerophyllous leaves or other morpholo-gical adapté:ltion was noted, the drought effect on vegetation in this igapó may not be very severe. However, the s~udies of sap tension of flooded trees and shrubs along the Rio Negro near Manaus showed that many plants such as
Ruprechtia sp., Parkia auriculata, Eugenia sp., etc. reached zero turgor without wilting at the peak of hot days (Scholander & Perez, 1968) . lt may well be possible that this physiological property contributes to the tolerance to drought during the dry season.
The species list (Table 4) provides prelimi-nary information about the plants of the igapó studied. Many plants have been 1dentifieà on the basis of sterile material. In the dry season many seed lings and saplings are found in open canopy areas. They have been excluded from this study because of the difficulties in identi-fying them. However, if their identification
should become possible, their abundance can serve as an indication of the reproductive potential of the ar ea.
Photo 2 - Open canopy area with individual plants wldely spaced and lower specles dlversity.
Photo 3 - Permanent water-logged area with pia nts growlng in the water throughout the year.
TABLE 3. Data of vegetation analysis from 5 transects
Distance Rei ative Relative Relative lmportanco
from tne shor e Species Frequency Density Dom i nanes l/alue
Myrciaria dubla 50.00 75.00 99.287 224.287.
Remij ia t enuiflora 16.67 8.333 0.238 25 241
0.10 m
Toccca subciliata 16.67 8.333 0.238 25 241
Turnera acuta 16.67 8 .333 0.238 25.241
Eugenia cachoeirensis 13 .333 14 . 286 3.235 30 854
E. chrysobalanoides 20.000 19.048 2.391 41 439
Lasiadenia rupestris 6 667 4.762 0.013 11 442
l ecpoldinia pulchra 6.667 4 .762 0.848 12 277
10-20 :T'
Myrciaria dubia 13 .333 19.048 49.353 81 .734'
Pithecellobium adiantlfolium 20 .000 19.048 10.917 49 965"
Schistostemon macrophyllum 6.667 9.524 33 217 49 . 408
Solanum sp. 6. 667 4.762
o
013 11.442Turnera acuta 6 667 4.762
o
013 11 442Anacampta rupicola 9. 091 8.571 1.302 18.964
Casearia c f. commersoniana 4.545 2.857 1. 341 8 743
Eugenia cachoeirensis 9 .091 8.571 16.754 34 .416°
E. chrysobalanoides 18.182 34.286 3.688 56 . 156.
E. c f. patrisii 4.545 2 .857 0.054 7 .456
E. cf. teffensis 4 .545 2 .857 0.054 7.456
Himatanthus attenuatus 4 .545 2 .857 0.215 7.617
lnga sp 4.545 2.857 2.384 9. 786
20·30 m Leopoldinia pulchra 4.545
5.714 1.469 11.728
Myrciaria d!..!b!a 4.545 5.714 12.633 22 802
Ormo _.~ excelsa 4.545 2 .857 0.006 7.408
Pithecellobium adiantlfolium 9 .091 8.571 0.053 17 715
P. claviflorum 4.545 2 .857 0.381 7.783
P. corymbosum 4.545 2.857 0.024 7 426
Proteaceae I 4.545 2.857
o
054 7. 456Schistostemon macrophyllum 4 .545 2.857 59.589 66. 991'
Anacampta rupicola 11.538 17.949
o
616 30.103Bactris sp. 3.846 2.564 22.808 29 218
Campsiandra comosa 3.846 2.564 0.004 6 414
Eugenia cf. anastomosans 3 .846 2.564
o.
175 6 585E. cachoeirensis 15.385 12 .821 63 .699 91.905.
E. c.hrysobalanoides 7.692 12 .821 3.656 24.169.
30-40 m E. cf patrisii 7.692 7.692 1.002 16 386
E. cf. teffensis 3.846 2 .564 0.014 6 424
Himatanthus attenuatus 3.846 2.564 0.089 6 499
Leguminosae 11 3 .846 5 .128 0. 185 9.159
Leopoldinia pulchra 3 .846 5. 128 1 .825 10 79~
Macrolobium angustifolium 3 .846 2.564 4.366 10.776
Myrtaceae I 3 846 2.564 0.014 6 4211
Pera distichophylla 3.846 2.564
o
228 6 .638Pithecellobium adiantifolium 3.846 2.564 0.089 6.499
P. claviflorum 7.692 10. 256 1 . 212 19.16
Simaroubaceae 11 3.846 2 .564 0.004 6. 414
Turnera acuta 3 846 2.564 0.014 6.424
Anacampta rupicola 13.34 12.50 0.078 ~5 918
Byrsonlma sp . 6.67 6.25 0.147 13 . 067
TABLE 3 (continued)
Distance
from the shore Species
Eugenia cf . omissa E c f. patrisii E. cf. teffensis Eugenia sp. 40-50 m••
Legumfnosae I Myrcia sp . Pera dfst fchophylla
Pithecellobl um adiantifolium P. clavl florum
SWeetla nltens Turnera acuta
.
Doto bosed only on .oi tronscch.Specles discussed In tho text .
101-ê
-Ech
Ech
Eca
Pa
Md
~ ~c
Ech
I
Relative Rei ative Frequency D~nsity
6.67 6.25
6.67 6.25
6.67 6.25
6.67 6.25
6 .67 6.25
6.67 6.25
13.34 18.75
6.67 6.25
6.67 6.25
6.67 6.25
6.67 6.25
Pc Pc Eca
Ech
Ar
Eca
Ta
PaAr
UJ
Relative Dornlnance
2.071 43.419 0 . 147 4 .824 0 .012 0.075 48.545 0 .003 0 .003 0.003 0.027
Pd Eo Pd
Ar
1o,Pa
~~, .'
J
Ar
lmportance V alue
14 .991 56.339. 13.067 17.744 12 . 932 12.995 80 .635* 12.923 12.923 12.923 12 .947
o
!'o
2'0
30
40
s'o
DISTANCE FROM lHE SHORELINE (m)
Fig . 5 - A simplified profile of a transect of 1 x 50m2. Thin fine indicates basal d1ameter of stem
<
10 em; triek llne indieates basal diameter of stem ~ 10 em but<
30 em; Ar: Anaea mpta rupieola; Eea: Eugenia eachoeirensis; Ech : E. chrysobalanoides: Eo : E. cf. omissa; Lp: Leopoldi nia pulchra; Md ; Myrciaria dubla; Ml : Myrtaceae I; Os : Ormosia excelsa; Pa : Pithecelloblum adiantifolium; Pc: P. clavifo rum ; Pd: Pera distichophylla; Sn: Sweetia nitens;Ta : Turnera acuta .
A CKNOWLEDGMENTS
The authors wish to thank Dr. Eduardo Lleras, Director of the Botany Courses of INPA (lr.stituto Nacional de Pesquisas da Amazônia ,
M ant~us), ior providing t he facilities for field
work. We are also grateful to Mr. José Guedes, José F. Ramos, Luís F. Coelho, and Osmarino P. Monteiro for assistance wlth the field work,
654-to Ora. Marlene F. da Si lva, Dr. Richard Cowan . Dr. Charles R. Gunn and Dr. Mary K. Arroyo for identifying fruit and sterile material. The authors are greatly indebted to Mr. Peter O'Connor for his suggestions and criticai review of the manuscript, and to Dr. María Lebrón-l uteyn many valuable camments.
Field work was supported by NSF Grant INT75-19282, awarded to Dr. Ghillean T. Prance .
Resumo
A vegetação de um igapó de água preta n& Amazô-nia é estudada. mostrando 2 dominância da espécie Myrciaria dubla (Myrtaceae) com valor de importância máxima de 75 . O índice de diversidade Shannon desta vegetação foi 4. 358 • bits • por individuo, de que 75.38% foi devido ao volor de igualdade. As espécies se mu-dam ao longo do gradiente de umidade que ocorre en-tre o rio e a mata ao longo dos tronsectos feitos. Ainda que muitas espécies tenham uma distribuição zonal, os limites não são muito bem delimitados. Esta distribui-ção zonal das espécies é provavelmente devido aos di-ferentes requerimentos de luz e didi-ferentes tolerâncias
à inundação das diversas espécies. Uma lista completa das 54 espécies da área em estudo é apresentada, acrescida de d3dos sobre a freqüência. densidade, do-minância e importância de cada espécie.
SUMMARY
The vegetation analysis of a Central Amazonian igapó, a forest under severe environmental stress -poor soil and seasonal flooding, revea ls the existence of the dominant species Myrciaria dubia with a M.I.V. 75 The Shannon diversity mdex of this forest is 4.358 bits per individual. of whlch 75.73% is attributable to the evenness valuc . Species distributions change along the moisture gradient. Though ;nany species exhibit the tendency of zonal distribution, the boundaries of zones are not 3brupt . The ~uthors suggest that species distribution is the re~ult of physiological difference to flood tolerance . Further research should be directed to the comparison of flood tolerance of the plants which occur in ~he foilowing three areas: permanent water-logged area, beach area with open canopy and upper area with closed canopy. The various adaptive strategies to seasonal lnundation and drought, and the reproductive potential of the forest also merit further stuclies.
LITERATURE CITED
BLACK, G . A . ; DOBZHANSKY, T . & PAVAN, C.
1950 - Some attempts to e&timate species di· versity and population àensity of trees in Amazoznian forests . Bot. Gaz. 111 :413-425.
CRAWFORD, R.M. M .
1976 - Tolerance of anoxia and the regubtion of glycolysis in tree roots, pp. 387-401 . In: M . G. R. Cannell & F.T. Last (eds . l. Tree Physiology and Yield lmprovement. Aca· demic Press, New York.
DIITUS, W . P . J.
1977 - The ecology of a semi-evergreP.n forest commun!ty in Sri Lanka. Biotropica 9(4) : 268-286 .
OUCKE, A. & BLACK, G.A.
1953 - Phytogeographical notes on the B3zilian Am<.>zon. Anais Acad. Bras. Cienc. 25f 1) : 1·46.
Studies of . . .
GARCÍA- Novo, F. & CRA wFoRD, R. M. M .
1973 - Soil aera~ion , nitrate reduction
anu
fl ooding tolerance in higher plants. New Phytol. 72: 1031-1039.KL!NGE, 1-1 .
1965 - Podzol soils in the Amazon basin . J. Soil Sei. 16: 95·103 .
M CMANNON, M . & CRAWFORD. R .M .M .
1971 - A metabolic theory of flooding ~ oleranc e:
the significance of cnzyme distributlon and behavior. New Phytol. 70 : 299-306
OouM, H . P.
1971 - Fundamentais of Ecology 3rd ed . W B. Saunders Co. , Philadelphia
Pu LOU, E .C.
1975 - Ecological Diversity . John Wiley & Sons. New York .
PI RES, J .M. & P RANCE, 0 .T.
1977 - The Amazon forest : a naturol heritage to be preserved . pp . 158-194 In: G. T . Pran· ce & T. S. Eli(;s (eds.) Extinction is Fora-ver . New York Bot . Gard
PR.ANCE, G . T .
1979 - Notes on the vegetation of Am:lZonia 111. The terminology of Amazonlan forest types subject to inundation . Brittonin 31(1): 26-38 .
PRANCE, G . T. & AlUAS, J.R .
1975 - A study of the floral biology ot Victorla amazonica (Poepp .) Sowerby (Nymphaea-ceae) . Acta Amazonica 5(2) : 109-139.
SCIIOLANDL.R, P. F , & OLIVEIRA PEREZ, M
1968 - Sap tension in flooded trees ant;l bushes o f the Amazon . Plant Physiol. 43: 1870·1873.
SIOLI, H .
1968 - Hydroch~místry and geology in the Brazi-lian Amazon reglon. Amazoníana 1 (3) : 267-277 .
ST ~ RK , N . M.
1971 - Nutrient cycling I . N:.~trient distribution on some Amazonian soils . Tropical Ecology 12 : 24-50 .
STARK. N. M. & J ORDAN, C.F .
1978 - Nutrient retentíon by the root mat of an Amazonian raln forest . Ecology 59(3) : 434-437.
TAKECCHI, M .
1962 - The structure of the Amazonian vegetat.on VI. Igapó. J. Fac. Sei. Univ. Tokyo Sect. 3 (Botany) 3 : 297-304.
TEUNISSEN, P . A .
1976 - Notes on the vegetation ot Suriname. Acta Amazonica 6(2): 117-150.
WAI..TER, H .; H ARN ICKELL, E . & MUEI. LER-DoMBOIS, 0 .
1975 - Clímate-diagram Maps . Sp r lnger-Verl ~ g .
Berlln.
WERNSTI!OT, F. L.
1972 - World Ciimate Data. Climatic Dat:- f>ress.
(Aceito para publicação em 26/ 7/79)