Braz. J. of Develop., Curitiba, v. 5, n. 8, p. 12607-12622 aug. 2019 ISSN 2525-8761
Chemical kinetics analysis of NO and CO formation based on
thermodynamic data from an ethanol-fueled engine computational model
Análise de cinética química da formação de NO e CO baseada em dados
termodinâmicos de um modelo computacional de um motor alimentado a
etanol
DOI:10.34117/bjdv5n8-097
Recebimento dos originais: 14/07/2019 Aceitação para publicação: 23/08/2019
Alessandro José Truta Beserra de Lima
Mestre em Engenharia Mecânica pela Universidade Estadual de Campinas
Instituição: Faculdade de Engenharia Mecânica – Departamento de Energia - UNICAMP Endereço: Rua Mendeleyev, 200, FEM-DE-UNICAMP - Cidade Universitária, CEP:
13083-860 Campinas – SP, Brasil E-mail: alessandrojtblima@gmail.com
Waldyr Luiz Ribeiro Gallo
Doutor em Engenharia Mecânica pela Universidade Estadual de Campinas
Instituição: Faculdade de Engenharia Mecânica – Departamento de Energia - UNICAMP Endereço: Rua Mendeleyev, 200, FEM-DE-UNICAMP - Cidade Universitária, CEP:
13083-860 Campinas – SP, Brasil E-mail: gallo@fem.unicamp.br
ABSTRACT
The series of the oretical analyses of pollutant formation has been undertaken on a computer program based on temperature and volume data from a two-zone internal combustion engine model. The objective was to predict the formation of nitric oxide and carbon monoxide during combustion process in an ethanol-fueled engine before the three-way catalyst operation. The predictions were based on a chemical kinetics model, which considered 12 chemical species and 22 chemical reactions. The model calculated the reaction rates from the beginning of the combustion process until chemical kinetics calculations showed no effect on the gases composition during expansion. The developed analysis tested some temperatures in order to discover until when chemical kinetics effectiveness was considerable. This analysis involved the study of NO and CO formation rates. The considered range of temperatures was between 2500 and 1500K, typical engine temperatures during combustion and expansion processes. Results showed that NO and CO.
Keywords: Spark-ignition engines, Nitric oxide, Carbon monoxide, chemical kinetics
modeling, pollutant formation.
RESUMO
Uma série de análises teóricas de formação de poluentes foi desenvolvida em um programa de computador baseado em dados de temperatura e volume de um modelo computacional de duas zonas de um motor de combustão interna. O objetivo foi predizer a formação de óxido nítrico
Braz. J. of Develop., Curitiba, v. 5, n. 8, p. 12607-12622 aug. 2019 ISSN 2525-8761 e monóxido de carbono durante o processo de combustão em um motor alimentado à etanol antes da operação do catalisador de três vias. As predições foram baseadas em um modelo de cinética química, que considerou 12 espécies químicas e 22 reações químicas. O modelo calculou as taxas de reação desde o início do processo de combustão até os cálculos de cinética química mostrarem nenhum efeito adicional na composição dos gases durante a expansão. A análise desenvolvida testou algumas temperaturas a fim de descobrir até quando a cinética química deve ser considerada. Esta análise envolveu o estudo das taxas de formação de NO e CO. A variação de temperaturas ficou entre 2500 e 1500K, valores típicos de motores durante os processos de combustão e expansão. Os resultados mostraram que as formações de NO e CO foram qualitativamente coerentes, quando comparadas com medidas de formação destes poluentes em motores de combustão interna presentes na literatura. As temperaturas estudadas permitiram a possibilidade de manter constante a concentração de algumas espécies em momentos específicos durante o processo de expansão, sem mudar significativamente os resultados de formação de poluentes.
Palavras-Chave: Motores de ignição por centelha, Óxido nítrico, Monóxido de carbono,
modelação da cinética química, formação de poluentes.
1. INTRODUCTION
Since the 50s, pollutant emission and their control have obtained great importance on the automotive industry. The requirement for more rigid pollutant emission limits from automobiles passes through a better knowledge of the formation of regulated pollutants on a internal combustion engine cycle. The effects caused by the presence of nitric oxide (NO) and carbon monoxide (CO) emitted by engines in the atmosphere cause serious damage to human health and to the environment of the planet.
Brazil has had a narrow relationship with ethanol since the 20s. The great amount of sugarcane available on the country allows the use of ethanol as an alternative source of energy, especially for automotive purposes. Ethanol presents more desirable characteristics as fuel when compared to gasoline, which encourages its use on engines [1], [2], although with the advent of the three-way catalyst, its reduced pollutant characteristics have been devalued nowadays. Still, ethanol may be used as an alternative fuel for GHG reduction and this benefit should not be disregarded.
Literature comments that nitric oxide presents a nonequilibrium tendency during combustion and expansion strokes [3]. Concentration values measured during exhaust process are closer to equilibrium concentrations on peak engine temperatures than concentrations on exhaust temperatures. The expansion process appears to offer less time than it would be required to NO and CO decompositions to be completed, phenomenon that a chemical kinetics approach may evaluate, while a chemical equilibrium cannot.
Braz. J. of Develop., Curitiba, v. 5, n. 8, p. 12607-12622 aug. 2019 ISSN 2525-8761 In order to predict qualitatively the formation of NO and CO from engines fueled by ethanol, a pollutant formation model was developed in order to calculate these regulated pollutants concentration considering P-V-T curves generated by a two-zone engine thermodynamic model. The objective was to obtain NO and CO molar concentration curves during combustion and expansion strokes of an ICE simulator model and study the tendencies presented by both gases during the engine cycle. A reduced chemical kinetics approach was required to achieve this goal. This approach was required since a chemical equilibrium model applied to the combustion gases during the engine cycle indicated lower NO and CO concentrations during the exhaust stroke than concentrations measured by experimental analyses of the exhaust gas composition of engines [4], [5].
Analyses of nitric oxide and carbon monoxide concentration are presented versus engine crank angle under different engine conditions. Engine speed, air-fuel ratio and engine load were varied to evaluate their influence on the formation of the studied pollutants on these different engine operations.
The problem considered 22 chemical reactions and 12 chemical species based on a mixture of chemical reactions presented on the references previously commented. A set of 12 differential equations was then obtained and the chemical kinetics was solved by an implicit trapezoidal method instead of an ordinary ODE solver. The first reason to justify this choice is due to the impractical computer time required to solve this set of equations by an ordinary Runge-Kutta procedure, for instance, since explicit methods required considerably small step-sizes to solve stiff-ordinary equation systems without stability issues [6], [7]. The second reason is based on the simplicity of applying the implicit trapezoidal method when compared to other implicit ODE solving methods, besides the method’s flexibility of using higher step-sizes without problems with stability and divergence.
2. DETAILS OF THE MODEL
2.1 PROCEDURE AND ASSUMPTIONS
As previously commented, the kinetic model presented on this paper calculated the molar concentrations based on data originated from a two-zone thermodynamic engine model. This model was developed for a mixture of gases under SI engine conditions, although the presented analysis considered a P-V-T profile from an engine model. The analysis involved 12 chemical species and had the objective of studying the NO and CO formations and their
Braz. J. of Develop., Curitiba, v. 5, n. 8, p. 12607-12622 aug. 2019 ISSN 2525-8761 concentration behavior under SI engine conditions. The model considered 22 chemical reactions, the same reactions used by Way [8].
First, chemical equilibrium is used as a tool to predict the composition of the combustion gases until combustion process initiates. Then chemical kinetics is applied on the mixture of gases to calculate their rates of formation and consumption during combustion and expansion phases of the simulated engine, until chemical kinetics is considered negligible. This approach allows the user to predict (𝑁𝑂𝑥 e 𝐶𝑂) formation during each position of the crank angle while reduces the required computer time.
The chemical kinetic model operates during each step-size of the two-zone engine model mentioned earlier. This allows the chemical kinetics model to develop calculations under constant-volume and constant-temperature conditions for each step-size. This assumption is possible since the thermodynamic conditions (𝑃, 𝑉, 𝑇, 𝑑𝑉, 𝑑𝑇, 𝑑𝑃) of a SI engine on a regular step-size used by the algorithm (𝑑𝜃 ≈ 0.05°) do not vary considerably. This is the major
assumption of the model, since the molar concentration derivatives (𝑑[𝐶𝑖]
𝑑𝑡 ) will not depend on the volume derivative of the piston-cylinder assembly. Thus, this assumption simplifies the model without removing much precision from its results.
During all iterations, the thermodynamic conditions of the burned zone are applied to the chemical kinetics model, The chemical species considered on the model are the same as presented by Way [8], with the addition of Argon.
(𝐴𝑟, 𝐶𝑂, 𝐶𝑂2, 𝐻, 𝐻2, 𝐻2𝑂, 𝑂𝐻, 𝑂, 𝑂2, 𝑁, 𝑁2, 𝑁𝑂)
The kinetic model is calculated until the freezing composition assumption is applied. This assumption may be applied when the temperature of the system is low enough to chemical kinetics to no change the compositions significantly. The chemical reactions are considerably slow and they do not affect the molar concentrations considerably. Therefore the composition of the combustion gases may be considered frozen since the freezing temperature is reached. This application is valid on situations close to the end of the expansion process, where the temperatures of the burned zone are lower than 1500K.
Based on the assumptions mentioned, the chemical kinetics procedure initiates with a mixture of gases from the beginning of the burned zone is provided to the model as the initial composition. This mixture had its composition calculated by a chemical equilibrium model originated from the zone model under specific engine conditions (air-fuel ratio). The two-zone model also provides the burned two-zone conditions (𝑇𝑏, 𝑉, 𝑃) as inputs for the kinetic
Braz. J. of Develop., Curitiba, v. 5, n. 8, p. 12607-12622 aug. 2019 ISSN 2525-8761 calculations. The differential equations are solved for molar concentrations, which
relate with the number of moles of each species by Eq. (1): [𝐶𝑖] =
𝑛𝑖
𝑉
2.2 CHEMICAL KINETIC EQUATIONS
The chemical reactions of the kinetic model are presented on Equation (2):
{ 𝑂𝐻 + 𝐻 ↔ 𝐻2+ 𝑂 𝑂𝐻 + 𝑂 ↔ 𝑂2+ 𝐻 𝑂𝐻 + 𝐻2 ↔ 𝐻2𝑂 + 𝐻 𝑂𝐻 + 𝑂𝐻 ↔ 𝐻2𝑂 + 𝑂 𝐶𝑂 + 𝑂𝐻 ↔ 𝐶𝑂2+ 𝐻 𝐻 + 𝑂𝐻 + 𝑀 ↔ 𝐻2𝑂 + 𝑀 2𝐻 + 𝑀 ↔ 𝐻2+ 𝑀 2𝑂 + 𝑀 ↔ 𝑂2+ 𝑀 𝑂2+ 𝑁 ↔ 𝑁𝑂 + 𝑂 𝑁𝑂 + 𝑁 ↔ 𝑁2+ 𝑂 𝑂𝐻 + 𝑁 ↔ 𝑁𝑂 + 𝐻
Where M is the third-body molecule, and it was considered to be 𝑁2, since its molar fraction is considerably higher than the other species on the model (𝑦𝑁2 ≈ 0.7).
The system of differential equations is developed using the mass-reaction law presented by Equation (3): 𝑑𝐶𝑖 𝑑𝑡 = ∑( 𝜈𝑖,𝑙 ′′ − 𝜈 𝑖,𝑙′ )𝑘𝑓,𝑙∏ 𝐶𝑗 𝜈𝑗,𝑙′ 𝑁 𝑗=1 𝑅 𝑙=1 + ∑(𝜈𝑖,𝑙′ − 𝜈𝑖,𝑙′′)𝑘𝑏,𝑙∏ 𝐶𝑗 𝜈𝑗,𝑙′′ 𝑁 𝑗=1 𝑅 𝑙=1
The forward rate constants (𝑘𝑓) are calculated for the burned temperature 𝑇𝑏. The forward rate constant for each equation is based on Equation (4):
𝑘𝑓 = 𝐴𝑇𝑏exp (− 𝐸𝑎 𝑅𝑢𝑇)
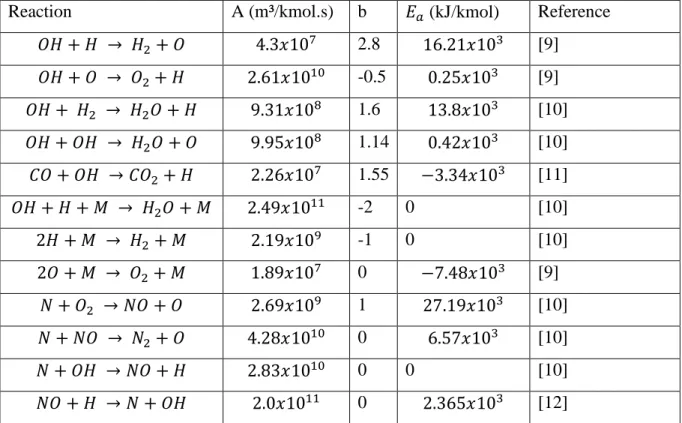
The parameters A, b and 𝐸𝑎 for each chemical reaction are indicated on Table
1. The backward reaction rate constants are calculated based on a chemical equilibrium model related with chemical kinetics, which is represented by Equation (5):
𝑘𝑓 𝑘𝑏
= 𝐾𝑐 = 𝐾𝑝(𝑅𝑢𝑇)∆𝑛
The exception for the backward reaction rate constant was the reaction (𝑁𝑂 + 𝐻 → 𝑁 + 𝑂𝐻), which the rate parameters also follow on Table 1.
(2)
(3)
(4)
(5) (1)
Braz. J. of Develop., Curitiba, v. 5, n. 8, p. 12607-12622 aug. 2019 ISSN 2525-8761
Table 1 - Reaction Rate Parameters
Reaction A (m³/kmol.s) b 𝐸𝑎 (kJ/kmol) Reference 𝑂𝐻 + 𝐻 → 𝐻2+ 𝑂 4.3𝑥107 2.8 16.21𝑥103 [9] 𝑂𝐻 + 𝑂 → 𝑂2+ 𝐻 2.61𝑥1010 -0.5 0.25𝑥103 [9] 𝑂𝐻 + 𝐻2 → 𝐻2𝑂 + 𝐻 9.31𝑥108 1.6 13.8𝑥103 [10] 𝑂𝐻 + 𝑂𝐻 → 𝐻2𝑂 + 𝑂 9.95𝑥108 1.14 0.42𝑥103 [10] 𝐶𝑂 + 𝑂𝐻 → 𝐶𝑂2+ 𝐻 2.26𝑥107 1.55 −3.34𝑥103 [11] 𝑂𝐻 + 𝐻 + 𝑀 → 𝐻2𝑂 + 𝑀 2.49𝑥1011 -2 0 [10] 2𝐻 + 𝑀 → 𝐻2 + 𝑀 2.19𝑥109 -1 0 [10] 2𝑂 + 𝑀 → 𝑂2+ 𝑀 1.89𝑥107 0 −7.48𝑥103 [9] 𝑁 + 𝑂2 → 𝑁𝑂 + 𝑂 2.69𝑥109 1 27.19𝑥103 [10] 𝑁 + 𝑁𝑂 → 𝑁2+ 𝑂 4.28𝑥1010 0 6.57𝑥103 [10] 𝑁 + 𝑂𝐻 → 𝑁𝑂 + 𝐻 2.83𝑥1010 0 0 [10] 𝑁𝑂 + 𝐻 → 𝑁 + 𝑂𝐻 2.0𝑥1011 0 2.365𝑥103 [12]
2.3 IMPLICIT NUMERICAL METHOD
Complex kinetic systems usually require numerical techniques to solve the ordinary differential equation systems. For each iteration, the numerical methods have errors associated with the technique. A fourth order Runge-Kutta method may be applied to solve a chemical kinetic system, but stability issues usually appear when the step-size applied to calculate the method is “high” enough. Chemical systems usually have a special behavior, which required the numerical method to be stable enough to solve them without the numerical errors to grow exponentially [7]. This stiffness presented by the kinetic equations is related to the different orders of magnitude presented by the rate reactions. To guarantee stability during the solution, considerable small step-sizes are required, which is unfeasible in most computer simulations, when computer timing is important.
Therefore, in order to avoid stability problems, implicit methods are applied to solve kinetic problems. The Implicit Trapezoidal Method equation for one variable is presented (Eq. (6)):
𝑤𝑗+1 = 𝑤𝑗+ ℎ
2[𝑓(𝑡𝑗+1, 𝑤𝑗+1) + 𝑓(𝑡𝑗, 𝑤𝑗)]
An interesting characteristic of the Implicit Trapezoidal Method is that it is an
A-stable method, i.e., it is completely stable independent of the step used to solve the problem. (6)
Braz. J. of Develop., Curitiba, v. 5, n. 8, p. 12607-12622 aug. 2019 ISSN 2525-8761 Thus, for this numerical method, it may be applied any time step for the chemical kinetic problem that stability issues would not exist.
The methodology applied on this paper was to manipulate the differential equation system to convert it into a non-linear equation system and apply the Newton-Raphson method for systems to solve the new system. Therefore, an iteration method was used to solve the problem for each time step. The Newton-Raphson system is represented by the following matrix equation:
𝐴(𝑥⃗𝑗)𝑦⃗ = −𝐹(𝑥⃗⃗⃗⃗) 𝑗
For each Newton-Raphson iteration, a set of linear equation needs to be solved. A partially-pivoted Gauss-Seidel method was used to solve the system.
This iteration method is applied until the chosen norm is lower than the tolerance and thus the molar concentrations for the next time-step are obtained. This procedure is used to solve the ODE system during combustion and expansion strokes.
2.4 ENGINE CONDITIONS
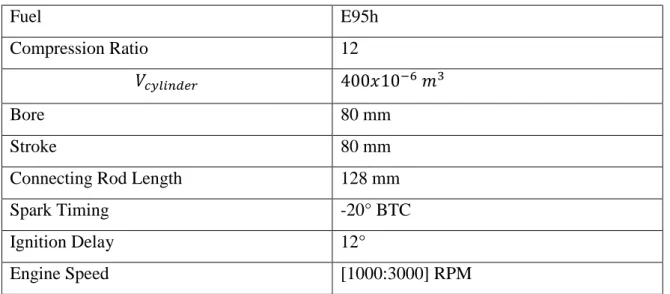
The simulations from the two-zone model required the definition of some specific engine variables, in order to calculate the P-V-T profiles for each engine condition studied. Additionally, the initial composition of the mixture of gases used as input on the kinetic model was also defined by the engine simulator, which calculated the molar fractions of this mixture based on a chemical equilibrium model. Table 2 shows the engine operation variables, which the thermodynamic engine model obtained the data used by the kinetics:
Table 2: Engine Operation Variables
Fuel E95h
Compression Ratio 12
𝑉𝑐𝑦𝑙𝑖𝑛𝑑𝑒𝑟 400𝑥10−6 𝑚3
Bore 80 mm
Stroke 80 mm
Connecting Rod Length 128 mm
Spark Timing -20° BTC
Ignition Delay 12°
Engine Speed [1000:3000] RPM
Braz. J. of Develop., Curitiba, v. 5, n. 8, p. 12607-12622 aug. 2019 ISSN 2525-8761 Stoichiometric Air-Fuel Ratio 9.0685 𝑘𝑚𝑜𝑙𝑎𝑖𝑟
𝑘𝑚𝑜𝑙𝑓𝑢𝑒𝑙
Actual Air-Fuel Ratio [0.8,1.2] 𝐴/𝐹𝑠𝑡𝑜𝑖𝑐ℎ𝑖𝑜𝑚𝑒𝑡𝑟𝑖𝑐
Engine Load 𝑃𝑎𝑑𝑚 = [0.4: 1.0]𝑃𝑚𝑎𝑥,𝑎𝑑𝑚
The analysis presented on this paper studied the influence of engine speed, actual air-fuel ratio and engine load (as a proportion of the maximum admission pressure on the intake manifold), such as described on Table 2.
3. RESULTS OF THE MODEL
The model, as previously commented, is based on a mixture of gases calculated from thermodynamic conditions found in the engine simulator model. This mixture had its origin from a mixture of air, fuel and residual gas, which reacted (combustion process) and a chemical equilibrium model was applied to calculate the molar fractions of the gases considered on this model. The chemical equilibrium model is a program associated with the two-zone thermodynamic engine simulator where the chemical kinetics model described on the methodology section will be added. The equilibrium is based on 12 chemical species. The conditions for the chemical equilibrium calculations, besides the number of moles obtained from these calculations depended on the actual air-fuel ratio used on the engine simulation.
The thermodynamic conditions of the model are obtained from the P-V-T data simulated by the engine model previously commented. These data are used in order to analyze the NO and CO formations in conditions similar to those found SI engines. The temperature profile comes from the burned zone, since it is on this region where the chemical reactions from combustion happen, while the volume profile is the total volume of the cylinder. Both of these profiles initiate from the beginning of the combustion process on the engine until a limit temperature on the expansion process defined by the user. This temperature adopted on this study was 1500K.
3.1 NITRIC OXIDE ANALYSIS
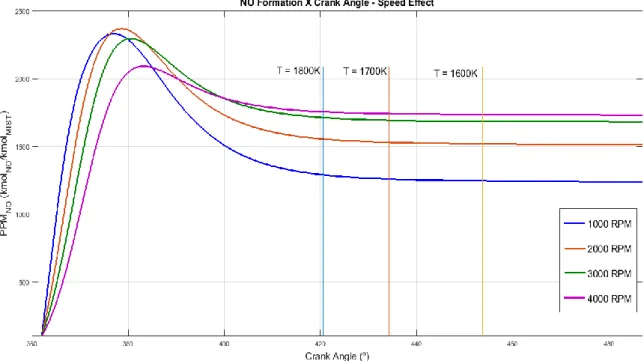
NO concentration curves were obtained from the application of the kinetic model under the P-V-T conditions calculated for each engine condition previously commented. Engine speed, air-fuel ratio and engine load were varied and their influence on nitric oxide concentration was presented on Figures 1, 2 and 3.
Braz. J. of Develop., Curitiba, v. 5, n. 8, p. 12607-12622 aug. 2019 ISSN 2525-8761 Figure 1 shows the effect of the engine speed on the formation of nitric oxide under simulated SI engine kinetic conditions. The data is presented on the combustion stroke after the top-dead center (TDC) until a certain position on the expansion stroke where the burned zone temperature reaches 1500K. It is noticed that NO concentration rises until it reaches a peak concentration, which happens some degrees after TDC. The changes of the peak position follow the temperature profile of each simulation case. During expansion process, the concentration of NO started to reduce, which indicates a consumption of NO by its reverse reactions considered on the model. This consumption continues until a freezing concentration is reached. Each of the curves had the NO concentration frozen at temperatures below 1800K, which may be explained by the negligible, reverse NO reactions at these temperatures.
Figure 1 also shows the effects of engine speed on NO formation. Higher speeds leaded to lower NO concentrations during late expansion process, although the peak reached was higher. This situation may be explained considering that higher engine speeds indicate lower reaction times for the NO mechanism to act. This affects both the peak NO concentration and the NO consumption after the peak. Analyzing the opposite situation, lower engine speeds provide more reaction time to the NO mechanism, which increases the NO peak concentration, although also allow a higher NO consumption after the peak. These results showed coherent tendencies with experimental results presented by Patterson [13], despite the different fuels considered in both cases.
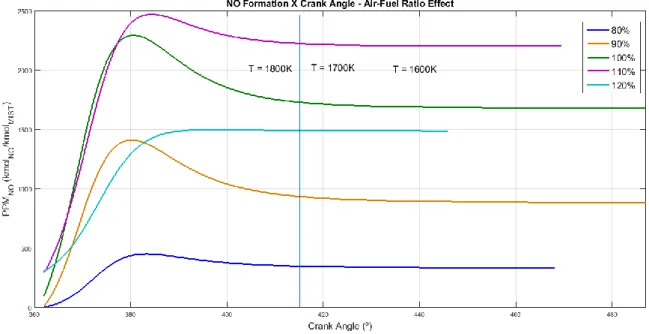
Braz. J. of Develop., Curitiba, v. 5, n. 8, p. 12607-12622 aug. 2019 ISSN 2525-8761 Figure 2 presents the air-fuel ratio effect on NO formation. Five cases were studied and the influences of the air-fuel ratio were analyzed. The concentration of NO under rich-fuel mixtures showed both lower peak NO and final NO concentrations when compared to stoichiometric cases. This is an indication of the low availability of 𝑂2 on the system, which is fundamental to the occurrence of the NO mechanism as can be noticed by the ninth reaction on Eq. (2). On stoichiometric conditions, the calculated NO concentration was higher. This occurs due to both higher peak temperature reached by the engine cycle and higher 𝑂2 concentration on the gas mixture. The curve with higher NO concentration on expansion process was the slightly lean-fuel case, since this situation provides both optimal temperature and 𝑂2 values to the mechanism to operate with high efficiency. The leanest case showed reduction on the NO concentration, with the disappearance of the NO peak. The absence of the peak indicates the lower temperature profile that this case reached, since the NO formation is strongly related to the maximum temperature reached by the engine [13]. Thus, on high lean-mixture cases the NO concentration on expansion process is expected to be lower than on nearly stoichiometric cases. On rich-mixture cases, it is also expected NO concentration to be lower than on stoichiometric cases. Therefore, the NO formation may be interpreted as a balance between the peak temperature of the process and the availability of oxygen gas on the mixture; both variables usually reach optimal conditions for NO formation on slightly lean combustion processes.
Braz. J. of Develop., Curitiba, v. 5, n. 8, p. 12607-12622 aug. 2019 ISSN 2525-8761 The engine load effect on NO concentrations is presented on Figure 3. The full load case presented the higher NO concentrations, both on peak and final moments. On 70% partial full load, the model provided a lower NO concentration profile, which is justifiable by the expected lower temperature profile obtained from the case, since the peak pressure reached by the case is lower and therefore the peak temperature is also lower. On 40% partial load, the lowest concentration is reached, where almost no peak was perceived on the curve. From these results it is noticed that partial engine load reduces the amount of NO formed and therefore the amount that will be emitted on the exhaust process.
Figure 3 - NO formation x Engine Crank Angle - Engine Load Effect
3.2 CARBON MONOXIDE ANALYSIS
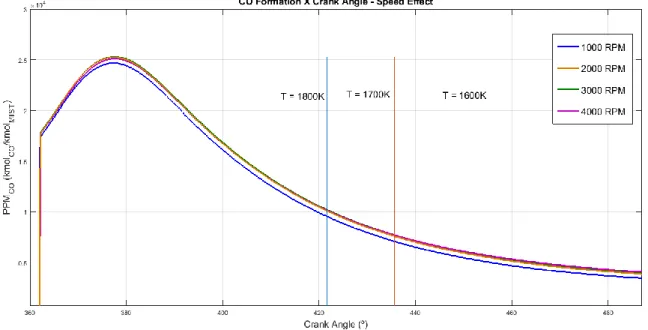
Such as the analyses presented for NO-formation, Figures 4, 5 and 6 present the CO concentration during combustion and expansion strokes until the burned temperature reaches 1500K. The curves presented on the figures show a peak of CO concentration after the TDC, when the burned zone temperature reaches its maximum. The intense reduction of CO concentration after the peak is evident, differently of NO case where at temperatures close to 1800K the concentration shows an asymptote tendency. This indicates a higher tendency to chemical equilibrium of CO mechanism than the NO mechanism, despite its concentration being higher than those calculated by chemical equilibrium models.
Braz. J. of Develop., Curitiba, v. 5, n. 8, p. 12607-12622 aug. 2019 ISSN 2525-8761 Figure 4 shows the effects of the engine speed on the CO formation. With exception of 1000 RPM, all the cases showed that CO concentration during the processes studied is almost independent of the engine speed. This behavior was commented by Patterson [13], where experimental results also showed that CO concentration does not depend on engine speed.
Figure 4 - CO formation x Engine Crank Angle - Engine Speed Effect
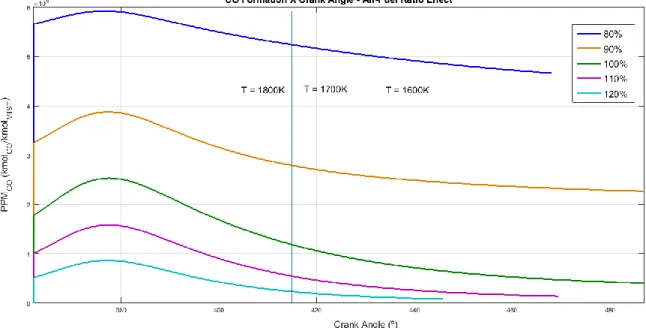
Figure 5 presents the results of Air-fuel ratio effect on the CO concentration profile. The analysis showed that on rich-fuel cases, the CO concentration tends to increase considerably. The incomplete combustion process that occurs explains this situation, with absence of enough 𝑂2 to oxidize completely the carbon monoxide into carbon dioxide. Thus the CO concentration is higher and 𝐶𝑂2 concentration is lower on rich-fuel cases. On lean-fuel cases, the opposite behavior occurs: CO concentration is lower than on stoichiometric and rich-mixtures. This behavior is justified by the higher 𝑂2 availability, which collaborates to complete combustion and therefore to complete oxidation of carbon monoxide in carbon dioxide. Thus, the leaner is the mixture, the lower will be the CO concentration on the expansion stroke in engines.
Braz. J. of Develop., Curitiba, v. 5, n. 8, p. 12607-12622 aug. 2019 ISSN 2525-8761
Figure 5 - CO formation x Engine Crank Angle - Air-Fuel Ratio Effect
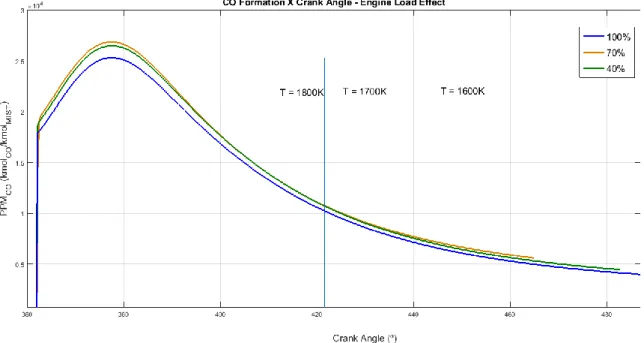
Figure 6 analyzed the effect of the engine load on the CO formation. There was little influence of engine load detected on the CO mechanism, especially in the middle of the expansion process. Since CO tends to follow chemical equilibrium concentrations more closely than NO, CO concentration followed the temperature profile of each case, due to its faster chemical reaction mechanism. This behavior is corroborated by [13], where experimental results showed no effect of engine load on CO formation.
Braz. J. of Develop., Curitiba, v. 5, n. 8, p. 12607-12622 aug. 2019 ISSN 2525-8761
Figure 6 - CO formation x Engine Crank Angle - Engine Load Effect
4. CONCLUSIONS
Based on the results presented on this paper, some conclusion about the kinetic model developed and the tendencies of each studied pollutant are presented:
The model was able to qualitatively predict the tendencies of nitric oxide and carbon monoxide formations under similar conditions as presented by a spark-ignited engine. The use of the P-V-T curves provided a coherent behavior on the formation and consumption of these pollutants during the simulated combustion and expansion strokes, with low computer time required to calculate the model. The amount of NO and CO concentrations indicated by the results showed similarity with the orders of magnitude presented on literature, although their results were obtained for gasoline or iso-octane as fuel, instead of ethanol.
The nitric oxide concentration profiles showed a tendency to a constant concentration during expansion process, when the burned zone temperatures reached values below 1800K. This nonequilibrium asymptotic behavior, such as commented by Spadaccini [3], indicates a possible assumption that would save computer time on future NO formation simulations, since the concentration does not change significantly. The carbon monoxide behavior during the cases studies presented a higher tendency to chemical equilibrium, when compared to nitric oxide behavior, although the values obtained were higher than a chemical equilibrium model would indicate at the same conditions.
Braz. J. of Develop., Curitiba, v. 5, n. 8, p. 12607-12622 aug. 2019 ISSN 2525-8761 The chemical kinetic model provided tendencies expected to the changes of important engine variables on the two-zone thermodynamic model. Variables such as engine speed, air-fuel ratio and engine load had their influence on pollutants formation evaluated and the presented tendencies on results were compared to literature experimental results, which showed a qualitatively agreement. This gives safe basis to apply the same model to study future applications on the engine simulator, such as the influence of EGR on the formation of the pollutants, the simulation of turbocharging or the development of two-stroke engines. These applications would be possible to simulate, avoiding the development of prototypes and therefore reducing the costs.
ACKNOWLEDGMENTS
The authors would like to express their gratitude to the partnership with the Group PSA Peugeot-Citroën. The authors also would like to express their gratitude to Fundação de Amparo à Pesquisa do Estado de São Paulo (FAPESP), for funding the process ’Pollutants formation simulation models (CO, NOx and HC) in ethanol engines’, FAPESP process number 2015/17041-7.
REFERENCES
[1] N. D. Brinkman, “Ethanol Fuel-A Single-Cylinder Engine Study of Efficiency and Exhaust Emissions,” in SAE Trans., 1981, vol. 90, no. 810345, pp. 83–97.
[2] M. E. Dias de Oliveira, B. E. Vaughan, and E. J. Rykiel Jr., “Ethanol as Fuel : Energy , Carbon Dioxide Balances , and Ecological Footprint,” Bioscience, vol. 55, no. 7, pp. 593–602, 2005.
[3] L. J. Spadaccini and W. Chinitz, “An Investigation of Nonequilibrium Effects in an Internal Combustion Engine,” J. Eng. Power, vol. 94, no. 2, p. 98, 1972.
[4] H. K. Newhall, “Kinetics of engine-generated nitrogen oxides and carbon monoxide,” Symp. Combust., vol. 12, no. 1, pp. 603–613, Jan. 1969.
[5] W. J. D. Annand, “First Paper: Effects of Simplifying Kinetic Assumptions in Calculating Nitric Oxide Formation in Spark-Ignition Engines,” Proc. Inst. Mech. Eng., vol. 188, no. 1, pp. 431–436, Jun. 1974.
Braz. J. of Develop., Curitiba, v. 5, n. 8, p. 12607-12622 aug. 2019 ISSN 2525-8761 practice, 1st ed. John Wiley & Sons, 2003.
[7] R. L. Burden and A. G. Faires, Numerical Analysis, 9th ed. Cencage Learning, 2013. [8] R. J. B. Way, “Methods for Determination of Composition and Thermodynamic Properties of Combustion Products for Internal Combustion Engine Calculations,” Proc. Inst. Mech. Eng., vol. 190, no. 1, pp. 687–697, Jun. 1976.
[9] W. Tsang and R. F. Hampson, “Chemical Kinetic Data Base for Combustion Chemistry. Part I. Methane and Related Compounds,” J. Phys. Chem. Ref. Data, vol. 15, no. 3, pp. 1087–1279, Jul. 1986.
[10] D. L. Baulch et al., “Evaluated Kinetic Data for Combustion Modelling,” J. Phys. Chem. Ref. Data, vol. 21, no. 3, pp. 411–734, May 1992.
[11] V. Lissianski, H. Yang, Z. Qin, M. R. Mueller, K. S. Shin, and W. C. Gardiner, “High-temperature measurements of the rate coefficient of the H + CO2 => CO + OH reaction,” Chem. Phys. Lett., vol. 240, no. 1, pp. 57–62, 1995.
[12] M. V. K. Raggi, “Modelagem da Cinética Química de Formação de NOx e CO em Motores de Ignição por Centelha,” PUC MG, 2005.
[13] D. J. Patterson, Emissions from combustion engines and their control, 1st ed. Ann Arbor: Ann Arbor Science Publishers, 1972.