*Correspondence: O. Fatibello-Filho. Centro de Ciências Exatas e de Tecno-logia, Departamento de Química, Universidade Federal de São Carlos. Caixa postal 676, 13.560-970 - São Carlos - SP, Brasil. E-mail: bello@ufscar.br
Article
vol. 48, n. 4, oct./dec., 2012
Square-wave voltammetric determination of rutin in
pharmaceutical formulations using a carbon composite electrode
modified with copper (II) phosphate immobilized in polyester resin
Kellen Heloizy Garcia Freitas
1, Orlando Fatibello-Filho
2,*, Ivanildo Luiz de Mattos
31Department of Chemistry, Federal University of Pará, 2Department of Chemistry, Federal University of São Carlos, 3Department of Chemistry of Materials, University of Chile
A carbon composite electrode modified with copper (II) phosphate immobilized in a polyester resin (Cu3(PO4)2-Poly) for the determination of rutin in pharmaceutical samples by square-wave voltammetry
is described herein. The modified electrode allows the determination of rutin at a potential (0.20 V vs. Ag/
AgCl (3.0 mol L-1 KCl)) lower than that observed at an unmodified electrode. The peak current was found
to be linear to the rutin concentration in the range from 9.9 × 10⁻⁸ to 2.5 × 10⁻⁶ mol L-1, with a detection
limit of 1.2×10⁻⁸ mol L-1. The response of the electrode was stable, with no variation in baseline levels
within several hours of continuous operation. The surface morphology of the modified electrode was characterized by scanning electron microscopy (SEM) and energy dispersive X-ray (EDX) system. The results obtained are precise and accurate. In addition, these results are in agreement with those obtained by the chromatographic method at a 95% confidence level.
Uniterms: Rutin/determination in pharmaceuticals samples. Square-wave voltammetry/determination
of rutin. Modified carbon composite electrode/application.
Descreve-se um eletrodo de carbono modificado com fosfato de cobre (II) imobilizado em uma resina de poliéster (Cu3(PO4)2-Poly) para a determinação de rutina em amostras farmacêuticas por
voltametria de onda quadrada. O eletrodo modificado permite a determinação de rutina em potencial (0.20 V vs Ag / AgCl (3,0 mol L-1 KCl)) menor que o observado em um eletrodo não modificado.
Verificou-se que a corrente de pico foi linear com a concentração de rutina na faixa de 9,9 × 10⁻⁸ a
2,5 × 10⁻⁶ mol L-1, com um limite de detecção de 1,2 × 10⁻⁸ mol L1. A resposta do eletrodo foi estável, sem
variação significativa dentro de várias horas de operação contínua. A morfologia da superfície do eletrodo modificado foi caracterizada por microscopia eletrônica de varredura (MEV) e pelo sistema de energia dispersiva de raios-X (EDX). Os resultados obtidos foram precisos e exatos. Ademais, estes resultados estão de acordo com aqueles obtidos pelo método cromatográfico a um nível de confiança de 95%.
Uniterms: Rutina/determinação em amostras farmacêuticas. Voltametria de onda quadrada/determinação de rutina. Eletrodo compósito de carbono modificado/aplicação.
INTRODUCTION
Rutin (C27H30O16) is one of the most abundant flavo
-noids in the human diet (He, 2007) and concerns the kind of flavonoids, glycoside, commonly found in plants such
as Flos Sophorae buds and others species of plants (Chen
et al., 2000; Xu, 2007). Rutin is also founded in orange,
grapefruit, lemon, berries and so forth (Packer, 2001). It has been widely used as a therapeutic agent and more than
130 preparations containing rutin are registered as drugs
worldwide (Dapkevicious et al., 1999; Erlund, 2000).
Some related investigations show that rutin has a broad range of biological activities, such as anti-inflammatory, anti-tumor and anti-bacterial (Gene et al., 1996; Nueng-chamnong et al., 2004).
Due to its importance, several methods for rutin
de-termination based on spectrophotometry (Li et al., 2005),
et al., 2003), and electrochemistry (Franzoi et al., 2009; Santos et al., 2008; Xu, 2007), have been reported. Elec
-trochemical techniques can be used as alternative methods for the determination of rutin because they are simple, fast, and low-cost. Among these, square-wave voltammetry (SWV) was proved to be extremely sensitive for the detec
-tion of organic molecules, with low non-Faradaic current, high sensitivity and very low detection limit (Freitas et al.,
2010; Freitas, 2010).
The sensitivity, selectivity and operational stabil
-ity of electrochemical analysis can be enhanced using chemically modified electrodes (CMEs) (Pereira et al.,
2002). CMEs have attracted a lot of attention due to the possibility of modifying the electrode surface including composite generation, polymer coating, and so forth. The modification of carbon paste or composite electrodes is an attractive research area in analytical chemistry with potential applications in electroanalysis and chemi
-cal sensors (Fatibello-Filho et al., 2000; Freitas et al.,
2009; Pereira et al., 2002). The introduction of different
compounds into the carbon paste or composite electrode
has been demonstrated during in the analysis of numer
-ous organic and inorganic compounds. In recent years,
molecular recognition at the surface of solid materials
has attracted interest of researchers who are trying to
develop functional materials for chemical sensors. The
use of nanoparticles, including carbon nanotubes, shows a trend toward improving the applicability (Liu et al., 2010; Yang et al., 2010).
Brett and co-workers studied the electro-oxidation of rutin (Ghica et al., 2005), quercetin (Brett et al.,
2003), and catechin (Janeiro et al., 2004) using different
voltammetric techniques, and revealed that the various hydroxyl groups of these compounds can be oxidized in different cyclic voltammetric peaks by
adsorption-involved and pH-dependent transitions. The oxidation
mechanisms are very complex due to the formation of multiple products (He et al., 2007; He, 2007). Volikakis
and Efstathiou (2000) examined the possibility of de
-termining twelve flavonoids using adsorptive stripping voltammetry in a flow injection system. In their study, carbon paste electrodes based on mixtures of Nujol-graphite and diphenylether-Nujol-graphite were used. Zu et al.
(2006) identified flavanols in leaves by HPLC with diode array detection (DAD).
In the present work, we describe a simple, fast and low-cost square-wave voltammetric method for the deter
-mination of rutin in pharmaceutical samples. A modified carbon composite electrode (MCCE) with copper (II) phosphate immobilized in a polyester resin (Cu3(PO4)2
-Poly) was used for this task.
EXPERIMENTAL
Apparatus
All voltammetric measurements were carried out in a single-compartment glass cell with a three electrodes system and degassing facilities for bubbling N2. A
modi-fied carbon composite electrode (MCCE) with copper (II) phosphate immobilized in a polyester resin (Cu3(PO4)2
-Poly) was used as working electrode, Ag/AgCl (3 mol L-1
KCl) as reference electrode, and platinum wire as auxiliary electrode. Square wave and cyclic voltammetric measure
-ments were performed using AUTOLAB PGSTAT-30 (Ecochemie) potentiostat/galvanostat controlled with the GPES 4.0 software.
Physical characterization and electrode surface composition were investigated using a Philips model XL30 TMP scanning electron microscopy (SEM) with energy dispersive X-ray (EDX) system. The equipment was calibrated with metallic nickel.
HPLC was used as the comparative method for the determination of rutin, which was performed using a LC-10AT Shimadzu system, with an UV/Vis detector (SPD-M10-AVP) set at the wavelength of 257 nm. A Shim-Pack CLC-ODS (60 µm x 150 mm, 5 µm) chromatographic col
-umn was used. The mobile phase consisted of a methanol/ acetonitrile/water (40/15/45, v/v/v) solution containing 1.0% v/v formic acid at a flow-rate of 1.0 mL min-1, while
the injection volume was 30 µL.
Reagents and solutions
All solutions were prepared using ultra-purified water supplied by a Milli-Q system (Millipore®) with resistivity equal to or higher than 18 MΩcm. All chemicals used such
as sodium phosphate, sodium nitrate, potassium nitrate, sodium chloride, potassium chloride, and phosphoric acid
(Merck, Germany), were of analytical reagent grade. Meth
-ylethylketone peroxide (MEK peroxide) was purchased from Ibere, Ramires and Cia (Taboão da Serra, SP) and, rutin, graphite powder (1-2 µm), and solid paraffin were purchased from Sigma-Aldrich. Polyester resin (Resapol T-208) was acquired from Reichhold (Mogi das Cruzes, SP). Phosphate buffer solutions (pH range between 4 and 9), sodium nitrate, potassium nitrate, sodium chloride, and potassium chloride were prepared for the study of the sup
-porting electrolyte in several concentrations.
Rutin working standard solutions (9.9 × 10⁻⁸ to
2.5 × 10⁻⁶ mol L-1) were freshly prepared by dilution of
a 1.0 ×10⁻⁴ mol L-1 rutin stock solution in supporting
Immobilization of Cu3(PO4)2 in polyester resin and preparation of the electrode
Cu3(PO4)2(S) was prepared by reacting CuCO3.
Cu(OH)2 with concentrated phosphoric acid. The im
-mobilization of Cu3(PO4)2 was performed using a poly
-ester resin and methylethylketone peroxide as a catalyst. Graphite powder (1-2 μm particle size; Aldrich) and solid paraffin (Aldrich), both of high purity, were used in the
preparation of carbon composite.
The immobilization of Cu3(PO4)2 in polyester resin
(Cu3(PO4)2-Poly) was achieved using a method similar to
that proposed by Pereira and Fatibello-Filho (1998). Five grams of polyester resin were mixed with five grams of
Cu3(PO4)2(S) and 0.3 mL of methylethylketone peroxide
(catalyst). A rigid solid was obtained after three hours, which was initially broken with a hammer and then ground in a Tecnal multiuse mill, model TE 631/1 (Piracicaba, Brazil). Particles smaller than 100 μm were selected by sieving on a known mesh sieve.
The MCCE with (Cu3(PO4)2-Poly)used as working
electrodewas prepared according to the building method
proposed by Freitas and Fatibello-Filho (2010). In these studies, the graphite: solid paraffin compositions of 75:20,
70:20, 65:20, 60:20, 55:20, 50:20, 45:20, 40:20 and 20:20
(% m/m), and the Cu3(PO4)2-Poly percentages of 5, 10,
15, 20, 25, 30, 35, 40, and 60% m/m relating to the total mass of the carbon composite, were evaluated. The car
-bon composite electrode was initially prepared by mixing 0.40g of (Cu3(PO4)2-Poly) (40%, m/m), 0.40g of graphite
powder (40%, m/m), and 0.20 g of melted paraffin (20%, m/m) at 60 oC.
The resulting modified carbon composite was placed in a 1 mL plastic syringe and a copper wire was inserted to obtain external electric contact. A unmodified carbon com
-posite electrode (UCCE) containing 80% (m/m) graphite and 20% (m/m) solid paraffin was prepared for the purpose of comparing with a modified electrode containing 40% (m/m) Cu3(PO4)2-Poly.
Cyclic voltammetry and square wave measurements were performed in 0.10 mol L-1 phosphate buffer solution
containing 10% (v/v) ethanol (conditional pH of 6.9), and the experiments were carried out by applying a potential sweep between 0.00 and 0.55 V for cyclic voltammetry and -0.05 and 0.50 V for square wave voltammetry.
Sample solution preparation
Samples (solid and liquid) were purchased at local pharmacies. 10 tablets of solid sample were triturated and mixed and 122 mg of powder were dissolved in 10 mL of
0.1 mol L-1 phosphate buffer solution containing 10% (v/v)
ethanol (conditional pH of 6.9). Then, 100 µL aliquot of
this solution was transferred to the electrochemical cell containing 5 mL of this supporting electrolyte.
An aliquot of 500 µL of liquid sample was trans
-ferred to a 10 mL volumetric flask and diluted with 0.1 mol L-1 phosphate buffer solution containing 10% (v/v)
ethanol (conditional pH of 6.9). Then, similarly, 100 µL
aliquot of this solution was transferred to the electrochemi
-cal cell containing 5 mL of supporting electrolyte. The SW voltammograms were obtained after each aliquot addition.
Statistics
All experiments were carried out in triplicate. All
data are presented as means ± SD. Student’s t-test at a
95% confidence level was used. P<0.05 was considered
a significant result.
RESULTS AND DISCUSSION
Effect of electrode composition
The effect of the carbon composite composition on
the voltammetric profiles of a 5.0 × 10⁻⁶ mol L-1 rutin in
0.1 mol L-1 phosphate buffer solution containing 10% (v/v)
of ethanol (conditional pH of 6.9) was initially evaluated. The analytical signal (peak currents) increased with increasing amount of chemical modifier up to 40% (m/m).
For Cu3(PO4)2 amounts higher than 40% (m/m), the analyt
-ical signal decreased significantly (results not shown). This event occurred owing to a decrease in the graphite powder content in the composite and the consequent reduction of the conductive electrode area. The highest quality carbon composite structure was found for an electrode composi
-tion of 40% (m/m) Cu3(PO4)2-polyester resin, 40% (m/m)
graphite, and 20% (m/m) solid paraffin.
Electrode surface characterization
The modification of electrodes with functional groups, inorganic or biologic catalyst, polymeric films etc.,
has improved the performance of electrochemical
elec-trode in analytical chemistry. These changes may increase the electrode characteristics such as selectivity, sensitivity and/or operational stability. In this sense, it is fundamental the surface characterization of the electrode surface.
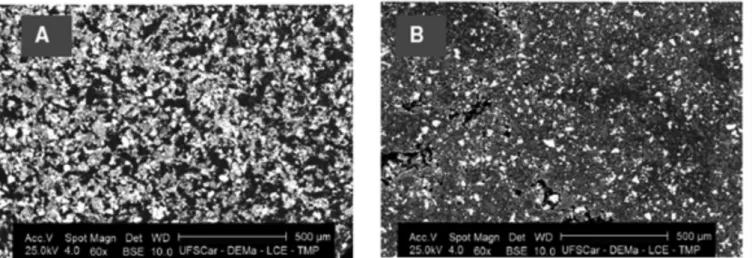
Figure 1 shows the scanning electron micrographs (SEMs) of the modified electrode with Cu3(PO4)2 before
and after use of the electrode in one hundred of
(BSE) allowed the chemical contrast of the electrode
surface; the clearest points indicate the chemical
ele-ment of higher density, which can be related to copper. In this Figure, it can be seen that the electrode surface is uniform and presented little porous showing a very good homogenization of the components. Thus, this electrode can be classed as dispersion composite in accordance with Cespedes and co-workers (1996) due to conducting mate
-rial is randomly distributed in the electrode surface. After using the electrode for rutin determination in 0.1 mol L-1
phosphate buffer solution (conditional pH 6.9) containing 10% (v/v) of ethanol, the electrode shows regularity of the surface, despite with lower amount of material (compare both images). The final profile, with regularity, can repre
-sent suitable operational stability.
Results obtained from EDX (results not shown)
indicated that the composition percentage of Cu3(PO4)2
onto the surface of electrode was 38.2% (m/m), slightly lower than the 40% (m/m) used in the preparation of the carbon composite. Moreover, the oxygen content was kept constant even after high number of determinations,
indicating that the oxide formation in the electrode surface
was not favored, resulting in an extraordinary stability and
extended lifetime of the electrode.
Effect of supporting electrolyte
The voltammetric behavior of the modified carbon composite electrode was investigated in five different sup
-porting electrolytes (phosphate buffer, sodium nitrate, po
-tassium nitrate, sodium chloride, and po-tassium chloride) in several concentrations by cyclic voltammetry (Figure 2). The presence of the voltammetric peak was observed in all these supporting electrolytes. Moreover, in phosphate
buffer solution the anodic peak current was higher and the peak shape was better defined. Therefore, this buffer solution was selected for further experiments.
The catalytic action of copper has been reported to be the result of Cu(II)/Cu(I) at very high positive poten
-tial, or Cu(III)/Cu(II) redox system and a discussion of the potentialities of this redox system has been discussed by Freitas and Fatibello-Filho (2010). Furthermore, some
studies have described the influence different factors,
such as supporting electrolyte, concentration and pH of supporting electrolyte, number of donor atoms of the analyte, redox potential of the analyte and voltammetric
FIGURE 1 - SEM micrographs of MCCE-Cu3(PO4)2 surface (A) before and (B) after rutin voltammetric determination in 0.1 mol
L-1 phosphate buffer/10% ethanol (v/v) (pH
cond 6.9); BSE detector; scale: 500 µm; zoom 60 times.
FIGURE 2 – Effect of supporting electrolyte using MCCE-Cu3(PO4)2 for 4.0 × 10⁻⁵ mol L-1 rutin in (a) phosphate buffer; (b)
potassium nitrate; (c) sodium nitrate; (d) sodium chloride and (e) potassium chloride solutions. Concentration of electrolyte
solutions: 0.1 mol L-1/10% ethanol (v/v) (pH
parameters, which affect the Cu(II)/Cu(I) couple and/or analytical signal (Domenech et al., 2000; Somasundrum
et al., 1996; Vazqueza et al., 1994).
In our study, the voltammetric response of the modi
-fied carbon composite electrode with (Cu3(PO4)2-Poly
was not affected by the concentration of the supporting electrolyte. The 0.10 mol L−1 phosphate buffer solution was chosen to further experiments.
Effect of pH
The analytical response of MCCE with Cu3(PO4)2
-Poly (40% m/m) was studied over a wide pH range be
-tween 4 to 9 using phosphate buffer solution in the pres -ence and abs-ence of 4.0 × 10⁻⁵ mol L-1 rutin (results not
shown). The peak current increased with increasing pH
from 4.0 to 7.0, but decreased at pH greater than 7.0, fact
attributed to the formation of copper(II) hydroxide at the electrode surface (eq. 1).
Cu3(PO4)2 (es) + 6 OH− 3Cu(OH)2(es) + 2 PO43− (1)
Since the best definition of peak and maximum analytical response were obtained at pH 6.9, this pH was chosen for optimization of other variables and for the analytical determination of rutin.
Electrochemical characteristics
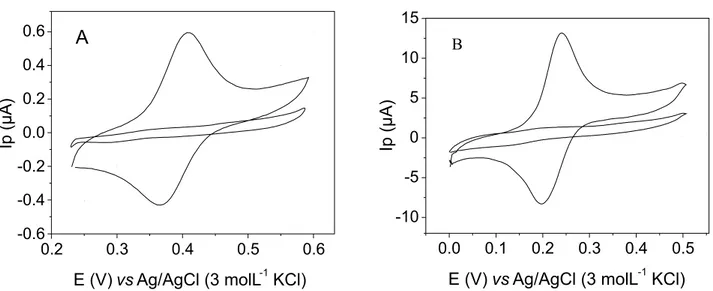
Figure 3 shows the cyclic voltammograms obtained using an unmodified carbon composite electrode (UCCE) (A) and a modified carbon composite electrode with
Cu3(PO4)2-Poly (40% m/m)(MCCE)(B) in the absence
FIGURE 3 - Cyclic voltammograms obtained with (A) UCCE; (B) MCCE-Cu3(PO4)2 in the absence and presence of 4.0 × 10
-5 mol L-1
rutin in 0.1 mol L-1 phosphate buffer/10% ethanol (v/v) (pH
cond 6.9); scan rate of 50 mVs
-1.
and in the presence of 4.0 × 10⁻⁵ mol L-1 rutin. It can be seen
from these voltammograms that the current peak obtained with MCCE was much higher than that obtained using UCCE (20 times higher) with a decrease of over potential of about 150 mV (from 400 mV to 250 mV), indicating the existence of an electrocatalytic process. Moreover, the signal/noise was improved at the modified electrode and the possibility from interference of electroactive species present in the sample matrix of interest may be lower.
The MCCE- Cu3(PO4)2 presented a reversible
be-havior for rutin, once presented a ratio of peak currents, (Iap/Icp) equal to one and a separation of peak potentials,
Epa - Epc (∆Ep) equal to 56 mV, according to the accepted
theory of cyclic voltammetric (Brett et al., 1993).
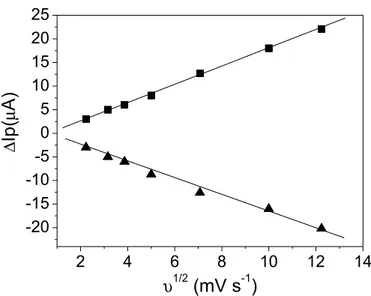
A linear plot of the peak current vs. the square root
of scan rate was obtained, with a 0.999 correlation coef
-ficient for both anodic and cathodic peak, indicating that the rutin oxidation and reduction process was controlled by diffusion (Figure 4) (Brett et al, 1993; Scholz, 2002).
The Epvs pH study shows a linear plot with slope
of 29.6 mV pH-1 (Figure 5 A) indicating that two elec
-trons were involved in the oxidation process at electrode surface. It can also be calculated the electron number involved in the rutin oxidation applying the SWV theory (Krause, 1969; Mirceski et al., 2007; Osteryoung et al.,
1985; Ramaley, 1969); which ∆Epvs ∆log f (logarithm of
frequency) for reversible systems is linear in agreement with equation 2.
∆Ep/∆log f = - 2.3 RT/2nF (2)
-ber of was obtained as 2. This result confirms the results
obtained in the Epvs pH study (Figure 5A).
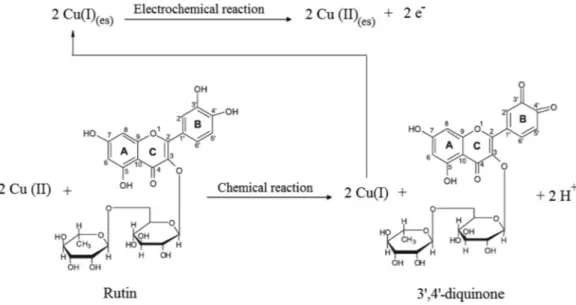
Thus, considering the Ep vs pH study and the theory
developed for the SWV (Krause, 1969; Mirceski et al.,
2007; Osteryoung et al., 1985; Ramaley, 1969) for revers
-ible systems, a plaus-ible mechanism for the voltammetric
response of the proposed electrode for rutin is postulated.
This mechanism is based on two processes outlined in Figure 6. Initially, a chemical oxidation of the 3’,4’-di
-hydroxy substituent on the B-ring of rutin by Cu(II) at
electrode surfacewith the formation of 3’,4’-diquinone
FIGURE 4 - Dependence of the peak current vs square root of the scan rate in supporting electrolyte in the presence of
4.0 × 10⁻⁵ mol L−1 rutin; () anodic peak current and () cathodic peak current. ∆Ip = value of anodic or cathodic peak current subtracted from the value of blank peak current.
and 2 H+ (H
3O+) and Cu(I) was observed, followed by an
electrochemical process of oxidation of Cu(I) to Cu(II).
Optimization of SWV parameters and analytical characteristics
The peak current obtained in square-wave voltam
-metry depends on various instrumental parameters such as the square-wave frequency (f), scan increment (∆Es) and
square-wave amplitude (a). These parameters are inter
-related and have a combined influence on peak current response. The influence of these instrumental parameters on the peak current response of 4.0 × 10⁻⁵ mol L-1 rutin in
0.10 mol L-1 phosphate buffer/10% ethanol (v/v) (condi
-tional pH 6.9) was investigated. Table I shows the SWV
parameters studied and the optimum values obtained for
rutin determination. A baseline increase was observed when the frequency was increased. Thus, a f value of 50 s-1
was selected for all determinations due to a stable baseline
and higher voltammetric signal obtained.
Pulse amplitude (a) is another parameter that strong
-ly influences the peak current in square-wave voltamme
-try. A better voltammetric definition of peak current was
observed in a value of 40 mV, which was chosen for the
subsequent analytical applications.
The effective rate of potential variation in square-wave voltammetry is the product between f and ∆Es. The
latter parameter will also increase the signal and, therefore, the sensitivity of the technique (Mirceski et al., 2007;
Os-teryoung et al., 1985). However, for large values of ∆Es,
a broadening of the peaks may occur, thus diminishing the resolution of the determinations. In this work, for the analytical applications, ∆Es was set at 1 mV.
FIGURE 6 - Proposed mechanism for the determination of rutin at MCCE-Cu3(PO4)2 electrode surface.
TABLE I - Investigated square wave voltammetry (SWV) parameters and their optimum values for the determination of rutin
Rutin
Parameter Studied range Optimum value
SW frequency (f) 10 – 100 s-1 50 s-1
SW amplitude (a) 10 – 100 mV 40 mV
Scan increment (∆Es) 1 – 5 mV 1 mV
TABLE II - Results of recoveries of rutin standard solution in pharmaceuticals using the proposed electrode
Sample Rutin (mg L
-1)
Recovery %
Added Found
A
2.30 2.37 ± 0.07 103
3.50 3.48 ± 0.06 99.4
5.20 5.41 ± 0.09 104
B
2.30 2.26 ± 0.03 98.2
3.50 3.50 ± 0.04 100
5.20 5.19 ± 0.05 99.8
n = 3
The effect of several species, such as sodium
sac-charine, methylparaben, starch, calcium carbonate and magnesium stearate using the MCCE- Cu3(PO4)2 electrode
in the presence of 4.0 × 10⁻⁶ mol L-1 rutin solution in the
supporting electrolyte was evaluated in 1:1 and 10:1 con
-centration ratio (interference species: rutin).
Addition-recovery experiments were also per
-formed, and the results (Table II) show that average recoveries varied from 98.2 to 104%, demonstrating the accuracy of the proposed method. It is important to note
that the concomitants present in this sample did not cause
important matrix interferences for the samples analyzed by the proposed method.
Under optimized conditions shown in Table I, the
SW voltammograms for different rutin concentrations
were obtained and are presented in Figure 7. As shown in the insert of this Figure, the analytical curve was
linear in rutin concentration range from 9.9 × 10⁻⁸ to
2.5 × 10⁻⁶ mol L-1, with a detection limit (three times the stan
-dard deviation of signal blank/slope) of 1.2 × 10⁻⁸ mol L-1.
The linear regression equation was: (ΔIpa/A) = 7.36 × 10⁻⁷
+ 5.40 [Rutin], r = 0.9994), where ΔIpa is the analytical signal minus the background current and [Rutin] is rutin concentration in mol L-1.
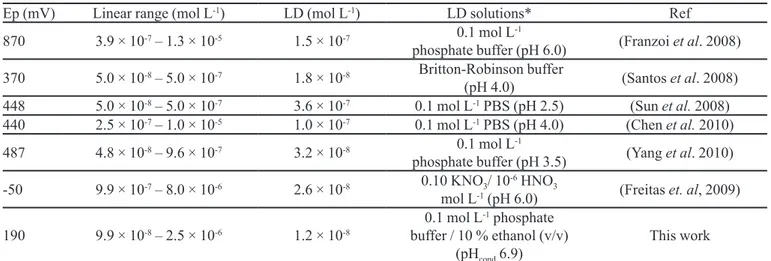
Table III shows the analytical characteristics such as work potential (mV), linear range of the analytical curve (mol L-1) and the limit of detection (mol L-1) of the elec
-trode described in this work in relation to those elec-trodes reported in the literature (Franzoi et al., 2008; Santos et al., 2008; Sun et al., 2008; Chen et al., 2010; Yang et al., 2010;
Freitas et al., 2009). As can be observed from this Table,
the proposed electrode exhibited a low working potential relation to those reported in the literature, an analytical calibration curve for the low concentration range, detec
-tion limits lower than those reported in this Table. On a comparison with our previous studies for rutin
determination in pharmaceutical formulations using a
cation-exchange resin) (Freitas et al., 2009), the pres
-ent study offered some advantages, such as: the higher
concentration of linear range, extended lifespan of 15
months (around 2,000 determinations), and simple build
-ing method (fewer stages of fabrication of electrode) what also imply less total cost of the method proposed.
The repeatability (n = 10) and reproducibility (five different days) were determined by using a standard so -lution of rutin, 4.0 × 10⁻⁵ mol L-1. Between each voltam
-metric measurement, the surface of the electrode was not renewed. The relative standard deviations were less than 1% and 2%, respectively.
Analysis of pharmaceutical formulations
Table IV shows the results obtained using a HPLC,
comparative method for the determination of rutin in pharmaceutical formulations, the proposed voltammetric method and label value. The statistical calculations for the
assay results showed good accuracy of the method accord
-ing to the t-test (texp = 2.234 < tlabel= 2.571). Thus, there are
no significant differences between the results obtained by either procedure at the 95% confidence level, indicating
FIGURE 7 - (A) SW voltammograms for various concentrations
of rutin; (a) supporting electrolyte; (b) 9.97 × 10⁻⁸; (c)
5.34 × 10⁻⁷; (d) 7.86 × 10⁻⁷; (e) 1.03 × 10⁻⁶; (f) 1.26 × 10⁻⁶;
(g) 1.50 × 10⁻⁶; (h) 1.70 × 10⁻⁶; (i) 1.91 × 10⁻⁶; (j) 2.12 × 10⁻⁶;
(k) 2.32 × 10⁻⁶ mol L-1; (l) 2.50 × 10⁻⁶ mol L-1; using
MCCE-Cu3(PO4)2 in 0.1 mol L-1 phosphate buffer/10% ethanol (v/v)
(pHcond 6.9); the inset presents the analytical curve.
TABLE III - Values of work potential, linear range and limit of detection obtained in several voltammetric methods
Ep (mV) Linear range (mol L-1) LD (mol L-1) LD solutions* Ref
870 3.9 × 10⁻⁷ – 1.3 × 10⁻⁵ 1.5 × 10⁻⁷ 0.1 mol L
-1
phosphate buffer (pH 6.0) (Franzoi et al. 2008)
370 5.0 × 10⁻⁸ – 5.0 × 10⁻⁷ 1.8 × 10⁻⁸ Britton-Robinson buffer
(pH 4.0) (Santos et al. 2008)
448 5.0 × 10⁻⁸ – 5.0 × 10⁻⁷ 3.6 × 10⁻⁷ 0.1 mol L-1 PBS (pH 2.5) (Sun et al. 2008)
440 2.5 × 10⁻⁷ – 1.0 × 10⁻⁵ 1.0 × 10⁻⁷ 0.1 mol L-1 PBS (pH 4.0) (Chen et al. 2010)
487 4.8 × 10⁻⁸ – 9.6 × 10⁻⁷ 3.2 × 10⁻⁸ 0.1 mol L
-1
phosphate buffer (pH 3.5) (Yang et al. 2010)
-50 9.9 × 10⁻⁷ – 8.0 × 10⁻⁶ 2.6 × 10⁻⁸ 0.10 KNO3/ 10-6 HNO3
mol L-1 (pH 6.0) (Freitas et. al, 2009)
190 9.9 × 10⁻⁸ – 2.5 × 10⁻⁶ 1.2 × 10⁻⁸
0.1 mol L-1 phosphate
buffer / 10 % ethanol (v/v)
(pHcond 6.9)
This work
Ep = work potential; LD = Limit of detection; Ref = Reference; LD solutions* = solutions where the limit of detection was
estimated; PBS = phosphate buffer saline
TABLE IV - Determination of rutin in pharmaceutical formulations by voltammetric and HPLC methods
Sample Rutin Relative error %
Label value HPLC SWV Er1% Er2%
A 300 299 ± 2 306 ± 1 + 2.0 +2.3
B 20.0 19.9 ± 0.2 19.7 ± 0.2 -1.5 -1.0
n = 3; confidence level of 95%; A = mg of rutin per tablet; B = mg of rutin per milliliter; Er1% = voltammetric method versus label
that the modified carbon composite electrode is suitable
for the determination of rutin in pharmaceuticals.
CONCLUSIONS
The modified carbon composite electrode with
Cu3(PO4)2 immobilized in a polyester resin showed to be
a very suitable method for the determination of rutin in
real samples. The use of less positive electrode potential
improved the applicability of the proposed method.
The proposed method is versatile, robust and
environmentally-friendly since it requires the use of im
-mobilized material. It is an interesting strategy for avoid
-ing or minimiz-ing environmental contamination. In view of the low-cost of the proposed method, it is feasible for large-scale analysis and/or for quality assurance of phar -maceutical formulations, drugs, food, and other samples.
The results obtained using the proposed
MCCE-Cu3(PO4)2 electrode for determination of rutin in
phar-maceutical samples are in close agreement with those obtained using the HPLC method at a 95% of confidence level, showing its practical feasibility.
Moreover, the proposed method offers the advan
-tages of reliability, simplicity of the fabrication of modified electrode, good precision, and low cost.
ACKNOWLEDGMENTS
The authors gratefully acknowledge financial sup
-port from Brazilian foundations (FAPESP, CAPES, CNPq and Mobility Academic Program-Teachers scale (AUGM).
REFERENCES
BRETT, A.M.O.; BRETT, C.M.A. Electroquímica: princípios,
métodos e aplicações. New York: Oxford University Press,
1993. 471 p.
BRETT, A.M.O.; GHICA, M.E. Electrochemical oxidation of
quercetin. Electroanal., v.15, p.1745-1750, 2003.
CESPEDES, F.; MARTINEZ-FABREGAS, E.; ALEGRET, S. New materials for electrochemical sensing-rigid conducting
composites. Trac-. Trends Anal. Chem., v.15, p.296-304, 1996.
CHEN, G.; ZHANG, H.; YE, J. Determination of rutin and quercetin in plants by capillary electrophoresis with
electrochemical detection. Anal. Chim. Acta, v.423, p.69-76, 2000.
CHEN, X.; WANG, Z.; ZHANG, F.; ZHU, L.; LI, Y.; XIA, Y.
Determination of rutin on the poly(p-aminobenzene sulfonic
acid) modified glassy carbon electrode. Chem. Pharm. Bull.,
v.58, p.475-478, 2010.
DAPKEVICIOUS, A.; BEEK, T.A.V.; NIEDERLANDER, H.A.G.; GROOT, A.D. On-Line detection of antioxidative activity in High-Performance Liquid Chromatography
eluates by chemiluminescence. Anal. Chem., v.71,
p.736-740, 1999.
DOMENECH, A.; GARCIA-ESPANA, E.; LUIS, S.V.; MARCELINO, V.; MIRAVET, J.F. Electrochemistry of copper complexes with polyaza[n]paracyclophanes. Influence of ATP as an exogen ligand on the relative stability
of the Cu(II) and Cu(I) oxidation states. Inorg. Chim. Acta,
v.299, p.238-246, 2000.
ERLUND, I.; KOSONEN, T.; ALFTHAN, G.; MÄENPÄÄ, J.; PERTTUNEN, K.; KENRAALI, J.; PARANTAINEN, J.; ARO, A. Pharmacokinetics of quercetin from quercetin
aglycone and rutin in healthy volunteers. Eur. J. Clin.
Pharmacol., v.56, p.545-553, 2000.
FATIBELLO-FILHO, O.; VIEIRA, I.C. Construction and analytical application of a biosensor based on stearic acid-graphite powder modified with sweet potato tissue in organic
solvents. Fresen. J. Anal. Chem., v.368, p.338-343, 2000.
FRANZOI, A.C.; MIGOWSKI, P.; DUPONT, J.; VIEIRA, I.C. Development of biosensors containing laccase and imidazolium bis(trifluoromethylsulfonyl)imide ionic liquid
for the determination of rutin. Anal. Chim. Acta, v.639, p.90-95, 2009.
FRANZOI, A.C.; SPINELLI, A.; VIEIRA, L.C. Rutin
determination in pharmaceutical formulations using a carbon
paste electrode modified with poly (vinylpyrrolidone). J.
Pharm. Biomed. Anal., v.47, p.973-977, 2008.
FREITAS, K.H.G.; FATIBELLO-FILHO, O. Carbon composite electrode modified with copper (II) phosphate immobilized in a polyester resin for voltammetric determination of
catechin in teas. Anal. Lett., v.43, p.1-14, 2010.
FREITAS, K.H.G.; FATIBELLO-FILHO, O. Simultaneous determination of butylated hydroxyanisole (BHA) and butylated hydroxytoluene (BHT) in food samples using
a carbon composite electrode modified with Cu3(PO4)2
immobilized in polyester resin. Talanta, v.81, p.1102-1108,
FREITAS, K.H.G.; MEDEIROS, R.A.; FATIBELLO-FILHO, O. Voltammetric determination of rutin using a carbon
composite electrode modified with copper(II)-resin. Anal.
Lett., v.42, p.881-897, 2009.
GENE, R.M.; CARTANA, C.; ADZET, T.; MARIN, E.; PANELLA, T.; CANIGUERAL, S. Anti-Inflammatory and analgesic activity of baccharis trimera: identification of its
active constituents. Planta Med., v.62, p.232-235, 1996.
GHICA, M.E.; BRETT, A.M.O. Electrochemical oxidation of
rutin. Electroanal., v.17, p.313-318, 2005.
HE, J.; WANG, Y.; DENG, N.; ZHAB, Z.; LIN, X. Cyclic voltammograms obtained from the optical signals: study
of the successive electro-oxidations of rutin. Electrochim. Acta, v.52, p.6665-6672, 2007.
HE, J.; WANG, Y.; DENG, N.; LIN, X. Study of the adsorption and oxidation of antioxidant rutin by cyclic
voltammetry-voltabsorptometry. Bioelectrochemistry, v.71, p.157-163,
2007.
JANEIRO, P.; BRETT, A.M.O. Catechin electrochemical
oxidation mechanisms. Anal. Chim. Acta, v.518, p.109-115, 2004.
KRAUSE, M.S.; RAMALEY, L. Analytical application of
square wave voltammetry. Anal. Chem., v.41, p.1365-1369,
1969.
LI, C.H.; CHEN, A.J.; CHEN, X.F.; CHEN, X.G.; ZU, Z.D.
Separation and simultaneous determination of rutin,
puerarin, daidzein, esculin and esculetin in medicinal
preparations by non-aqueous capillary. J. Pharm. Biomed.
Anal., v.39, p.125-131, 2005.
LIU, X.H.; LI, L.; ZHAO, X.P.; LU, X.Q. Electrochemical behavior of rutin on a multi-walled carbon nanotube and
ionic liquid composite film modified electrode. Colloids
Surf. B., v.81, p.344-349, 2010.
MIRCESKI, V.; KOMORSKY-LOVRIC, S.; LOVRIC, M. Square-wave voltammetry: theory and application. Berlin: Springer, 2007. 201 p.
N U E N G C H A M N O N G , N . ; L O K K E R B O L , A . H . ; INGKANINAN, K. Separation and detection of the antioxidant flavonoids, rutin and quercetin, using hplc coupled on-line with colorimetric detection of antioxidant
activity. Naresuan U. J., v.12, p.25-37, 2004.
OSTERYOUNG, J.G.; OSTERYOUNG, R.A. Square wave
voltammetry. Anal. Chem., v.57, p.101A-110A, 1985.
PACKER, L. Handbook of antioxidants. Oxidative stress and
disease.Los Angeles: CRC Press, 2001. 91 p.
PEREIRA, A.C.; SANTOS, A.S.; KUBOTA, L.T. Tendências em modificações de eletrodos amperométricos para
aplicações analíticas. Quím. Nova, v.25, p.1012-1021, 2002.
PEREIRA, A.V.; FATIBELLO-FILHO, O. Flow injection spectrophotometric determination of L-ascorbic acid in pharmaceutical formulations with on-line solid-phase
reactor containing copper (II) phosphate. Anal. Chim. Acta,
v.366, p.55-62, 1998.
RAMALEY, L.; KRAUSE, M.S. Theory of square wave
voltammetry. Anal. Chem., v.41, p.1362-1365, 1969.
SANTOS, S.X.D.; MAZO, L.H.; CAVALHEIRO, E.T.G. The
use of a graphite-silicone rubber composite electrode in the determination of rutin in pharmaceutical formulation.
J. Braz. Chem. Soc., v.19, p.1600-1606, 2008.
SCHOLZ, F. Electroanalytical methods: guide to experiments
and applications. New York: Springer, 2002. 331 p.
SOMASUNDRUM, M.; KIRTIKARA, K.; TANTICHAROEN, M. Amperometric determination of hydrogen peroxide by
direct and catalytic reduction at a copper electrode. Anal.
Chim. Acta, v.319, p.59-70, 1996.
SUN, W.; YANG, M.; LI, Y.; JIANG, Q.; LIU, S.; JIAO, K.
Electrochemical behavior and determination of rutin on
a pyridiniumbased ionic liquid modified carbon paste
electrode. J. Pharm. Biom. Anal., v.48, p.1326-1331, 2008.
VAZQUEZA, M.V.; SANCHEZA, S.R.; CALVOB, E.J.; SCHIFFRINC, D.J. The electrochemical reduction of
oxygen on polycrystalline copper in borax buffer. J.
Electroanal. Chem., v.374, p.189-197, 1994.
VOLIKAKIS, G.J.; EFSTATHIOU, C.E. Determination of rutin and other flavonoids by flow-injection/adsorptive stripping voltammetry using nujol-graphite and
WANG, Q.J.; DING, F.; LI, H.; HE, P.G.; FANG, Y.Z. Determination of hydrochlorothiazide and rutin in Chinese herb medicines and human urine by capillary zone
electrophoresis with amperometric detection. J. Pharm.
Biomed. Anal., v.30, p.1507-1514, 2003.
XU, J.; ZHANG, H.; CHEN, G. Carbon nanotube/polystyrene
composite electrode for microchip electrophoretic
determination of rutin and quercetin in Flos Sophorae
Immaturus. Talanta, v.73, p.932-937, 2007.
YANG, S.L.; QU, L.B.; LI, G.; YANG, R.; LIU, C.C. Gold nanoparticles/ ethylenediamine/carbon nanotube modified glassy carbon electrode as the voltammetric sensor for
selective determination of rutin in the presence of ascorbic acid. J. Electroanal. Chem., v.645, p.115-122, 2010.
ZU, Y.; LI, C.; FU, Y.; ZHAO, C. Simultaneous determination of catechin, rutin, quercetin kaempferol and isorhamnetin
in the extract of sea buckthorn (Hippophae rhamnoides L.)
leaves by RP-HPLC with DAD. J. Pharm. Biomed. Anal.,
v.41, p.714-719, 2006.