Journal of Animal Ecology 2006 75, 274–287 © 2006 The Authors Journal compilation © 2006 British Ecological Society Blackwell Publishing Ltd
Evaluating the performance of species richness estimators:
sensitivity to sample grain size
JOAQUÍN HORTAL*†, PAULO A. V. BORGES† and CLARA GASPAR†‡
*Departamento de Biodiversidad y Biología Evolutiva, Museo Nacional de Ciencias Naturales (CSIC), C/José Gutiérrez Abascal, 2, Madrid 28006, Spain; †Departamento de Ciências Agrárias, CITAA, Universidade dos Açores, Campus de Angra, Terra-Chã, Angra do Heroísmo 9701 851, Terceira (Açores), Portugal; and ‡BIOME Group, Department of Animal and Plant Sciences, University of Sheffield, Sheffield S10 2TN, UK
Summary
1.
Fifteen species richness estimators (three asymptotic based on species accumulation
curves, 11 nonparametric, and one based in the species–area relationship) were compared
by examining their performance in estimating the total species richness of epigean
arthropods in the Azorean Laurisilva forests. Data obtained with standardized
sampling of 78 transects in natural forest remnants of five islands were aggregated
in seven different grains (i.e. ways of defining a single sample): islands, natural areas,
transects, pairs of traps, traps, database records and individuals to assess the effect of
using different sampling units on species richness estimations.
2.
Estimated species richness scores depended both on the estimator considered and on
the grain size used to aggregate data. However, several estimators (ACE, Chao1, Jackknife1
and 2 and Bootstrap) were precise in spite of grain variations. Weibull and several recent
estimators [proposed by Rosenzweig
et al
. (
Conservation Biology
, 2003,
17
, 864 – 874),
and Ugland
et al
. (
Journal of Animal Ecology
, 2003,
72
, 888 – 897)] performed poorly.
3.
Estimations developed using the smaller grain sizes (pair of traps, traps, records and
individuals) presented similar scores in a number of estimators (the above-mentioned
plus ICE, Chao2, Michaelis–Menten, Negative Exponential and Clench). The estimations
from those four sample sizes were also highly correlated.
4.
Contrary to other studies, we conclude that most species richness estimators may be
useful in biodiversity studies. Owing to their inherent formulas, several nonparametric
and asymptotic estimators present insensitivity to differences in the way the samples are
aggregated. Thus, they could be used to compare species richness scores obtained from
different sampling strategies. Our results also point out that species richness estimations
coming from small grain sizes can be directly compared and other estimators could give
more precise results in those cases. We propose a decision framework based on our
results and on the literature to assess which estimator should be used to compare species
richness scores of different sites, depending on the grain size of the original data, and of
the kind of data available (species occurrence or abundance data).
Key-words
: Azores, epigean arthropods, grain size, sampling effort, species richness
estimation.
Journal of Animal Ecology
(2006)
75
, 274–287
doi: 10.1111/j.1365-2656.2006.01048.x
Introduction
Species richness is the most commonly used biodiversity indicator (see Gaston 1996 for a review) for conservation
(e.g. Margules, Nicholls & Pressey 1988; Conroy & Noon 1996; Kerr 1997; van Jaarsveld et al. 1998), ecological research (e.g. Tilman, Wedin & Knops 1996; Naeem et al. 1996; Brown et al. 2001) and macroecology (e.g. Currie 1991; Gaston 2000; Whittaker, Willis & Field 2001). However, complete inventories of the fauna at a given place, for a specific community or geograph-ical area are often exceedingly hard to get. In addition, biodiversity data suffer from heterogeneity in sampling Correspondence: Joaquín Hortal, Departamento de
Biodi-versidad y Biología Evolutiva. Museo Nacional de Ciencias Naturales (CSIC), C/José Gutiérrez Abascal, 2, Madrid 28006, Spain. E-mail: [email protected]
275
Effect of grain size on species richness estimators © 2006 The Authors Journal compilation © 2006 British Ecological Society, Journal of Animal Ecology, 75, 274–287
strategies and /or sample size. Moreover, it is well known that differences in the characteristics of biological assemblages produce differences in sampling effec-tiveness. Thus, when the same sampling effort with standardized techniques is carried out in different areas and/or community types, sampling success may not be always the same, leading to important biases in the total species richness inventoried at each site.
Owing to this, studies involving comparisons of species richness among different areas, sites or com-munities need to use extrapolation or rarefaction tech-niques to ‘standardize’ richness data (see Palmer 1990, 1991; Baltanás 1992; Soberón & Llorente 1993; Colwell & Coddington 1994; Walther et al. 1995; Walther & Morand 1998; Gotelli & Colwell 2001; Walther & Martin 2001; Walther & Moore 2005). There are many methodologies currently in use for this task, from which four main groups can be distinguished: 1. Nonparametric estimators use the species-abundance and/or occurrence relationships throughout the sam-ples to estimate total number of species, using a previ-ously formulated nonparametric model (see, e.g. Chao & Bunge 2002; Sørensen, Coddington & Scharff 2002; Chiarucci et al. 2003; Rosenzweig et al. 2003; Shen, Chao & Lin 2003).
2. Fitting species-abundance distributions, where parametric models are adjusted to the distribution of the relative abundances of the species, and are then used to extrapolate the number of still unknown species (May 1975; Pielou 1975, 1977; see also Colwell & Coddington 1994). These kinds of methods present several still unsolved problems of methodology and performance (Walther & Morand 1998; see also Colwell & Coddington 1994 for the former, and Palmer 1990, 1991 for the latter), so they are less used for spe-cies richness estimation, and have not been included in our study.
3. Species accumulation curves, where the parameters of several asymptotic equations are adjusted to describe the relationship between sampling effort and sampling success (i.e. the number of species added to the check-list by each sample). Total richness is extrapolated as the number of species that would be found with a hypothetical infinite sampling effort (see, e.g. Lamas, Robbins & Harvey 1991; Soberón & Llorente 1993; Medellín & Soberón 1999; Hortal, Garcia-Pereira & García-Barros 2004; Jiménez-Valverde & Lobo 2005). This allows estimation of the richness of a heterogeneous territory (such as the Azorean native forests used here), as long as sampling is representative of it (Colwell, Mao & Chang 2004; R. Colwell, personal communication). 4. Species–area curves, where the number of species in several patches of different areas (either nested or not) is used to extrapolate the number of species in other patches of known area, or in a whole region, via a fitted parametric model that relates area and species richness (see Palmer & White 1994; Flather 1996; He & Legendre 1996; Scheiner et al. 2000; Ugland, Gray & Ellingsen 2003; Koellner, Hersperger & Wohlgemuth 2004).
These curves are usually nonasymptotic, so total rich-ness cannot be obtained by extrapolating area to the infinite (such as in species accumulation curves), but only by extrapolating the number of species that could be expected to be found at a given area size.
Most times, species accumulation and species–area curves are confounded (see, e.g. the debate in Scheiner 2003, 2004 and Gray, Ugland & Lambshead 2004, 2005). For clarity, we consider species accumulation curves those where the area of each sample unit is not used to build the curve, whereas species–area curves include the area of each sample unit (e.g. a forest remnant, see below) in the formulation of the curve (see Colwell et al. 2004).
To date, numerous assessments on the performance of several of these estimators under different conditions and /or sample sizes have been carried out (e.g. Chazdon et al. 1998; Keating et al. 1998; Peterson & Slade 1998; Walther & Morand 1998; Chiarucci, Maccherini & De Dominicis 2001; Walther & Martin 2001; Brose 2002; Longino, Coddington & Colwell 2002; Borges & Brown 2003; Brose, Martinez & Williams 2003; Chiarucci et al. 2003; Melo et al. 2003; Brose & Martinez 2004; O’Hara 2005; Jiménez-Valverde et al. 2006; see review at Walther & Moore 2005). These works seek for the most ade-quate estimator, that is, the one with less estimation bias (deviation from the true richness value) and higher precision (i.e. the lesser random error), thus producing the higher accuracy (the combination of bias and precision) (see Walther & Moore 2005 for a review).
The idea behind such extensive evaluation work is to find estimators that could be used to compare spe-cies richness scores from different sites with reliability. Chazdon et al. (1998) defined three features for an ideal richness estimator: (1) independence of sample size (amount of sampling effort carried out); (2) insensitivity to unevenness in species distributions; and (3) insensi-tivity to sample order. The above-mentioned studies used results from similar survey methods (thus, similar sampling units) with different intensities and/or sam-pling success to determine the adequacy of different estimators. However, an assessment on how the differ-ent estimators perform when the units used to describe sampling effort differ among the surveyed places is yet to be done. Different sampling strategies are often used to assess species richness in natural areas or large regions. To compare richness values obtained from different survey strategies (which is often the case for macroecology studies), we need a measure with low sensitivity to this source of variation, independently of its success in determining the real number of species in a given place. The scores obtained with such an estimator would allow direct comparison of species richness between sites surveyed with different sampling methodologies, as well as with unequal sampling efforts (providing that the sampling coverage is sufficiently large). Thus, we can add a fourth feature to those proposed by Chazdon et al. (1998) for an ideal estimator: (4) insensitivity to heterogeneity in the sample units used among studies.
276 J. Hortal, P. A. V. Borges & C. Gaspar © 2006 The Authors Journal compilation © 2006 British Ecological Society, Journal of Animal Ecology, 75, 274–287
Following Whittaker et al. (2001) recommendations, hereafter we will use the term grain size (see Levins 1968) to define the sampling effort unit (e.g. traps, transects, cells in a geographical grid, or landscape patches).
In this work, we analyse the effect of variation in grain size on species richness estimations. We evaluate the accuracy of the predictions obtained with many of the estimators presently available when different strat-egies are used to group the same dataset into different grains (i.e. sample units). To do this, we have used data from standardized surveys of the arthropod epigean community of native forests from the five major Azorean islands, in order to estimate the total number of arthropod species that occurs in the Archipelago (ex-cluding small islands), using seven different grain sizes.
Biological dataset
The dataset used for this work comes from a study conducted in the Azorean archipelago (North Atlan-tic; 37– 40°N, 25 – 31°W), which comprises nine main islands and some small islets. Aligned on a WNW–ESE axis, these islands extend for about 615 km across the Mid-Atlantic Ridge, which separates the western group (Flores and Corvo) from the central (Faial, Pico, São Jorge, Terceira and Graciosa) and the eastern (São Miguel and Santa Maria) groups. All islands are of relatively recent volcanic origin, ranging from 250 000 years (Pico) to 8·12 Ma (Santa Maria) (Nunes 1999). The climate is temperate oceanic, with high relative atmospheric humidity (reaching 95% in high altitude native semitropical evergreen laurel forest), as well as limited temperature fluctuations throughout the year. The predominant native vegeta-tion is ‘Laurisilva’, a humid evergreen broadleaf and microphyllous (hereafter short-leaf ) laurel type forest.
Dominant trees and shrubs include short-leaf Juni-perus brevifolia and Erica azorica (both endemics), and the broadleaf species Ilex perado ssp. azorica (endemic), Laurus azorica (native) and the shrub Vaccinium cylin-draceum (endemic) (Silva et al. 2005).
On seven of the Azorean islands (excluding the smaller and more disturbed Graciosa and Corvo) native vege-tation was surveyed within Natural Forest Reserves and/or NATURA 2000 protected areas using stand-ardized sampling protocols (see Borges et al. 2005a, 2006). During the summers of 1999 –2003, 150 m × 5 m transects were randomly placed in each fragment of native protected forest. Simulating a species–area rela-tionship of 0·35 slope (a 10× increase in area implies the duplication in the number of species), transects were set up using a logarithmic scale, placing two transects in 10 ha fragments, four transects in 100 ha fragments and eight transects in 1000 ha fragments. Therefore, larger reserves received higher sampling effort (Borges et al. unpublished data). For the present study, only five islands were covered, those with at least two native protected areas (see Table 1) and a total of 78 transects located within 17 forest remnants were selected.
Along each transect, 30 pitfall traps were set in the ground at 5-m intervals for at least a 2-week period (see also Borges et al. 2005a). Fifteen traps were half-filled with a nonattractive solution with a small proportion of ethylene glycol, and the other half with a general attractive solution (Turquin) made of dark beer and some preservatives (see Turquin 1973). Traps were placed alternately along each transect. With such a procedure, it was expected not only to survey the rela-tive abundance (although biased by their mobility) of each species sampled (with nonattractive traps), but also to capture the maximum number of species (with attractive traps).
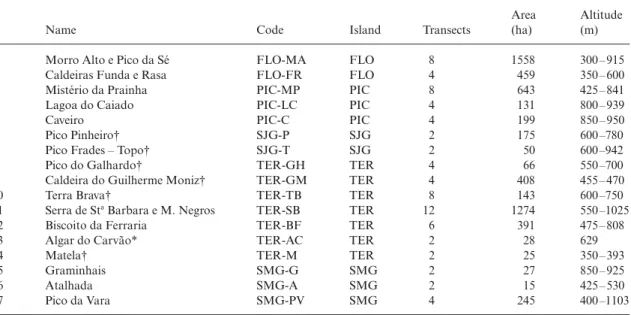
Table 1. List of the studied 11 natural forest reserves, one geological reserve (*) and five additional areas (†) with their name, code,
island (PIC = Pico; FLO = Flores; SJG = São Jorge; SMG = São Miguel; TER = Terceira), number of available transects, area and altitude (minimum and maximum). When nature reserves correspond to different habitats, area and altitude are given just for their laurisilva forest remnants
Name Code Island Transects
Area (ha)
Altitude (m)
1 Morro Alto e Pico da Sé FLO-MA FLO 8 1558 300 – 915
2 Caldeiras Funda e Rasa FLO-FR FLO 4 459 350 – 600
3 Mistério da Prainha PIC-MP PIC 8 643 425 – 841
4 Lagoa do Caiado PIC-LC PIC 4 131 800 – 939
5 Caveiro PIC-C PIC 4 199 850 – 950
6 Pico Pinheiro† SJG-P SJG 2 175 600 –780
7 Pico Frades – Topo† SJG-T SJG 2 50 600 –942
8 Pico do Galhardo† TER-GH TER 4 66 550 –700
9 Caldeira do Guilherme Moniz† TER-GM TER 4 408 455 – 470
10 Terra Brava† TER-TB TER 8 143 600 –750
11 Serra de Sta Barbara e M. Negros TER-SB TER 12 1274 550 –1025
12 Biscoito da Ferraria TER-BF TER 6 391 475 – 808
13 Algar do Carvão* TER-AC TER 2 28 629
14 Matela† TER-M TER 2 25 350 – 393
15 Graminhais SMG-G SMG 2 27 850 – 925
16 Atalhada SMG-A SMG 2 15 425 – 530
277
Effect of grain size on species richness estimators © 2006 The Authors Journal compilation © 2006 British Ecological Society, Journal of Animal Ecology, 75, 274–287
All Araneae, Opiliones, Pseudoscorpiones and insects (excluding Collembola, Diplura, Diptera and Hymenoptera) were first sorted into morphospecies by students under supervision of a trained taxonomist (PB) (see Oliver & Beattie 1993, 1996). Later, the mor-phospecies were identified by one of us (PB) using voucher specimens already available in situ, and all unknowns were sent to several taxonomists for species identification (see Acknowledgements).
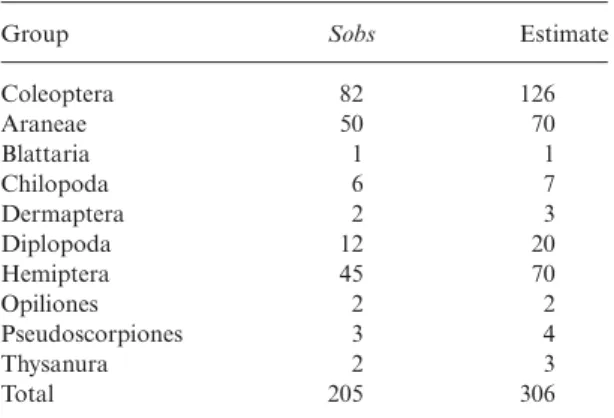
At the end of this survey, a total of 22 815 individuals, pertaining to 205 epigean arthropod species (or mor-phospecies) were captured. As there is no complete checklist available for the studied fauna, we provide a comparison with an expert ‘guesstimate’ of the total number of species. According to his expertise in such fauna, one of us (PB) has arbitrarily extrapolated the total number of epigean species for each one of the main arthropod groups present in the natural forests of the five studied islands. The recent checklist of the Azorean arthropods (Borges et al. 2005b), developed from an exhaustive survey of relevant literature and collections, was taken as a starting point. To get a ‘guesstimate’ for each group current numbers in such a checklist were taken into account, but also the degree of knowledge of each group at the Azores and PB’s expertise. Only native forest fauna was considered, not counting introduced species and/or pasture dwelling species (see also Borges 1999). According to PB’s knowledge, 306 species could be an approximate figure for the total number of species present in such forests (see Table 2). Such a guesstimate should not be taken as the true number of arthropod epigean species in Azorean Laurisilva, but only as a milestone to identify abnormally biased richness estimations.
Data grouping
To study how variations in grain size affect species rich-ness estimations, we have grouped data into samples using seven different strategies.
1. Islands: grouping all individuals captured in each island as a single sample (n = 5).
2. Natural areas: using all data from each forest remnant as a sample (n = 17).
3. Transects: comprising all the individuals captured in each transect (n = 78).
4. Pairs of traps (herein, ‘2Traps’): combining the data of each pair of Turquin and ethylene pitfalls into a single measure (e.g. traps 1 and 2; traps 3 and 4; … of a given transect), assuming that they constitute an heterogeneous though complementary sample unit, com-prising two different capture methods (see Discussion on heterogeneous sampling units at Jiménez-Valverde & Lobo 2005) (n = 1116).
5. Traps: using each pitfall trap separately (n = 2232). 6. Database records (herein, ‘Records’): where all the individuals of the same species present in a single trap give rise to a single sample (e.g. if a trap contains two individuals of the same species, a single sample is used, with an abundance value of 2; if, on the contrary, these two individuals pertain to two different species, two different samples occur, each one with an abundance value of 1; see examples in Hortal, Lobo & Martín-Piera 2001; Lobo & Martín-Piera 2002; and Martín-Piera & Lobo 2003) (n = 8666).
7. Individuals: where each individual captured produces a sample (n = 22815).
Here, it is important to point out that both Records and Individuals provide only incidence measures (although species abundance is directly included in Individuals, and indirectly in Records). Thus, the per-formance of abundance-based estimators (see below) could be less reliable for these two grains.
Species richness estimators
We compared the performance of 15 different species richness estimators (see abbreviations and descriptions in Table 3).
For Clench, Negative Exponential and Weibull estimators, species richness is calculated as the asymp-tote value of a function fitted to the smoothed species accumulation curve provided by S 7·0 (100 randomizations; Colwell 2004). This ideal curve rep-resents an unbiased description of the sampling process, where possible effects due to the order by which the samples have been taken or listed are removed by ran-domizing their order of entrance in the curve. We used to fit each function to the data (see function equations in Soberón & Llorente 1993 for Clench and Negative Exponential, and Flather 1996 for Weibull), and then calculated the asymptote value from the so-obtained parameters (see a description of the pro-cess in Jiménez-Valverde & Hortal 2003 or Hortal et al. 2004). Michaelis–Menten is a nonparametric formula-tion of the Clench one, and is calculated in as the mean score after 100 randomizations (Colwell 2004). As it presents slight differences from the scores obtained with Clench, we have included it in our analyses.
Table 2. Guesstimate (expert extrapolation) of total species
richness of the epigean arthropod fauna of natural forest remnants in the five Azorean islands studied (São Miguel, Terceira, Pico, Flores and São Jorge). Sobs is the number of epigean species recorded during the survey
Group Sobs Estimate
Coleoptera 82 126 Araneae 50 70 Blattaria 1 1 Chilopoda 6 7 Dermaptera 2 3 Diplopoda 12 20 Hemiptera 45 70 Opiliones 2 2 Pseudoscorpiones 3 4 Thysanura 2 3 Total 205 306
278 J. Hortal, P. A. V. Borges & C. Gaspar © 2006 The Authors Journal compilation © 2006 British Ecological Society, Journal of Animal Ecology, 75, 274–287
Together with the former, we evaluated another 10 nonparametric estimators. Seven are the ‘classical’ esti-mators provided by the S software: ACE, ICE, Chao1, Chao2, Jackknife1, Jackknife2, Bootstrap (see Table 3 for references), and have been widely used and studied (e.g. Chazdon et al. 1998; Brose et al. 2003; Chiarucci et al. 2003). They are available in several pro-grams (e.g. S, – Chao & Shen 2003 – 05, or – Henderson & Seaby 2002). Here, it is important to check for the estimator formulas used by each program; while several estima-tors have been updated, these changes are not always available (e.g. Chao1 bias-corrected formula is used by current versions of S and , but not by ). The other three (F3, F5 and F6) are available in 2 software (Turner, Leitner & Rosenzweig 2000), but their adequacy has not yet been formally tested against other estimators, except for the paper where they were proposed (Rosenzweig et al. 2003). This is also the case for the only species–
area-based estimator we test (Ugland), for which the only application available is its primary source (Ugland et al. 2003).
Comparison among estimators performance
We estimated the total species richness scores for the five studied islands using the 15 estimators and the seven different grain sizes (Table 4). The eight estima-tors included in the S package (as well as the three asymptotic ones, see Table 3) were applied to all grains, being computing times negligible (on a Pentium Centrino 1·7 GHz with 1·25 GB RAM), except for Records and Individuals (note that high computation times are due to the randomization process, which is not necessary to obtain the results of nonparametric estimators if a single estimate is needed; R. Colwell, personal communication). Computing times for 2 were higher, reaching 10 min in the case of 2Traps, 15 min for Traps, and 140 min for Records, being impossible toTable 3. Characteristics of the species richness estimators used for this analysis
Abbrev. Estimator Type Data Program Reference
Clench Estimation of Michaelis–
Menten function asymptote
As In S/STAT Clench (1979) in
Soberón & Llorente (1993)
Exp Neg Estimation of Negative
Exponential function asymptote
As In S/STAT Miller & Wiegert (1989) in
Soberón & Llorente (1993)
Weibull Estimation of Weibull
function asymptote
As In S/STAT Brown & Mayer (1988) in
Flather (1996)
MM Nonparametric Michaelis–
Menten richness estimator
As/NP In S Raaijmakers (1987) in
Colwell (2004)
ACE Abundance-based Coverage
Estimator of species richness
NP Ab S Chao & Lee (1992); Chao et al.
(2000); Chazdon et al. (1998) in Colwell (2004)
ICE Incidence-based Coverage
Estimator of species richness
NP In S Lee & Chao (1994); Chao et al.
(2000); Chazdon et al. (1998) in Colwell (2004)
Chao1 Abundance-based
estimator of species richness
NP Ab S Chao (1984) in Colwell (2004)
Chao2 Incidence-based
estimator of species richness
NP In S Chao (1984, 1987); Colwell (2004)
Jackknife1 First-order Jackknife
richness estimator
NP In S Burnham & Overton (1978, 1979);
Heltshe & Forrester (1983) in Colwell (2004)
Jackknife2 Second-order Jackknife
richness estimator
NP In S Smith & van Belle (1984) in
Colwell (2004)
Bootstrap Bootstrap richness estimator NP In S Smith & van Belle (1984) in
Colwell (2004) F3 Extrapolation nonparametric estimator 3 NP Ab 2 Rosenzweig et al. (2003) F5 Extrapolation nonparametric estimator 5 NP Ab 2 Rosenzweig et al. (2003) F6 Extrapolation nonparametric estimator 6 NP Ab 2 Rosenzweig et al. (2003)
Ugland Sample based species–area curve SA Ab Ugland Ugland et al. (2003)
Abbrev. is the abbreviation used throughout this work. Type refers to the kind of method used to estimate species richness: As, asymptote value of a fitted species accumulation curve; NP, estimation using a nonparametric model; SA, species–area curve; see text for further details. Data refer to the kind of data required for the estimation: In, incidence of the species in each sample;
Ab, abundance of the species in each sample. Program refers to the software used for computing (S 7·0 – Colwell 2004,
available at http://purl.oclc.org/estimates; STAT – any common statistical program, in this case StatSoft 2001; 2 3·2 (beta) –
Turner et al. 2000, available at http://eebweb.arizona.edu/diversity/; Ugland – Ugland et al. 2003, Excel® spreadsheet available at http://folk.uio.no/johnsg/main.htm). See text for further explanations.
279
Effect of grain size on species richness estimators © 2006 The Authors Journal compilation © 2006 British Ecological Society, Journal of Animal Ecology, 75, 274–287
compute the matrix of Individuals. For the species– area curve estimator (Ugland) the samples needed to be partitioned into up to five different groups, and due to Excel® limitations, it was only possible to use up to 240 samples. Thus, we could only apply it to two grain sizes (Natural Areas and Transects), allowing the use of the 17 Natural Areas or the 78 Transects partitioned into the five groups (islands).
We evaluated the effect of variations in grain size on species richness estimation in two ways. First, we evaluated the sensitivity of the estimators to such variations, in order to identify those with higher inde-pendence from grain. To do this, we used precision (i.e. the variability in the estimates obtained with different grains) and, secondarily, bias (i.e. the distance between the estimates and the guesstimate of 306 species) (see Walther & Moore 2005). The best-performing estim-ators can be regarded as the most suitable to compare areas sampled with different grains. Second, we used the results from the more precise estimators to analyse the suitability of using different grain sizes for com-parable biodiversity studies. We characterized the rela-tionships among the estimates obtained with different grains, to determine which groups of grains presented similar values when the same estimator is used. This way, we identified which pairs or groups of grains produce comparable estimations.
Five estimators (Ugland, F3, F5, F6 and Weibull) performed clearly worse than the other 10. Ugland could only be applied to two grain sizes, showing low precision, and both estimations seem unrealistic when compared with the guesstimate (601·1 species estimates using Natural Areas, and 440·9 using Transects; see Table 4). The same occurred with F3, F5 and F6, which
also showed low precision and extremely biased scores in the greatest grain sizes (see Table 4 and Fig. 1). Although the three were more precise and less biased at grains smaller than Transect (which are at most times directly comparable, see Relationships among grain sizes below), their overall performance was worse than the other estimators. While their ranges in these three estimates are equal or higher than 30 (36·71 for F3, 56·15 for F5, and 29·44 for F6), almost all the other estimators presented variations smaller than 5·5. The only ‘classical’ estimator with a similar performance is Weibull (with a range of 26·17 in the estimates for 2Traps, Traps and Records), which also presents an erratic behaviour. While the other estimators show a more or less constant pattern of diminishing estimated scores as grain diminishes (see Fig. 2), Weibull reaches an unrealistic top value when calculated using Indi-viduals (nearly 750 species; see Table 4). This pattern is probably due to the high effectiveness of this function in adjusting to the smoothed species accumulation curves (adjusted R2 scores always higher than 99·99%;
see also Jiménez-Valverde et al. 2006). Such ‘overfit-ting’ to the different curves obtained with each grain makes this estimator extremely dependent on grain size. Owing to their poor performance, we have excluded these five estimators from the rest of the analyses.
All the other 10 estimators showed limited vari-ability, with SDs always less than 60 species (c. 20% of the guesstimate) (Table 4). In general, most of them showed a decreasing pattern, producing higher estima-tions at the greater grains, and similar estimated scores at the four smaller grain sizes (2Traps, Traps, Records and Individuals) (Fig. 2). The abundance-based estimators ACE and Chao1, and, to a lesser extent, Bootstrap, showed a high precision, with negligible SDs (0·23, 2·79 and 4·80, respectively; see Table 4), produced by the little variations due to data aggregation
Table 4. Species richness estimated for seven different grains by the 15 estimators analysed. n refers to the number of grains that
could be used for each estimator; note that F3, F5 and F6 could not be used with Individuals, and the Ugland estimator could only be applied to two grains (see text). SD is the SD of the different results obtained with each estimator. Results according to S output (note that slight differences could appear between S and estimates; A. Chao, personal communication). Nt.Ar. is Natural Areas. Ind. is Individuals. Other abbreviations as in text and Table 3
Estimator n SD Islands Nt.Ar. Transects 2Traps Traps Records Ind.
Clench 7 45·82 343·6 277·5 248·7 223·9 223·3 223·7 218·4 Exp Neg 7 18·59 238·2 208·2 197·0 188·7 188·7 188·8 187·5 Weibull 7 162·81 244·6 306·0 319·4 433·4 412·1 407·3 744·9 MM 7 57·69 333·0 253·5 212·7 184·5 183·5 183·1 174·1 ACE 7 0·23 288·3 288·3 288·3 288·3 288·3 289·0 288·3 ICE 7 31·99 372·8 329·6 299·1 291·9 288·7 288·7 288·1 Chao1 7 2·79 298·1 ± 34·9 301·8 ± 34·9 301·8 ± 34·9 301·8 ± 34·9 301·8 ± 34·9 307·2 ± 37·7 304·2 ± 34·9 Chao2 7 32·35 379·5 ± 48·3 363·0 ± 49·3 361·0 ± 53·1 311·2 ± 37·7 311·2 ± 37·7 307·2 ± 37·7 304·2 ± 34·9 Jackknife1 7 10·08 293·8 ± 22·6 287·8 ± 13·8 282·0 ± 11·1 270·9 ± 8·3 271·0 ± 8·3 271·0 ± 8·1 268·0 ± 7·9 Jackknife2 7 15·24 345·1 345·6 339·7 316·9 316·9 317·0 311·0 Bootstrap 7 4·80 244·3 240·6 237·3 232·9 232·9 232·9 231·7 F3 6 381·23 1255·3 631·2 435·5 297·8 295·1 261·1 F5 6 2053·94 5514·3 1776·8 670·3 334·7 331·6 278·5 F6 6 457·98 1588·9 618·4 512·3 422·6 444·6 415·2 Ugland 2 113·29 601·1 440·9
280 J. Hortal, P. A. V. Borges & C. Gaspar © 2006 The Authors Journal compilation © 2006 British Ecological Society, Journal of Animal Ecology, 75, 274–287
in samples at each grain. First- and second-order Jackknife estimators also showed great precision. To the contrary, incidence-based estimators ICE and Chao2, and asymptotic estimators (Clench, Negative Exponential and Michaelis–Menten) showed con-sistently higher scores at greater grain sizes. These three asymptotic estimators, as well as Bootstrap, were also negatively biased, performing even worse than the observed number of species (Negative Exponential and Michaelis–Menten estimators; Fig. 2). Again, ACE and Chao1 showed the best performance, with scores very close to the guesstimate throughout the different grains. ICE, Chao2, and the two Jackknife estimators performed quite well in the smaller grains. Although being cautious about our guesstimate, all these non-parametric estimators seemed to present higher accu-racy in their estimations, thus seeming a better option than asymptotic estimators and Bootstrap.
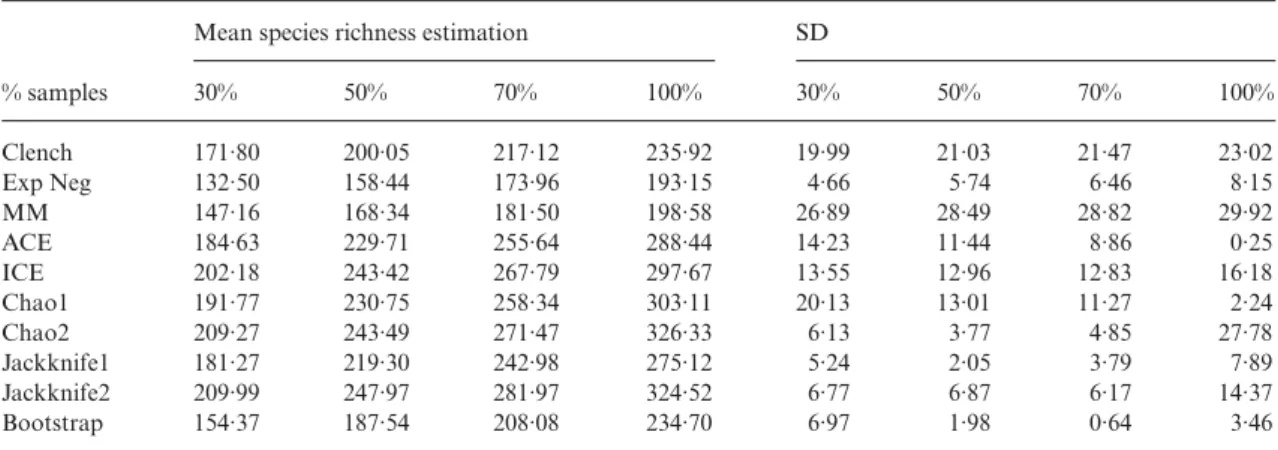
The results of all 10 estimators were highly depend-ent on the level of sampling effort (sample coverage), providing lower richness scores when calculated from a lower number of samples. We calculated the predictions of these estimators at four levels of sample coverage (30, 50, 70 and 100% of the samples). For each grain, we calculated the average species richness predicted after 100 randomizations at each sample coverage level (e.g. the mean predictions for each of the 10 esti-mators at 23 (30%), 39 (50%), 55 (70%) and 78 (100%) samples of Transects, or at 2600, 4333, 6066 and 8666 samples of Records). Islands grain size was excluded due to its low number of samples. Then, we calculated the mean and SD for each estimator and level of sample
coverage, to account for the bias and precision of their predictions (Table 5). Although the abundance-based nonparametric estimators (ACE and Chao1) are more precise, when we analyse the effect of sample coverage their advantage over the rest of the estimators dimin-ishes. While their precision decreases at lower sampling intensities, the variability of incidence-based and Jack-knife nonparametric estimators diminishes or remains more or less constant (see Table 5).
Species richness estimates were highly correlated among the smaller grains. We compared the results of the 10 best-performing estimators (see before) at each grain size to determine which ones produced similar estimates (Fig. 3). Islands was the most dissimilar grain, only significantly related to Natural Areas (Pearson R = 0·850) and Transects (Pearson R = 0·733). The extremely high correlation (Pearson R = 1·000) between Traps and 2Traps, and between Records and Individuals is remarkable. Interestingly, both pairs of grains were also highly correlated (Pearson R = 0·996). Thus, it seems equivalent to use any of these four grains, at least in the studied case. In addition, these were the grains where the scores obtained from nonparametric esti-mators were less biased (see Fig. 2).
Discussion
Species richness is a central component of biodiversity (Gaston 1996; Gaston & Blackburn 2000). As the
Fig. 1. Variability in the species richness scores calculated by each estimator. Square plots represent the mean, boxes show the SD,
and whiskers provide the 95% confidence interval (1·96*SD). The left graph shows 14 of the studied estimators (note that Ugland is excluded). As F3, F5 and F6 could only be applied to six grain sizes (see text), ‘Individuals’ is excluded from the calculations of this graph. Owing to the high variability in these three estimators, the other 11 are represented in the right graph, using data for the seven grain sizes. Here, the guesstimate (306 species) is represented by a discontinuous line, and the observed richness (205 species) as dots and lines (see text). Abbreviations as in text and Table 3.
281
Effect of grain size on species richness estimators © 2006 The Authors Journal compilation © 2006 British Ecological Society, Journal of Animal Ecology, 75, 274–287
real number of species is unknown after sampling campaigns, estimators are needed to provide a clearer picture of species richness patterns. To date, many estimators are available, a number that increases as new approaches to the analysis of the process of species accumulation with sampling effort are developed (e.g. Colwell et al. 2004). However, the estimation of the true number of species in a given place or area seems to be elusive. Unfortunately, when a nearly complete checklist is available (in simulations or extremely well-known areas), most times the actual richness figures
are not accurately estimated (e.g. Brose et al. 2003; Brose & Martinez 2004), depending on the data and the estimator used (see Walther & Morand 1998; Walther & Martin 2001). Despite this drawback, such estima-tors could be also useful if they provide a good picture of species richness patterns. Hortal et al. (2004) found that predictive models of the geographical distribution of species richness developed from Clench estimations were more accurate and representative than the models developed from observed scores, due to the diminution in the estimations of the bias due to unequal sampling
Fig. 2. Performance of the 10 less variable estimators across grain sizes. The discontinuous line shows the guesstimate, and the
282 J. Hortal, P. A. V. Borges & C. Gaspar © 2006 The Authors Journal compilation © 2006 British Ecological Society, Journal of Animal Ecology, 75, 274–287
effort. Here, in addition to the accuracy in representing real species richness score (that is virtually unknown, such as present data), we stress the importance of the estimates being comparable as a criterion for the adequacy of estimators (see, e.g. Palmer 1990, 1991). For an estimator to be useful, it should combine accuracy in representing real species richness with the capacity to give unbiased estimations of the differences in species richness among areas and/or grain sizes.
With regard to estimator performance, it is impor-tant to point out the poor results shown for these data by the new estimators proposed by Rosenzweig et al. (2003) and Ugland et al. (2003), as well as of Weibull (Flather 1996). Therefore, and given our results, the use of the estimators F3, F5, F6, Weibull and Ugland is cur-rently not advisable, until their performance in future comparative analyses determine that they could be worth using in a number of cases. Once these estimators were excluded, the rest seem to perform more or less well. However, asymptotic estimators appear less desir-able; they consistently underestimate species richness, a pattern well-documented in the literature (see, e.g.
Lamas et al. 1991; Soberón & Llorente 1993; Colwell & Coddington 1994; Chazdon et al. 1998; Gotelli & Colwell 2001; Walther & Martin 2001; Melo et al. 2003; Brose & Martinez 2004; Hortal et al. 2004; Walther & Moore 2005; Jiménez-Valverde et al. 2006). Although the performance of nonparametric estima-tors has been always questionable (see, e.g. Longino et al. 2002; Chiarucci et al. 2003; Jiménez-Valverde & Hortal 2003; O’Hara 2005), neither observed species richness, nor species–area curves or asymptotic estima-tors seem to perform better than most of these estimaestima-tors. Therefore, we believe that they should be used in the absence of complete inventories, despite their drawbacks and potential inaccuracy.
The estimations of the abundance-based Chao1 and ACE nonparametric estimators were independent from the grain used to aggregate the samples. This result was expected as both estimators are calculated from the species frequencies directly obtained from the total pool of individuals (A. Chao and R. Colwell, personal communication). Therefore, abundance data remain the same, regardless of the grain size used to aggregate data (except for Records, a measure of incidence), so only small variations due to data aggregation in samples appear. This property makes both abundance-based estimators extremely useful to compare data coming from different grains; as they depend on total species abundances, they should be quite robust to variations in grain size if sample coverage is sufficiently large (A. Chao, personal communication). However, differences in the survey methodologies and sampling effort used at the different sites (i.e. sampling bias sensu Walther & Moore 2005) could also affect estimations, so to com-pare surveys with different grain size data should be carefully examined to determine if they are comparable. It is also worth mentioning the low bias of both Chao1 and ACE estimators in our study, although this result cannot be taken as a general rule (see Walther & Moore 2005). On the contrary, although Bootstrap estimates are also highly precise, its clear underestimations of species richness (also reported by Chiarucci et al. 2003) prevent us from using it.
Table 5. Mean and SD of the estimates of species richness at different sample coverage (30, 50, 70 and 100% of the samples;
Islands was excluded from this analysis due to its low number of samples) for the 10 less variable estimators
% samples
Mean species richness estimation SD
30% 50% 70% 100% 30% 50% 70% 100% Clench 171·80 200·05 217·12 235·92 19·99 21·03 21·47 23·02 Exp Neg 132·50 158·44 173·96 193·15 4·66 5·74 6·46 8·15 MM 147·16 168·34 181·50 198·58 26·89 28·49 28·82 29·92 ACE 184·63 229·71 255·64 288·44 14·23 11·44 8·86 0·25 ICE 202·18 243·42 267·79 297·67 13·55 12·96 12·83 16·18 Chao1 191·77 230·75 258·34 303·11 20·13 13·01 11·27 2·24 Chao2 209·27 243·49 271·47 326·33 6·13 3·77 4·85 27·78 Jackknife1 181·27 219·30 242·98 275·12 5·24 2·05 3·79 7·89 Jackknife2 209·99 247·97 281·97 324·52 6·77 6·87 6·17 14·37 Bootstrap 154·37 187·54 208·08 234·70 6·97 1·98 0·64 3·46
Fig. 3. Relationships between grain sizes. Cluster analysis
was developed using Unweighted Pair-Group Average as linkage rule (see e.g. Sokal & Rohlf 1995), and Spearman correlations (Table 6) as similarity measure. Abbreviations as in text and Table 4.
283
Effect of grain size on species richness estimators © 2006 The Authors Journal compilation © 2006 British Ecological Society, Journal of Animal Ecology, 75, 274–287
Having said this, it is important to take into account other effects to determine if these two abundance-based estimators are preferable. Given that other estimators have been identified as being more accurate in previous analyses, they could be a better alternative if the data to be compared have small variations in sample grain sizes. Interestingly, when the effect of sample coverage is studied, the precision of abundance-based estimators ACE and Chao1 diminishes at lower sampling intensi-ties, whereas it remains constant or even increases for incidence-based and Jackknife nonparametric estima-tors (see Table 5). A higher precision of incidence-based estimators at low sampling intensities has been previously reported (e.g. Chazdon et al. 1998), so they appear to be the best option when sampling effort has been scarce. In our study, Jackknife and incidence-based estimators showed an erratic behaviour in the greater grain sizes. However, when grain is maintained constant, these four estimators (ICE, Chao2, Jackknife1 and Jackknife2) have been reported to be more accurate and less sensitive to other drawbacks, such as sample coverage, patchiness of species distributions, variability in the probability of capture, and many others (see Palmer 1990, 1991; Baltanás 1992; Palmer & White 1994; Chazdon et al. 1998; Chiarucci et al. 2001; Brose et al. 2003; Brose & Martinez 2004). Therefore, a balance between sample grain (see below) and sample coverage is needed to make the best choice of an estimator for specific datasets.
With regard to the most-adequate grain size for aggregating samples, it seems that any of the small grains (2Traps, Traps, Records and Individuals) here considered could give an appropriate picture of the community. All these grains refer to data captured in a single point, or a reduced area. Their high similarity could be due either to the effectiveness of such point data to describe the studied fauna, or to the fact that the arthropod community of a limited area is sampled equally by all of them. Gotelli & Colwell (2001) discuss the differences between using individuals or samples as a measurement of sampling intensity. Given our results, estimations made using individuals did not dif-fer so much from those obtained using small samples, such as traps. On the other hand, greater grains, includ-ing Transect, seem not to be adequate to obtain un-biased species richness estimations that could be compared among different places and/or grains. As a conclusion, data referred to a point or a small area (a plot) seem to be the most adequate to estimate species richness. We thus recommend that authors should record and make available the abundance data for traps or similar units in biological databases and published papers. Not compiling the information available from biodiversity studies in an extensive way, but just for transects or local studies, may result in the loss of useful informa-tion on biodiversity patterns.
The performance of Records is particularly remark-able; this is a measure that, although seeming less informative, performs as well as Individuals and Traps.
Records is just an incidence measure; that is, a sample of each time a species is recorded in a different place, day, trap, or by a different collector regardless of the number of individuals found. In spite of this, their per-formance in our study has been also good when using abundance-based estimators (see above). Other studies have demonstrated the utility of this measure to char-acterize sampling effort (Hortal et al. 2001; Lobo & Martín-Piera 2002; Martín-Piera & Lobo 2003), and recent works demonstrate its accuracy to describe the process of species accumulation from heterogeneous data (J.M. Lobo unpublished results; Romo Benito & García-Barros 2005). Thus, we encourage the use of this measure to analyse data coming from heterogeneous sources, such as studies made with different methodol-ogies, or museum and collection data, a still underes-timated but valuable reservoir of biodiversity data (see Petersen & Meier 2003; Petersen, Meier & Larsen 2003; Graham et al. 2004; Suarez & Tsutsui 2004).
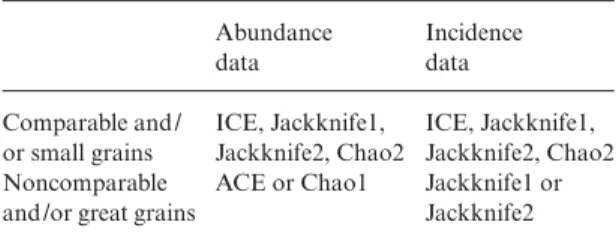
Many times the information available for biodiver-sity meta-analyses comes from heterogeneous sources and different sampling methodologies, and thus, from different grains. Given the here-presented grain-associated performance, as well as the recommendations made by Chazdon et al. (1998), Brose et al. (2003) and Brose & Martinez (2004), among others, we propose a decision framework to determine which estimator should be used in each case (see Table 6). When all data pertain to comparable grains (or small grains, which we have seen to provide similar estimates), ICE, any of the two Jack-knives, or Chao2 should be preferred. The relative performance of these estimators is still under discussion, as the results obtained to date are heterogeneous. For example, whereas Chazdon et al. (1998) found a better performance of ICE and Chao2 at low sample cover-ages, Brose et al. (2003) found that the behaviour of the latter is erratic and dependent on sample coverage, and that Jackknife estimators were the most accurate in determining species richness. We thus recommend following the recommendations given in Chazdon et al. (1998), as well as the decision paths provided by Brose et al. (2003), and Brose & Martinez (2004), to decide which estimator should be used when grains are similar
Table 6. Choice of the best species richness’ estimator for
biodiversity meta-analyses, depending on data characteristics (abundance or incidence) and studied grain sizes (‘Comparable’ means similar grain sizes and ‘small grains’ refer to data about Traps, small groups of Traps, Records or Individuals). Note that the estimators recommended for abundance data when using ‘Comparable and/or small grains’ are of incidence type Abundance data Incidence data Comparable and / or small grains ICE, Jackknife1, Jackknife2, Chao2 ICE, Jackknife1, Jackknife2, Chao2 Noncomparable
and /or great grains
ACE or Chao1 Jackknife1 or
284 J. Hortal, P. A. V. Borges & C. Gaspar © 2006 The Authors Journal compilation © 2006 British Ecological Society, Journal of Animal Ecology, 75, 274–287
or comparable. However, when grains are heterogene-ous, and, specially, when analysing data from large grain sizes, such as islands, regions, or forest remnants, all these estimators lose accuracy, thus producing a grain-related effect in the estimated richness scores. Being data on abundance available, the precision of ACE and/or Chao1 in our study make them the best choice. However, both estimators give a lower bound to species richness (O’Hara 2005), producing only conservative estimates. Moreover, abundance data are not usually available, as checklists from different land patches and/or regions are the only information avail-able (see, e.g. the butterfly data of Ricketts et al. 1999; used by Rosenzweig et al. 2003). In those cases where incidence estimators are needed, we recommend the use of any of the Jackknife estimators, as both seem to be less affected by grain size than ICE and Chao1. Here, the decision framework provided by Brose et al. (2003), and Brose & Martinez (2004) could help to decide which Jackknife estimator best suits the available data.
Concluding remarks
Chao1 and ACE estimators are highly precise with respect to grain variations. Abundance data will allow the direct comparison of species richness scores esti-mated from different grains using these two estimators. However, they present several drawbacks, so we pro-vide a framework to decide which estimator should be preferred in each case, within the six that performed best in our study (ACE, ICE, Chao1, Chao2, Jackknife1 and Jackknife2). Although it is desirable to obtain a general agreement on using a single measure to estimate species richness (to allow the comparison of different works), their performance varies between data and cases (see Walther & Moore 2005). Thus, we also recommend providing the results of these six measures as a common addition to the results of biodiversity studies.
With regard to the selection of grain size, the smaller grains (from Pairs of Traps to Individuals, which usu-ally may correspond to the real sample units applied in the field) seem to produce the most precise and un-biased estimations. Therefore, we recommend use of these grains for biodiversity estimations. It is also important to remark on the good performance of Records (Martín-Piera & Lobo 2003), a measure that could be applied to most of the primary biodiversity data, with no information on sampling effort associated, currently stored in old collections and classic literature.
Acknowledgements
The authors wish to thank Alberto Jiménez Valverde, Jorge M. Lobo, Pedro Cardoso, Bruno A. Walther, Robert Colwell, Anne Chao and one anonymous referee for their suggestions, discussions and critical review, and to Rafael Zardoya (Museo Nacional de Ciencias Naturales) for his kind help to use a Mac com-puter for computing the Individuals curve. We are also
indebted to all the taxonomists who helped identify the morphospecies: H. Enghoff, F. Ilharco, V. Manhert, J. Ribes, A.R.M. Serrano and J. Wunderlich, and to J. Amaral, A. Arraiol, E. Barcelos, P. Cardoso, P. Gonçalves, S. Jarroca, C. Melo, F. Pereira, H. Mas i Gisbert, A. Rodrigues, L. Vieira and A. Vitorino for their contribution to field and/or laboratory work. Funding for field data collecting was provided by ‘Direcção Regional dos Recursos Florestais’ (‘Secre-taria Regional da Agricultura e Pescas’) through the Project ‘Reservas Florestais dos Açores: Cartografia e Inventariação dos Artrópodes Endémicos dos Açores’ (PROJ. 17.01-080203). This work was also supported by Project ATLANTICO, financed by European Com-munity program INTERREG III B. JH was supported by a Portuguese FCT (Fundação para a Ciência e Tecnologia) grant (BPD/20809/2004), and also by the Fundación BBVA project ‘Yámana – Diseño de una red de reservas para la protección de la biodiversidad en América del Sur Austral utilizando modelos pre-dictivos de distribución con taxones hiperdiversos’, the Spanish MEC project CGL2004-0439/BOS and the FCT Center CITAA. CG was supported by a FCT grant (BD/11049/2002).
References
Baltanás, A. (1992) On the use of some methods for the estimation of species richness. Oikos, 65, 484 – 492. Borges, P.A.V. (1999) A list of arthropod species of sown and
semi-natural pastures of three Azorean islands (S. Maria, Terceira and Pico) with some conservation remarks. Açoreana, 9, 13 – 34.
Borges, P.A.V. & Brown, V.K. (2003) Estimating species richness of arthropods in Azorean pastures: the adequacy of suction sampling and pitfall trapping. Graellsia, 59, 7 – 24.
Borges, P.A.V., Aguiar, C., Amaral, J., Amorim, I.R., André, G., Arraiol, A., Baz, A., Dinis, F., Enghoff, H., Gaspar, C., Ilharco, F., Mahnert, V., Melo, C., Pereira, F., Quartau, J.A., Ribeiro, S., Ribes, J., Serrano, A.R.M., Sousa, A.B., Strassen, R.Z., Vieira, L., Vieira, V., Vitorino, A. & Wunderlich, J. (2005a) Ranking protected areas in the Azores using stand-ardized sampling of soil epigean arthropods. Biodiversity and Conservation, 14, 2029–2060.
Borges, P.A.V., Vieira, V., Dinis, F., Jarroca, S., Aguiar, C., Amaral, J., Aarvik, L., Ashmole, P., Ashmole, M., Amorim, I.R., André, G., Argente, M.C., Arraiol, A., Cabrera, A., Diaz, S., Enghoff, H., Gaspar, C., Gisbert, H.M., Gonçalves, P., Lopes, D.H., Melo, C., Mendonça, E.P., Mota, J.A., Oliveira, O., Oromí, P., Pereira, F., Pombo, D.T., Quartau, J.A., Ribeiro, S.P., Rodrigues, A.C., Santos, A.M.C., Serrano, A.R.M., Simões, A.M.A., Soares, A.O., Sousa, A.B., Vieira, L., Vitorino, A. & Wunderlich, J. (2005b) List of the arthropods (Arthropoda). A List of the Terrestrial Fauna (Mollusca and Arthropoda) and Flora (Bryophyta, Pteridophyta and Spermatophyta) from the Azores (eds P.A.V. Borges, R. Cunha, R. Gabriel, A.F. Mar-tins, L. Silva & V. Vieira), pp. 163 – 221. Direcção Regional de Ambiente and Universidade dos Açores, Horta, Angra do Heroísmo and Ponta Delgada.
Borges, P.A.V., Lobo, J.M., Azevedo, E.B., Gaspar, C., Melo, C. & Nunes, V.L. (2006) Invasibility and species richness of island endemic arthropods: a general model of endemic vs. exotic species. Journal of Biogeography, 33, 169–187.
285
Effect of grain size on species richness estimators © 2006 The Authors Journal compilation © 2006 British Ecological Society, Journal of Animal Ecology, 75, 274–287
Brose, U. (2002) Estimating species richness of pitfall catches by non-parametric estimators. Pedobiologia, 46, 101–107. Brose, U. & Martinez, N.D. (2004) Estimating the richness of
species with variable mobility. Oikos, 105, 292–300. Brose, U., Martinez, N.D. & Williams, R.J. (2003) Estimating
species richness: sensitivity to sample coverage and insen-sitivity to spatial patterns. Ecology, 84, 2364 – 2377. Brown, J.H., Ernest, S.K.M., Parody, J.M. & Haskell, J.P.
(2001) Regulation of diversity: maintenance of species richness in changing environments. Oecologia, 126, 321– 332.
Brown, R.F. & Mayer, D.G. (1988) Representing cumulative germination. 2. The use of the Weibull function and other empirically derived curves. Annals of Botany, 61, 127– 138.
Burnham, K.P. & Overton, W.S. (1979) Robust estimation of population size when capture probabilities vary among animals. Ecology, 60, 927 – 236.
Chao, A. (1984) Non-parametric estimation of the number of classes in a population. Scandinavian Journal of Statistics,
11, 265 – 270.
Chao, A. (1987) Estimating the population size for capture-recapture data with unequal catchability. Biometrics, 43, 783 –791.
Chao, A. & Bunge, J. (2002) Estimating the number of species in a stochastic abundance model. Biometrics, 58, 531–539. Chao, A. & Lee, S.-M. (1992) Estimating the number of classes via sample coverage. Journal of the American Statistical Association, 87, 210 – 217.
Chao, A. & Shen, T.-J. (2003 – 05) Program SPADE (Species Prediction and Diversity Estimation). Program and. User’s Guide published at http://chao.stat.nthu.edu.tw
Chao, A., Hwang, W.-H., Chen, Y.-C. & Kuo, C.-Y. (2000) Estimating the number of shared species in two communities. Statistica Sinica, 10, 227 – 246.
Chazdon, R.L., Colwell, R.K., Denslow, J.S. & Guariguata, M.R. (1998) Statistical methods for estimating species rich-ness of woody regeneration in primary and secondary rain forests of NE Costa Rica. Forest Biodiversity Research, Monitoring and Modeling: Conceptual Background and Old World Case Studies (eds F. Dallmeier & J.A. Comiskey), pp. 285–309. Parthenon Publishing, Paris.
Chiarucci, A., Enright, N.J., Perry, G.L.W., Miller, B.P. & Lamont, B.B. (2003) Performance of nonparametric species richness estimators in a high diversity plant com-munity. Diversity and Distributions, 9, 283 – 295.
Chiarucci, A., Maccherini, S. & De Dominicis, V. (2001) Evaluation and monitoring of the flora in a nature reserve by estimation methods. Biological Conservation, 101, 305 – 314.
Clench, H. (1979) How to make regional fists of butterflies: some thoughts. Journal of the Lepidopterists’ Society, 33, 216 – 231.
Colwell, R.K. (2004) Estimates: Statistical Estimation of Species Richness and Shared Species from Samples, Version 7. User’s Guide and application published at: http:// purl.oclc.org/estimates. Department of Ecology & Evolu-tionary Biology, University of Connecticut, Storrs, CT. Colwell, R.K. & Coddington, J.A. (1994) Estimating
ter-restrial biodiversity through extrapolation. Philosophical Transactions of the Royal Society of London B, 345, 101– 118.
Colwell, R.K., Mao, C.X. & Chang, J. (2004) Interpolating, extrapolating, and comparing incidence-based species accumulation curves. Ecology, 85, 2717– 2727.
Conroy, M. & Noon, B.R. (1996) Mapping of species richness for conservation of biological diversity: conceptual and methodological issues. Ecological Applications, 6, 763 –773. Currie, D.J. (1991) Energy and large-scale patterns of animal-and plant-species richness. The American Naturalist, 137, 27– 49.
Flather, C.H. (1996) Fitting species-accumulation functions and assessing regional land use impacts on avian diversity. Journal of Biogeography, 23, 155 –168.
Gaston, K.J. (1996) Species richness: measure and measure-ment. Biodiversity. A Biology of Numbers and Difference (ed. K.J. Gaston), pp. 77–113. Blackwell Science, Oxford. Gaston, K.J. (2000) Global patterns in biodiversity. Nature,
405, 220 – 227.
Gaston, K.J. & Blackburn, T.M. (2000) Pattern and Process in Macroecology. Blackwell Science, Oxford.
Gotelli, N.J. & Colwell, R.K. (2001) Quantifying biodiversity: procedures and pitfalls in the measurement and comparison of species richness. Ecology Letters, 4, 379 – 391. Graham, C.H., Ferrier, S., Huettman, F., Moritz, C. &
Peterson, A.T. (2004) New developments in museum-based informatics and applications in biodiversity analysis. Trends in Ecology and Evolution, 19, 497– 503.
Gray, J.S., Ugland, K.I. & Lambshead, J. (2004) On species accumulation and species – area curves. Global Ecology and Biogeography, 13, 567– 568.
Gray, J.S., Ugland, K.I. & Lambshead, J. (2005) Species accumulation curves analysed by a class if null models discovered by Arrhenius. Oikos, 108, 263 – 274.
He, F. & Legendre, P. (1996) On species–area relations. The American Naturalist, 148, 719– 737.
Heltshe, J. & Forrester, N.E. (1983) Estimating species rich-ness using the jackknife procedure. Biometrics, 39, 1– 11. Henderson, P.A. & Seaby, R.M.H. (2002) Species Diversity
and Richness V3·0. Pisces Conservation Ltd, Lymington, Hants.
Hortal, J., Lobo, J.M. & Martín-Piera, F. (2001) Forecasting insect species richness scores in poorly surveyed territories: the case of the Portuguese dung beetles (Col. Scarabaeinae). Biodiversity and Conservation, 10, 1343 –1367.
Hortal, J., Garcia-Pereira, P. & García-Barros, E. (2004) Butterfly species richness in mainland Portugal: predictive models of geographic distribution patterns. Ecography, 27, 68 – 82.
van Jaarsveld, A.S., Freitag, S., Chown, S.L., Muller, C., Koch, S., Hull, H., Bellamy, C., Krüger, M., Endrödy-Younga, S., Mansell, M.W. & Scholtz, C.H. (1998) Biodiversity assessment and conservation strategies. Science,
279, 2106 – 2108.
Jiménez-Valverde, A. & Hortal, J. (2003) Las curvas de acu-mulación de especies y la necesidad de evaluar la calidad de los inventarios biológicos. Revista Ibérica de Aracnología,
8, 151– 161.
Jiménez-Valverde, A. & Lobo, J.M. (2005) Determining a combined sampling procedure for a reliable estimation of Araneidae and Thomisidae assemblages (Arachnida, Aranaeae). Journal of Arachnology, 33, 33 – 42.
Jiménez-Valverde, A., Jiménez Mendoza, S., Martín Cano, J. & Munguira, M.L. (2006) Comparing relative model fit of several species accumulation functions to local Papilionoidea and Hesperoidea butterfly inventories of Mediterranean habitats. Biodiversity and Conservation, 15, in press. Keating, K.A., Quinn, J.F., Ivie, M.A. & Ivie, L. (1998)
Estimating the effectiveness of further sampling in species inventories. Ecological Applications, 8, 1239 – 1249. Kerr, J.T. (1997) Species richness, endemism, and the choice of
areas for conservation. Conservation Biology, 11, 1094– 1100.
Koellner, T., Hersperger, A.M. & Wohlgemuth, T. (2004) Rarefaction method for assessing plant species diversity on a regional scale. Ecography, 27, 532 – 544.
Lamas, G., Robbins, R.K. & Harvey, D.J. (1991) A preliminary survey of the butterfly fauna of Pakitza, Parque Nacional del Manu, Peru, with an estimate of its species richness. Publicaciones del Museo de Historia Natural, Universidad Nacional Mayor de San Marcos, Serie a Zoología, 40, 1– 19.
286 J. Hortal, P. A. V. Borges & C. Gaspar © 2006 The Authors Journal compilation © 2006 British Ecological Society, Journal of Animal Ecology, 75, 274–287
Lee, S.-M. & Chao, A. (1994) Estimating population size via sample coverage for closed capture-recapture models. Biometrics, 50, 88 – 97.
Levins, R. (1968) Evolution in Changing Environments. Princeton University Press, Princeton, NJ.
Lobo, J.M. & Martín-Piera, F. (2002) Searching for a predic-tive model for species richness of Iberian dung beetle based on spatial and environmental variables. Conservation Biology,
16, 158 – 173.
Longino, J.T., Coddington, J.A. & Colwell, R.R. (2002) The ant fauna of a tropical rain forest: estimating species richness in three different ways. Ecology, 83, 689 – 702.
Margules, C.R., Nicholls, A.O. & Pressey, R.L. (1988) Select-ing networks of reserves to maximise biological diversity. Biological Conservation, 43, 63 – 76.
Martín-Piera, F. & Lobo, J.M. (2003) Database records as a sampling effort surrogate to predict spatial distribution of insects in either poorly or unevenly surveyed areas. Acta Entomológica Ibérica e Macaronésica, 1, 23 – 35.
May, R.M. (1975) Patterns of species abundance and diver-sity. Ecology and Evolution of Communities (eds M.L. Cody & J.M. Diamond), pp. 81–120. Harvard University Press, Harvard, MA.
Medellín, R.A. & Soberón, J. (1999) Predictions of mammal diversity on four land masses. Conservation Biology, 13, 143 – 149.
Melo, A.S., Pereira, R.A.S., Santos, A.J., Shepherd, G.J., Machado, G., Medeiros, H.F. & Sawaya, R.J. (2003) Com-paring species richness among assemblages using sample units: why not use extrapolation methods to standardize different sample sizes? Oikos, 101, 398 – 410.
Miller, R.I. & Wiegert, R.G. (1989) Documenting completeness, species– area relations, and the species-abundance distribu-tion of a regional flora. Ecology, 70, 16 –22.
Naeem, S., Håkanson, K., Lawton, J.H., Crawley, M.J. & Thompson, L.J. (1996) Biodiversity and plant productivity in a model assemblage of plant species. Nature, 368, 734 – 737.
Nunes, J.C.C. (1999) A Actividade Vulcânica na ilha do Pico do Plistocénico Superior ao Holocénico: Mecanismo Eruptivo e Hazard Vulcânico. PhD Thesis, Universidade dos Açores. O’Hara, R.B. (2005) Species richness estimators: how many
species can dance on the head of a pin? Journal of Animal Ecology, 74, 375 – 386.
Oliver, I. & Beattie, A.J. (1993) A possible method for the rapid assessment of biodiversity. Conservation Biology, 7, 562 – 568.
Oliver, I. & Beattie, A.J. (1996) Invertebrate morphospecies as surrogates for species: a case study. Conservation Biology,
10, 99 – 109.
Palmer, M.W. (1990) The estimation of species richness by extrapolation. Ecology, 71, 1195 – 1198.
Palmer, M.W. (1991) Estimating species richness: the second-order Jackknife reconsidered. Ecology, 72, 1512 – 1513. Palmer, M.W. & White, P.S. (1994) Scale dependence and the
species–area relationship. The American Naturalist, 144, 717– 740.
Petersen, F.T. & Meier, R. (2003) Testing species-richness esti-mation methods on single-sample collection data using the Danish Diptera. Biodiversity and Conservation, 12, 667– 686. Petersen, F.T., Meier, R. & Larsen, M.N. (2003) Testing spe-cies richness estimation methods using museum label data on the Danish Asilidae. Biodiversity and Conservation, 12, 687– 701.
Peterson, A.T. & Slade, N.A. (1998) Extrapolating inventory results into biodiversity estimates and the importance of stopping rules. Diversity and Distributions, 4, 95 –105. Pielou, E.C. (1975). Ecological Diversity. Wiley Interscience,
New York.
Pielou, E.C. (1977) The Interpretation of Ecological Data. John Wiley & Sons, New York.
Raaijmakers, J.G.W. (1987) Statistical analysis of the Michaelis-Menten equation. Biometrics, 43, 793 – 803.
Ricketts, T.H., Dinerstein, E., Olson, D.M., Loucks, C., Eichbaum, W., Kavanagh, K., Hedao, P., Hurley, P., Carney, K.M., Abel, R. & Walters, S. (1999) Terrestrial Ecoregions of North America: a Conservation Assessment. Island Press, Washington DC.
Romo Benito, H. & García-Barros, E. (2005) Distribución e intensidad de los estudios faunísticos sobre mariposas diurnas en la Península Ibérica e Islas Baleares (Lepidoptera, Papilionoidea y Hesperoidea). Graellsia, 61, 37– 50. Rosenzweig, M.L., Turner, W.R., Cox, J.G. & Ricketts, T.H.
(2003) Estimating diversity in unsampled habitats of a biogeographical province. Conservation Biology, 17, 864 – 874.
Scheiner, S.M. (2003) Six types of species–area curves. Global Ecology and Biogeography, 12, 441– 447.
Scheiner, S.M. (2004) A mélange of curves – further dialogue about species–area relationships. Global Ecology and Bio-geography, 13, 479 – 484.
Scheiner, S.M., Cox, S.B., Willig, M.R., Mittelbach, G.G., Osenberg, C. & Kaspari, M. (2000) Species richness, species–area curves, and Simpson’s paradox. Evolutionary Ecology Research, 2, 791– 802.
Shen, T.-J., Chao, A. & Lin, C.-F. (2003) Predicting the number of new species in further taxonomic sampling. Ecology, 84, 798 – 804.
Silva, L., Pinto, N., Press, B., Rumsey, F., Carine, M., Henderson, S. & Sjögren, E. (2005) Vascular plants (Pteridophyta and Spermatophyta). A List of the Terrestrial Fauna (Mollusca and Arthropoda) and Flora (Bryophyta, Pteridophyta and Spermatophyta) from the Azores (eds P.A.V. Borges, R. Cunha, R. Gabriel, A.F. Martins, L. Silva & V. Vieira), pp. 133 –155. Direcção Regional de Ambiente and Universidade dos Açores, Horta, Angra do Heroísmo and Ponta Delgada.
Smith, E.P. & van Belle, G. (1984) Nonparametric estimation of species richness. Biometrics, 40, 119 –129.
Soberón, J. & Llorente, J. (1993) The use of species accumulation functions for the prediction of species richness. Conservation Biology, 7, 480 – 488.
Sokal, R.R. & Rohlf, F.J. (1995) Biometry, 3rd edn. W.H. Freeman and Company, New York.
Sørensen, L.L., Coddington, J.A. & Scharff, N. (2002) Inventorying and estimating subcanopy spider diversity using semiquantitative sampling methods in an afromon-tane forest. Environmental Entomology, 31, 319 – 330. StatSoft, I. (2001) STATISTICA (data analysis software
system). StatSoft, Inc., Tulsa, OK.
Suarez, A.V. & Tsutsui, N.D. (2004) The value of museum collections for research and society. Bioscience, 54, 66 – 74.
Tilman, D., Wedin, D. & Knops, J. (1996) Productivity and sustainability influenced by biodiversity in grassland ecosystems. Nature, 379, 718 – 720.
Turner, W.R., Leitner, W. & Rosenzweig, M.L. (2000) Ws2m. Software for the Measurement and Analysis of Species Diversity, Version 3·2 (beta). User’s Guide and application published at: http://eebweb.arizona.edu/diversity/.3·2 (beta) edn. Department of Ecology & Evolutionary Biology, University of Arizona, Tucson, AZ.
Turquin, M.-J. (1973) Une biocenose cavernicole originale pour le Bugey: Le puits de Rappe. Commptes Rendus 96e Congresse Naturel Sociétès Savantes, Toulouse 1971, Sciences, 3, pp. 235 – 256.
Ugland, K.I., Gray, J.S. & Ellingsen, K.E. (2003) The species-accumulation curve and estimation of species richness. Journal of Animal Ecology, 72, 888 – 897.
Walther, B.A., Cotgreave, P., Gregory, R.D., Price, R.D. & Clayton, D.H. (1995) Sampling effort and parasite species richness. Parasitology Today, 11, 306 – 310.
287
Effect of grain size on species richness estimators © 2006 The Authors Journal compilation © 2006 British Ecological Society, Journal of Animal Ecology, 75, 274–287
Walther, B.A. & Martin, J.-L. (2001) Species richness estimation of bird communities: how to control for sampling effort? Ibis, 143, 413 – 419.
Walther, B.A. & Moore, J.L. (2005) The definitions of bias, precision, and accuracy, and their use in testing the per-formance of species richness estimators, with a literature review of estimator performance. Ecography, 28, 815 – 829.
Walther, B.A. & Morand, S. (1998) Comparative performance of species richness estimation methods. Parasitology, 116, 395 – 405.
Whittaker, R.J., Willis, K.J. & Field, R. (2001) Scale and species richness: towards a general, hierarchical theory of species richness. Journal of Biogeography, 28, 453 – 470. Received 13 May 2005; accepted 11 October 2005